| Dear Readers: This is the latest edition of the Crystal Ball’s “Notes on the State of Politics,” which features short updates on elections and politics.
— The Editors |
New York City posts initial returns, but full results are likely weeks away
Brooklyn Borough President Eric Adams grabbed a nearly 9.5-point lead over his closest rival, progressive lawyer Maya Wiley, in the New York City Democratic mayoral primary last night. With about 800,000 votes tabulated so far, Adams has almost 32% to Wiley’s 22%, with former city Sanitation Commissioner Kathryn Garcia in third, at just under 20%. Former presidential candidate Andrew Yang, who led early polls of the race but faded down the stretch, lagged far behind in fourth, with nearly 12%. Everyone else was in single digits.
Based on a report by the Board of Elections of the City of New York from yesterday afternoon, there are at least 87,000 uncounted Democratic absentee ballots, and those won’t begin to be tabulated until next week. There is also the matter of the city’s new ranked-choice voting system. While one of course would rather be Adams, given his strong early lead, it’s possible that Wiley (or even Garcia) could catch him as lower-performing candidates are eliminated and their ranked-choice selections are allocated to better-performing candidates. In the 2010 Oakland mayoral race, the leader in the first round of tabulation had a lead approximately the same size as Adams has, but he ended up losing to another candidate when the ranked-choice vote count concluded.
Adams finished first in four of the five boroughs, while Garcia finished first in Manhattan (New York County). This general alignment fit with what pre-election polling indicated, which was that Adams was likelier to do better outside of Manhattan and with more working-class voters, while Garcia’s appeal was strongest among those who hold a four-year college degree (Manhattan has, by far, the highest four-year college attainment of any of the five boroughs). Wiley came on as Election Day got closer, attracting endorsements from leading progressives such as Rep. Alexandria Ocasio-Cortez (D, NY-14) and Sen. Elizabeth Warren (D-MA). Wiley performed well in some gentrifying areas of Brooklyn and Queens.
Adams might have done even better if his best-performing borough, the Bronx, had cast a larger share of the vote. In the past two Democratic mayoral primaries, the Bronx cast, on average, 14.4% of the citywide vote. So far, it’s only cast 11.7% of the votes. We’ll see if that changes once all the votes are in (for what it’s worth, the aforementioned Board of Elections report does not suggest a disproportionately large share of submitted absentee ballots are from the Bronx).
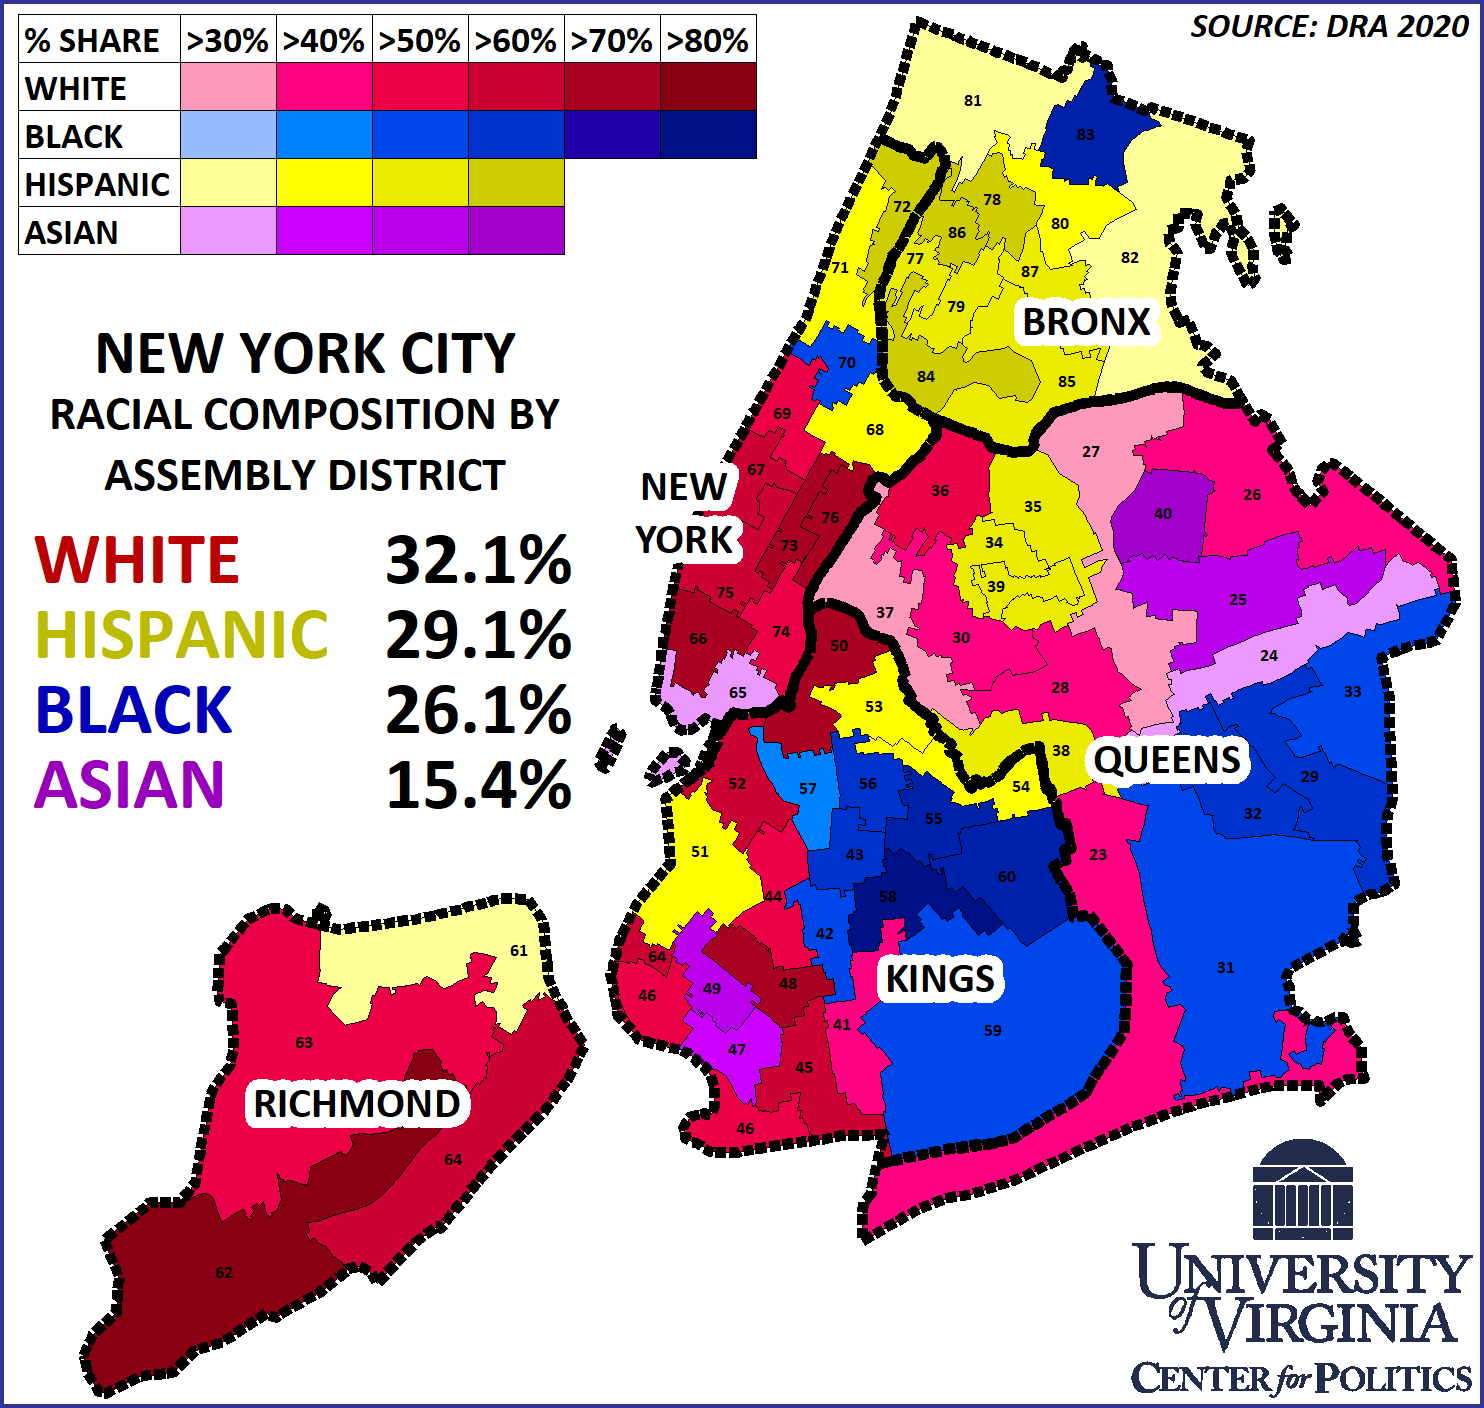
One can definitely see some racial patterns in the results. As a reminder, here’s our map from last week that shows the largest racial/ethnic group in each of the city’s state assembly districts:
Map 1: Racial composition of New York City
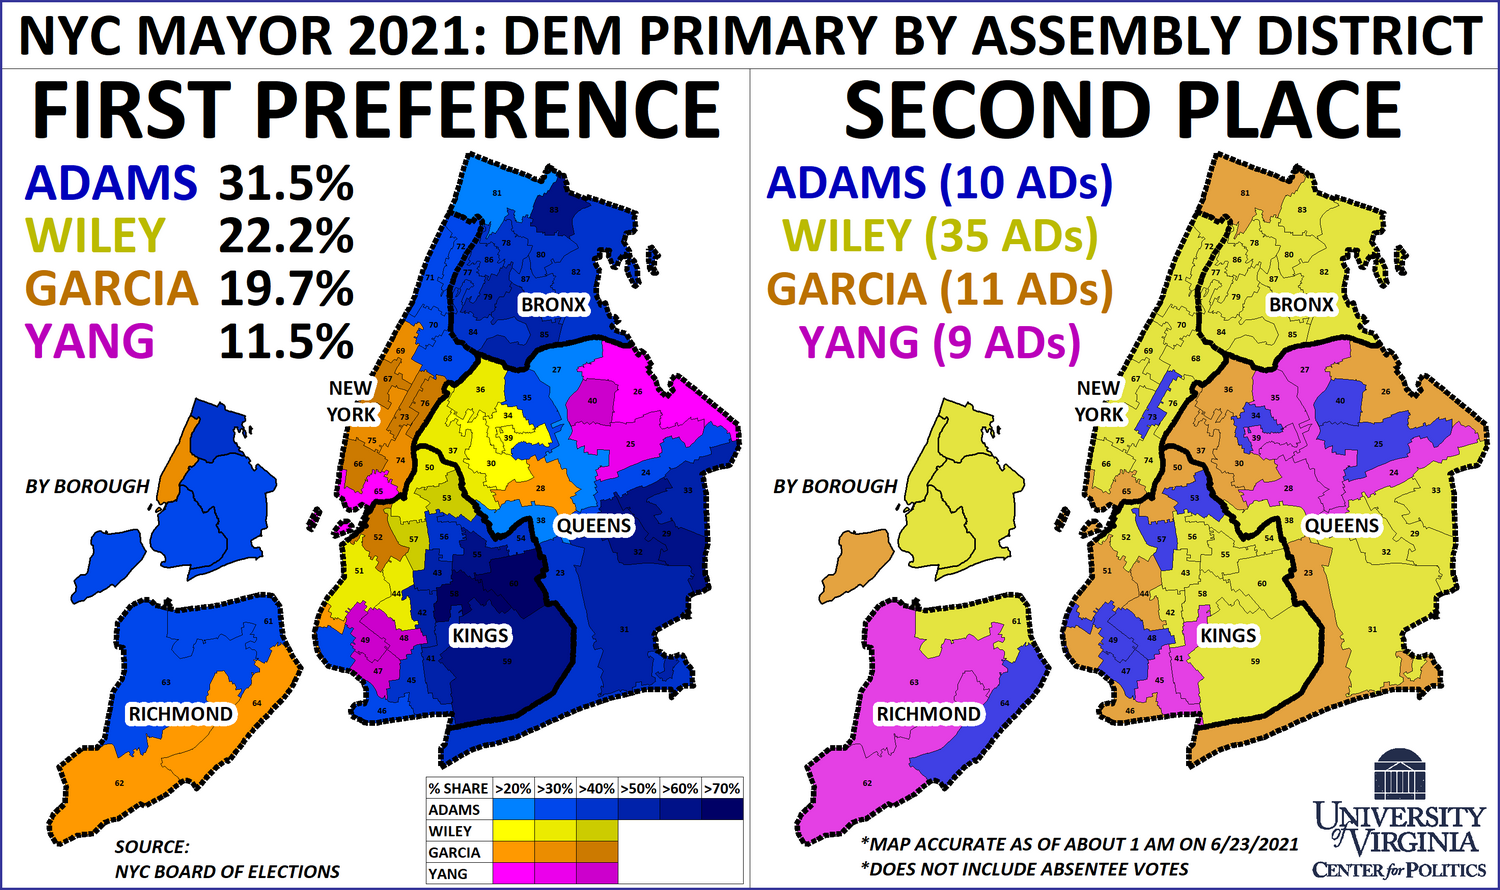
Now, here are the results we have so far, also by assembly district. The left map shows the first preference while the right map shows which candidate finished second. Importantly, the second-place finisher on the right map was not necessarily the second preference of voters in that district — we don’t know anything yet about how voters ranked the candidates after their first choice.
Map 2: New York City Democratic mayoral primary initial returns
Some observations:
— Though Eric Adams’ best borough was the Bronx (where he swept every district), his strongest overall pocket of the city was in southeastern Brooklyn (Kings County) by Jamaica Bay — essentially neighborhoods like Flatlands and East New York. These are generally Black-majority assembly districts, and Adams is a Black candidate.
— Other than Adams, no one cleared 50% in any assembly districts — and sometimes Adams was well above 50%.
— While Andrew Yang, an Asian-American candidate, did poorly overall, he carried most plurality-Asian districts. He was also in second place in many Queens ADs with sizeable Asian populations.
— Yang also seemed to run well with Orthodox Jews; an example is district 48, which takes in the Borough Park neighborhood.
— Wiley placed second in the most assembly districts, 35 of the 65 that the city contains. We will have to see if she can translate that wide but not necessarily deep support into a first-place finish as the final votes are counted and the ranked-choice allocation process begins.
Is Iowa (really) ready to move beyond Grassley?
One of the more eyebrow-raising polls so far this cycle came last weekend in Iowa. According to a Des Moines Register/Mediacom survey from Selzer & Co., the state’s preeminent pollster, 64% of Iowa voters would prefer to send “someone new” to the Senate in 2023, instead of Sen. Chuck Grassley (R-IA). Just 27% said they wanted to reelect Grassley.
At age 87, Grassley has not announced whether he’ll seek an eighth term in 2022. Though the senator seems mentally and physically sharp — he’s kept up his annual tradition of visiting all 99 of the state’s counties at least once a year — he is still the chamber’s second-oldest member, which could weigh on voters’ minds.
Grassley is a political institution in the Hawkeye State, and he holds a record of public service that dates back to the Eisenhower presidency. Though he was elected to his current office in 1980 — with some help from Ronald Reagan’s coattails — Grassley won his prior political offices by running against the national tide. In 1958, a Democratic wave year, he was first elected to the state legislature. In 1974, when the Watergate scandal drove Democratic gains across the county, he won a seat in Congress — during his first years in the House, he was the sole Republican in the Iowa delegation.
But times are different now, and Iowa is a clearly red state today, at least in federal elections. As a result of the 2020 elections, Iowa only sends one Democrat to Capitol Hill — a reversal of 1974.
Still, Selzer has a reputation for prescient polls that may seem eyebrow-raising at first blush; just days ahead of both the 2016 and 2020 elections, the firm predicted Donald Trump’s impressive showings in Iowa. So how do we reconcile this apparent Grassley fatigue with the state’s Republican trend?
First, it’s important to remember that congressional elections are choices between two candidates, not referendums. While a notable chunk of Republicans in Selzer’s poll, 37%, agreed that a new senator would be preferable, when push comes to shove, it’s hard to imagine this same bloc voting for the Democratic nominee en masse.
Ahead of his 2012 reelection, former Sen. Bill Nelson (D-FL) was not especially popular with voters of his own party — a late 2010 survey from Public Policy Polling found his approval with Democrats at just 45%, as his overall approval spread was a (very anonymous) 36/33. But Democrats who were lukewarm about Nelson ended up supporting him anyway in the general election, and he won by 13 points against a Republican. Assuming Grassley runs again and gets renominated, he’ll likely see that same type of partisan consolidation.
In a similar vein, pollsters will sometimes ask whether a politician “deserves reelection.” As the 2016 cycle was getting underway, Sen. Michael Bennet (D-CO) found himself in a seemingly perilous position: according to a Quinnipiac University Poll, only 30% of Coloradans agreed that he deserved another term. Even worse, voters had just ousted his former Democratic colleague, Mark Udall, the previous cycle — in July 2014, the same pollster found Udall’s “deserves reelection” number at 40%, better than Bennet’s. But Bennet won — and Udall lost — because elections don’t happen in a vacuum. In 2014, Udall faced a top-tier opponent in a GOP wave year; in 2016, Hillary Clinton carried Colorado by a 48%-43% vote, and the senatorial results that year were tightly linked to the top of the ticket.
In a more recent example, a 2017 WBUR poll found that only 44% of Bay State voters thought that Sen. Elizabeth Warren (D-MA) deserved reelection, to 46% who were ready to “give someone else a chance.” Warren won reelection by an easy 60%-36% margin the next year.
Dan Guild, a friend of the Crystal Ball, made a smart comparison to the late Sen. Frank Lautenberg (D-NJ). In 2008, at age 84, Lautenberg stood for reelection in the Garden State. At the time, early 2008 polling from Monmouth University found that 58% of voters would have preferred a new senator, while just 19% favored the incumbent for another term. But Lautenberg was ultimately reelected by a 56%-42% spread that year — the widest margin of his career.
So this is all to say that, even though Grassley’s “deserves reelection” numbers seem low, some reluctant voters will probably end up in his camp anyway. The Selzer poll also has some other promising results for him. In the 2020 general election, President Biden lost Iowa by eight percentage points, as the state went 53%-45% for Trump. Selzer finds that Biden’s standing in the state is basically unchanged, as his approval spread is a negative 43/52. If Biden is unpopular in Iowa, Grassley’s path to another term — if he wants another term — is easier.
Since 1980, Grassley has been reelected to the Senate with large majorities every six years, regardless of the national environment. But there are signs that, if he runs, it may be his closest reelection race yet, even if it’s still a comfortable win. Former Rep. Abby Finkenauer (D, IA-1), who narrowly lost her eastern Iowa seat last year, seems to be seriously considering the race — she would probably be a cut above some of his more recent opponents. Second, Grassley’s 2016 margin, 24%, was his weakest reelection spread of his career, suggesting that the days where he’d win by 30-40 percentage points or more may be gone.
Warning signs for Democrats in new Monmouth poll
Note: This item was written by Parakram Karnik, a Crystal Ball intern.
A recent poll released by Monmouth University has some red flags for Democrats as they try to defend their newly-won control of Washington.
President Biden’s approval rating dropped six percentage points since Monmouth’s last poll in April. When Monmouth last surveyed Americans in April, the pollster found that 54% of Americans approved of Biden’s job in office, while 41% disapproved. These numbers now sit at 48% and 43% respectively. This can be contextualized within an approximately five-point drop in Biden’s approval rating in FiveThirtyEight’s average within the same timeframe (Biden’s net approval in the average was +14 in mid-April, and it is +9.5 now). This is the lowest that Biden’s net approval rating has been in the FiveThirtyEight average since his inauguration. So Monmouth is not the only pollster to find Biden’s approval weakening to at least some degree.
Meanwhile, the Democratic Congress has lost its luster from earlier this year. In April, approval of Congress was sitting at 35% — that number is not great, but it’s better than Congress often has. For reference, in May 2017, approval of Congress was 19%, and that number rarely changed in a significant manner until 2018, when Democrats took the speaker’s gavel from the Republicans. However, the congressional approval rating now sits at 21%, down 14% from April. If the Democrats can’t get this number up again, they will be in the same ballpark as the GOP was in 2017-2018. Furthermore, after a relatively rosy period in April when roughly even amounts of Americans thought the country was going in the right or wrong direction, only 37% of Americans still believe that the United States is currently sailing towards a better tomorrow, down 9% from April. For reference, the number generally hovered around 35% in 2018. Meanwhile, 57% of Americans now believe that this country is headed in the wrong direction, up 7% from April. The RealClearPolitics averages of congressional approval and right/wrong direction polling have also weakened somewhat in the same timeframe.
One point often touted by strategists, particularly progressive ones, is that Democrats may get better numbers when Congress actually passes popular and wide-reaching legislation. And it is fair to note that when Americans were told that Biden’s infrastructure and healthcare/childcare plans would cost trillions of dollars, 68% and 61% of Americans surveyed by Monmouth still supported the legislation, and 49% strongly supported the infrastructure bill. The other piece of good news for Democrats is that the approval ratings of these bills have remained remarkably stable throughout the year, showing that, even as Americans become more informed on these bills, their opinions on these bills have not significantly changed. However, there is one thing that the Democrats must consider: inflation. According to this poll, 71% of Americans are concerned to some degree about inflation caused by Biden’s plans, including 47% who are very concerned. Democrats must be very careful when it comes to managing potential inflation caused by these bills, which could provide an opening for Republicans. It’s also unclear whether Democrats will be able to pass these bills or other proposed legislation. The two parties are currently negotiating over an infrastructure package that might attract bipartisan support, although the Democrats may lose some of the left in the process.
In summary, this poll fits broadly within the trends that poll averages are reporting, which is that Biden’s numbers and other numbers important to the ruling party are weakening to some degree. The odds are almost always stacked against the president’s party in a midterm setting, and Biden needs to keep his approval rating positive to give Democrats a better chance to avoid losses in the House and the Senate.
The Monmouth poll was conducted June 9-14, and more information on it is available here.