| Dear Readers: Join us tomorrow, Wednesday, Feb. 9, as Center for Politics Director Larry J. Sabato interviews Rep. Ro Khanna (D, CA-17) about Khanna’s new book, Dignity in a Digital Age: Making Tech Work for All of Us. The program will run from 6:30 p.m. to 7:30 p.m. eastern time. You can watch at this link.
See here for more information about the event. — The Editors |
KEY POINTS FROM THIS ARTICLE
— Thanks in large part to state courts ruling against Republican gerrymanders in North Carolina and Ohio and Democrats drawing an aggressive gerrymander of New York, the Democratic position has improved in our running assessment of House redistricting so far. Republicans remain favored to flip the House in 2022.
— The new Democratic gerrymander in New York gives the party a great chance to win 22 of the state’s 26 seats, although they may not realize those ambitions fully in 2022.
— The newly-enacted Republican gerrymander in Tennessee gives the GOP what should be a very easy pickup in November.
Our running redistricting tally
Amidst an almost-daily flurry of redistricting news, the Democrats’ position has improved from our last update about a month ago.
The primary reason for this is that aggressive gerrymanders by Republicans in North Carolina and Ohio were struck down by state courts, and for the time being, those states do not have maps. Meanwhile, Democrats enacted an aggressive gerrymander of their own in New York, which we will analyze in some depth below. There have been other important developments — such as the U.S. Supreme Court allowing the Republicans’ 6-1 gerrymander of Alabama to stand for 2022 after a lower court had struck it down on racial grounds and the Republicans enacting an 8-1 gerrymander of Tennessee — but the action in those 3 aforementioned big states is what is driving the changes in our overall accounting of redistricting.
A few days after New Year’s Day, we listed 283 districts (out of 435) as having completed redistricting. Based on our ratings of the new districts, we had 135 seats rated Safe, Likely, or Leans Republican, and an identical number, 135, rated at least Safe, Likely, or Leans Democratic. We also had 13 Toss-ups. Compared to what the parties already held in these states, we had Republicans up 2 seats and Democrats down 14. The significant Democratic decline included several seats rated as Toss-ups, some of which would have been Toss-ups under both the old and new district lines.
As of Tuesday, Feb. 8, we list 308 districts (or about 71% of all the districts) as having new lines (that excludes North Carolina and Ohio, who moved out of the “completed” group following court action, and includes New York and a handful of other states that have completed redistricting in recent weeks). We now rate 156 of these districts as Safe, Likely, or Leans Democratic, 138 as Safe, Likely, or Leans Republican, and 14 as Toss-ups. Democrats are down 10 seats from what they currently hold in these states, and Republicans are down 4 (the full ratings are here). So the situation is a little better for Democrats and a little worse for Republicans — and, again, those developments in the big states are driving the action. That said, the Democrats still would have to win the lion’s share of the Toss-ups to maintain parity with what they have now in the states that have finished redistricting — something that is likely going to be very difficult given what very well could be a challenging set of political circumstances for Democrats in the fall.
Overall, we continue to see Republicans as favorites to win the House majority in November. That continues to have much more to do with the political environment than redistricting.
With that, let’s take a closer look at the recently-enacted New York map, which is a Democratic gerrymander.
Partisan gerrymanders pass in New York, Tennessee
As the Crystal Ball was anticipating in our update last week, a couple of congressional gerrymanders were signed into law over the past few days, with New York Democrats and Tennessee Republicans both getting their way.
Though New York had a newly-formed independent commission to oversee the line drawing this cycle, the legislature retained the power to draw the lines itself. As expected, Democratic legislators ended up doing just that, and Gov. Kathy Hochul (D-NY) made good on her earlier suggestion that she’d use the redistricting process to boost her party’s prospects.
Hochul’s approach is a departure from that of her predecessor, former Democratic Gov. Andrew Cuomo. A decade ago, he seemed intent on taking the high road, and publicly decried gerrymandering — Republicans also still controlled the state Senate back then, meaning that neither side could dominate the process. As a result, New York ended up going with a court-drawn map for the decade. But this round, New York supplanted Illinois as the largest state where Democrats had a free hand in drawing a map, although some Republicans may complain that California’s independent commission made consistently pro-Democratic choices.
While New York lost a district — had it counted just 89 more residents in the last census, it would have retained all its seats — Democrats seem likely to come out ahead. If the Democratic plan pans out as intended, the number of Republicans in the New York delegation will shrink from 8 of 27 to 4 of 26.
In surveying the Empire State, we don’t have to look far to see the handiwork of Democratic map-drawers. On Long Island, NY-1 and NY-2 began as light-red Republican-held seats — both gave Trump 51% of the vote 2020. But redistricting pushed them in politically divergent directions.
The last Democratic midterm, 2014, turned out to be an especially rough cycle for New York Democrats. In NY-1, which is the eastern half of Suffolk County, then-Rep. Tim Bishop (D, NY-1) lost by a wide 9-point margin to then-state Sen. Lee Zeldin. In the cycles since then, the district has been an on-and-off target for national Democrats, though Zeldin has usually won by similar margins. But last spring, as scandals were beginning to engulf then-Gov. Cuomo’s tenure, Zeldin entered the gubernatorial contest, opening up NY-1.
Meanwhile, for much of the last decade, Republicans held down NY-2, which was drawn to be the bluer of the 2 seats, with Peter King, a bombastic moderate whose attention to local issues paid off at home. When King retired in 2020, Republican Andrew Garbarino won the seat over Democrat Jackie Gordon, who had support from the moderate Blue Dog Coalition.
In their remap, Democrats made NY-1 several notches bluer — adding precincts around the town of Islip bumped Joe Biden’s share in the district from 47% to 55% — while they conceded NY-2, where Biden’s share drops from 47% to 42%. Garbarino is safe in the new 2nd while the 1st looks likely to see competitive primaries on both sides (the Democratic field includes Gordon). We are starting NY-1, which covers some traditionally swingy areas, as a Toss-up, although this is a district Democrats should be able to win in most years (it’s just that 2022 might be a bad Democratic year, which has bearing on all of our ratings).
Moving west — and closer to New York City — Rep. Kathleen Rice’s (D, NY-4) district sees few substantial changes. NY-4 is contained entirely within Nassau County, and, in the old district, Rice’s 56% was close to the 55% Biden took. The Crystal Ball rates NY-4 as Likely Democratic.
NY-3, which is being vacated by 3-term Rep. Tom Suozzi, who is mounting an uphill primary challenge against Hochul, saw some creative changes. Though it retains its Long Island focus — 2/3 of its population comes from Nassau and Suffolk counties — it reaches across the Long Island Sound to grab about 143,000 Westchester County residents. NY-3 also adds a handful of Bronx precincts. These additions nudge Biden’s share in the district up to 56.4% from 54.5%. We are starting this district as Likely Democratic too.
The Democratic primary for NY-3 already includes at least 6 candidates — state Sen. Alessandra Biaggi was the most recent candidate to enter, though she comes from the part of the district that was most recently added and will likely have to make inroads in Long Island. George Santos, the GOP’s 2020 nominee, is running again, and Curtis Sliwa, Republicans’ 2021 nominee for New York City mayor, is also openly considering the race.
The only district that is located entirely within New York City that should be competitive between the 2 parties is NY-11. While the majority of the district still comes from Staten Island — by far the most conservative of the city’s 5 boroughs — NY-11 expands its holdings in Brooklyn. Importantly, those new precincts are heavily Democratic. On the outgoing map, Biden carried the Brooklyn part of NY-11 by just 50%-49%. By taking the district into the Park Slope neighborhood, the mappers expanded that Brooklyn Biden margin to 79%-20%. Overall, the new district supported Biden by almost 10 points.
While the changes to NY-11 don’t bode well for first-term Republican Rep. Nicole Malliotakis, we are starting the race out as a Toss-up. Former Rep. Max Rose (D, NY-11), who held the seat for a term before losing to Malliotakis, would probably start out as a favorite in the general election, but he may have to work for the Democratic nomination. Rose was known as a moderate Democrat while he was in Congress — while this helped him run ahead of Biden in the old district, primary voters in the newer (and trendier) parts of the district may be less impressed. Former New York City Mayor Bill de Blasio, who lives in Park Slope, is also reportedly considering a run in the district. Though he beat Malliotakis, who was then his GOP opponent for mayor in 2017, in a landslide, she would have carried the new NY-11 by 18 points in her mayoral run. Of course, local voting patterns don’t always carry over to federal elections, but the Democratic primary in the district could be crucial.
Moving to Upstate New York, Democrats made several key changes aimed at bolstering their prospects.
Map 1 compares the Upstate districts on the outgoing map to those on the recently-enacted map. Though there has been some debate among geography buffs and locals as to where the region starts, for our purposes, we’re defining the “Upstate” districts as those that are located entirely north of New York City. Additionally, as Hillary Clinton performed a bit worse than Biden throughout the region, we’re using the 2016 presidential numbers, which are less rosy for Democrats than 2020’s, as a baseline for Map 1.
Map 1: Upstate New York Districts, 2020 vs 2022
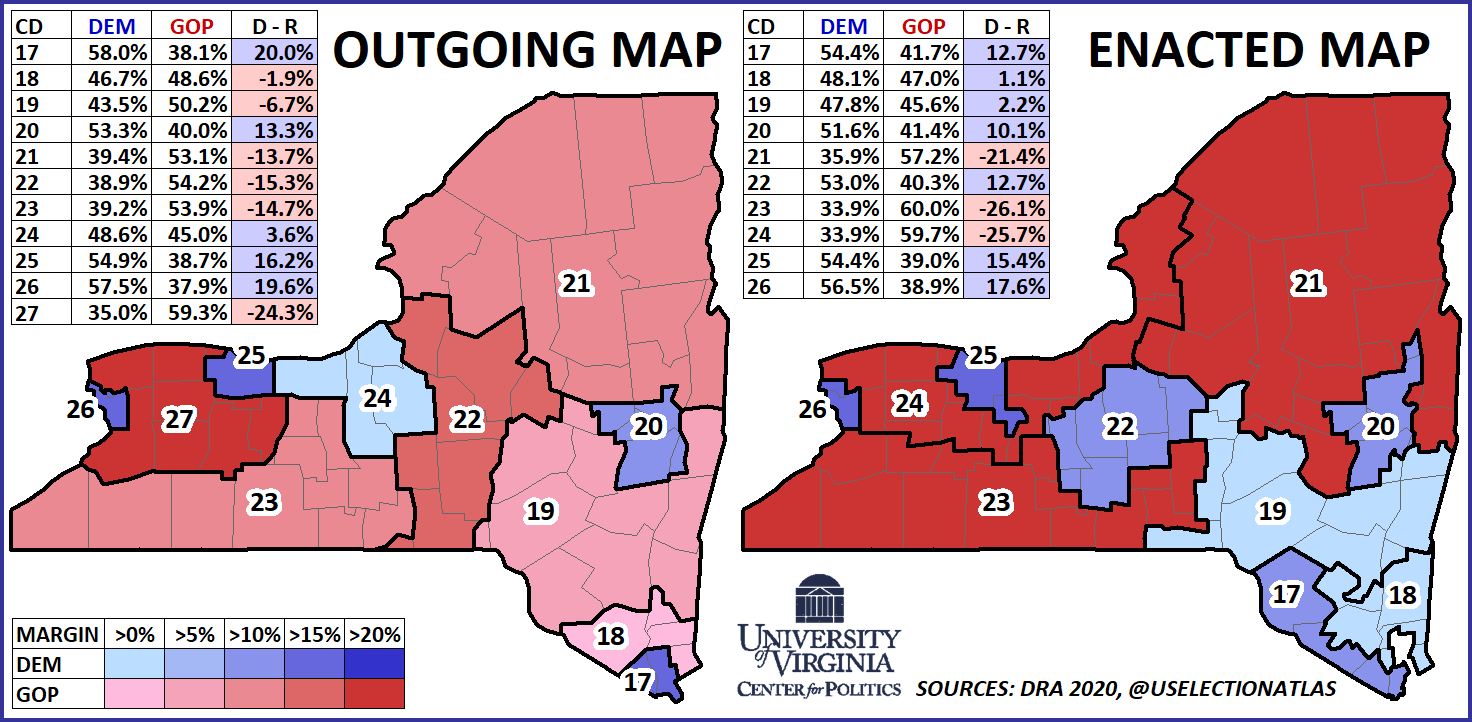
On the outgoing map, Trump carried 6 districts to Clinton’s 5 — that balance become 7-3 in Clinton’s favor on the new map. The 3 remaining Trump-won seats are also, collectively, considerably safer: There are no marginal Trump seats on the new map, as he carried all 3 by over 20 points.
Rep. Elise Stefanik (R, NY-21) retains a North Country seat that, geographically, sits atop the state. Though this area was competitive a decade ago — if it was in place in 2012, it would have likely been a rare McCain-to-Obama seat — it swung sharply rightward in the Trump era.
NY-27 is the most heavily Republican seat on the current map — speaking of 2012, Gov. Hochul narrowly lost reelection in this district that year. Though NY-27’s designation was eliminated (the state now only has 26 districts), the new NY-24 could be considered its successor. The redrawn 24th is a curious district that begins in the Buffalo area and, aside from a few miles of waterfront in Rochester, runs the length of Lake Ontario. About 60% of the new 24th comes from counties that Rep. Chris Jacobs (R, NY-27) currently represents, so he should be a heavy favorite in the primary and the general election.
The third safely Republican seat on the new map is NY-23, which is an open district encompassing most of the Southern Tier. Republican Rep. Claudia Tenney was clearly the member most adversely impacted by the new plan: her current NY-22 was split 5 ways. Though she only represents less than 10% of the new 23rd, it seemed the most logical option for her, and she has announced a run there. Though Tenney was known for her two close bouts with former Democratic Rep. Anthony Brindisi — she lost 51%-49% in 2018, then beat him by 109 votes in 2020 — she, or basically any Republican nominee in the new 23rd, will not have much to worry about in NY-23 for the general election.
Staying in western New York, Rep. Joe Morelle (D, NY-25) and Brian Higgins (D, NY-26) both see relatively minor changes to their districts — the former represents Rochester while the latter has Buffalo. Democratic mappers could have probably drawn a third blue seat in the area, but perhaps that would risk spreading their voters too thin. As it was, Morelle’s predecessor, the late Democratic Rep. Louise Slaughter — an institution in the region — was nearly upset in 2014. Higgins’ predecessor, Rep. Jack Quinn, was a popular Republican who, at times, could run over 50 points ahead of the national ticket. Though such Republicans are rare now, perhaps those memories informed the more cautious approach Democrats took.
In fact, something that helped Democrats going into the redistricting process was that Republican Rep. John Katko — an overperformer who may be the closest contemporary equivalent to Jack Quinn — announced his retirement. Katko’s district, long based in the college town of Syracuse (where President Biden earned his law degree) gets more Democratic as it adds Ithaca, which includes Cornell University. In 2020, Biden carried Ithaca’s Tompkins County by a nearly 50-point margin, making it the bluest county in the state, aside from 3 counties in New York City.
The new Syracuse-to-Ithaca seat favored Clinton 53%-40%, and Biden took that spread up to 58%-40%. Still, in midterm years, college counties can have some odd turnout dynamics, and, as an open seat, we’re reluctant to move NY-22 completely off the board. We’re starting it as Likely Democratic.
Rep. Paul Tonko (D, NY-20) who was first elected in 2008 to represent the state’s capital city, takes a slight hit — Clinton’s share in his Albany-area seat drops by 3 points — but Republicans have usually not made strong attempts at this seat.
Some of the most substantial changes on the new map are south of Albany, in the Hudson Valley, where Democrats had to shore up some of their swing-district incumbents.
Though 2-term Rep. Antonio Delgado (D, NY-19) was already known for earning significant crossover support, mappers strengthened his hand: his new district would have matched the national vote in 2016, going 48%-46% for Clinton, and it replaces a district that went to Trump by almost 7 points that year. Delgado’s new 19th adds the Democratic-leaning parts of the old 22nd — specifically the cities of Binghamton and Utica — as well as some blue precincts in Albany’s orbit, while it sheds about 95,000 residents in Dutchess County.
That last change was almost certainly not by happenstance: Delgado’s likely general election opponent is Dutchess County Executive Marc Molinaro. As the GOP’s gubernatorial nominee in 2018, Molinaro carried his home county 52%-45% against Cuomo — for context, it favored Clinton by less than 500 votes in 2016 and gave Biden a clearer 54%-44% margin in 2020. Molinaro would’ve actually carried the redrawn NY-19 by 3 points in his 2018 statewide bid, although Cuomo was probably uniquely unpopular Upstate.
Going further south, Rep. Sean Patrick Maloney (D, NY-18), who is running for a 6th term while chairing the Democratic Congressional Campaign Committee, is also helped. NY-18, which supported Trump by 2 points in 2016, was redrawn into a district where Clinton claimed a 48%-47% plurality. Perhaps tellingly, despite now containing almost all of Dutchess County, it would have gone to Cuomo by 272 votes in 2018. A key change in NY-18 was the addition of Peekskill, in upscale Westchester County, while much of Putnam County — the sole county in the current district that Maloney has never carried — is roped into fellow Democrat Jamaal Bowman’s NY-16, where it is easily drowned out by Bronx precincts. The highest-profile Republican prospect here is state Assemblyman Colin Schmitt.
We’re starting NY-18 as Leans Democratic and NY-19 as Likely Democratic.
Ideally for Democrats, the map they gerrymandered for themselves would produce a 22-4 statewide edge, up substantially from the 19-8 advantage they hold now. However, our ratings suggest they will have to work to actually realize this advantage in 2022 if indeed there is a Republican-leaning political environment.
In drawing this gerrymander, aside from ignoring the independent redistricting commission that voters created in 2014, Democrats were also were able to muster 2/3rds supermajorities to enact the gerrymander after voters rejected an effort to ease their path to a gerrymander in last year’s November elections.
However, the 2014 constitutional amendment did add language to the state constitution stating that districts should be “as compact in form as practicable” and “shall not be drawn to discourage competition or for the purpose of favoring or disfavoring incumbents or other particular candidates or political parties.” Republicans certainly can make a credible argument that this map violates those principles. Rep. Jerrold Nadler’s NY-10 — which uses a thin strip of precincts to connect dark blue parts of Manhattan to Republican-leaning Orthodox Jewish neighborhoods of Brooklyn — has emerged as a prime point of contention. Whether the courts ultimately agree is unknown: All 7 members of the state’s highest court, the New York Court of Appeals, were appointed by Democratic governors.
Compared to New York, Tennessee represented gerrymandering on a somewhat smaller scale, but the map has already been consequential.
Going into the round of redistricting, it seemed an open question whether Republicans in red states would target Democratic-held districts that were surrounded by red territory, such as IN-1 in northwestern Indiana and KY-3 in Louisville. While those districts have survived largely intact, veteran Rep. Jim Cooper (D, TN-5) was not as fortunate: the heavily Republican legislature in Tennessee split his Nashville base among 3 double-digit Trump seats. Map 2 considers the 2020 presidential and 2018 Senate (which was closer) results under Tennessee’s new map.
Map 2: 2018 and 2020 results on new Tennessee map
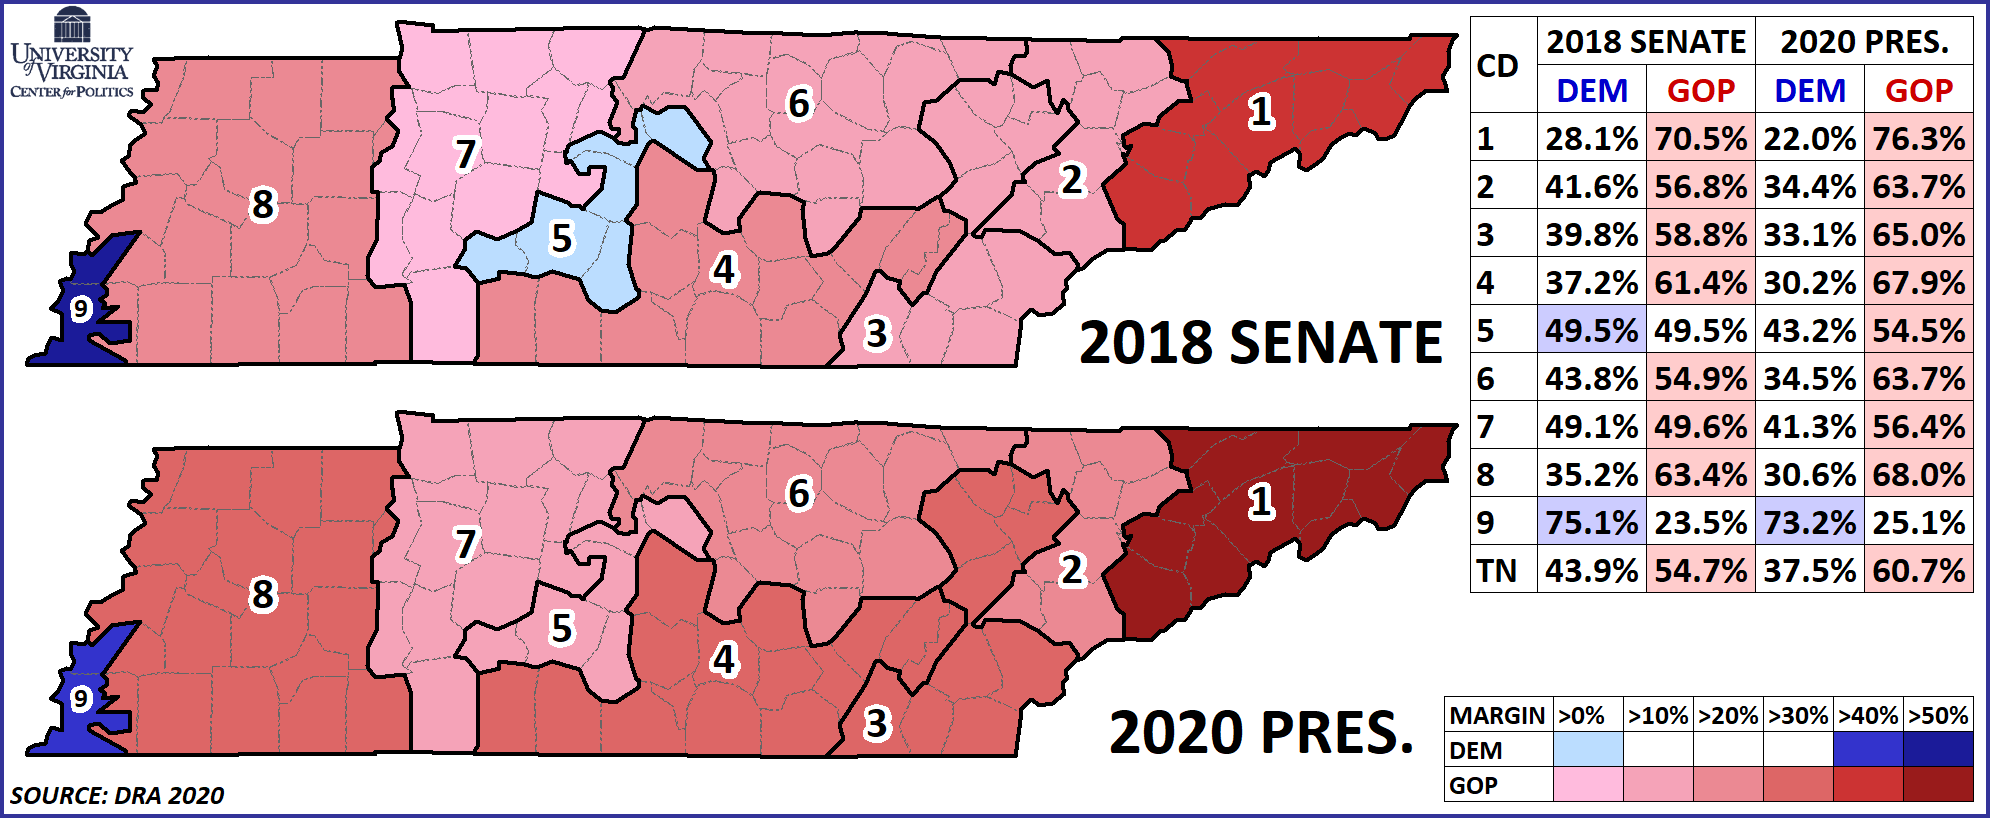
Though former Gov. Phil Bredesen (D-TN) very narrowly carried the redrawn TN-5 against now-Sen. Marsha Blackburn (R-TN), in a year like 2022 is shaping up to be (read: pro-Republican), replicating that feat would be hard for any Democrat — with that, Cooper announced his retirement last week. Perhaps with the trends in the Nashville metro, Democrats will recover the district at some point this decade, but for now, the Republican gerrymander seems likely to have its intended impact.
The new TN-7, which actually has the bluest portion of Davidson County (Nashville), may be another longer-term Democratic target, but it will take considerable investment. About a quarter of the new TN-7 comes from Davidson County, and those voters gave Biden 72% — but the rest of the district is nearly as Republican, giving Trump 66%. In 2008, Obama claimed a respectable 47% in the district, but to make up for the slump they’ve seen in the rural counties since then, Democrats will probably be more reliant on any gains in suburban Williamson County.
Aside from those districts, the rest of the map is straightforward. TN-9, in the Memphis area, gains some exurban precincts in Tipton County, but keeps its Black majority. While Districts 2 and 3 each have a blue-trending population center, Knoxville and Chattanooga, respectively, both districts include a sampling of smaller and much redder counties.