| Dear Readers: We will be back Thursday afternoon at 2 p.m. for our final Sabato’s Crystal Ball: America Votes webinar before next Tuesday’s election. We will also have a reaction show the Thursday after the election.
The livestream will be available at our YouTube page, UVACFP. If you have questions you’d like us to answer during the program, just email us at [email protected]. Today, we’re pleased to feature Senior Columnist Alan Abramowitz, who is presenting his final forecast of the presidential race. — The Editors |
KEY POINTS FROM THIS ARTICLE
— A presidential election forecasting model based on the president’s approval rating, first published at the Crystal Ball in early August, continues to show Joe Biden as a favorite in next week’s presidential election.
— An average of current state-level polling produces a very similar Electoral College projection.
— These forecasting methods produce projections very similar to a more complex model published by FiveThirtyEight.
Forecasting models point to Biden
Models for forecasting presidential elections fall into two broad categories. Many political science models, including my own “time for change” model, use election fundamentals such as the state of the economy and the incumbent president’s approval rating to predict either the popular or the electoral vote. By using measures of these fundamentals from the spring or summer of the election year, such models can make a prediction several weeks before Election Day.
In contrast, the second type of forecasting model uses polling data and, sometimes, past election results and other factors
to predict the outcome of the election at the state level and then combines these state forecasts to predict the national electoral vote. Perhaps the best-known example of such a forecasting model is the one published by Nate Silver’s FiveThirtyEight website. These forecasts based on state polling results are typically updated on a daily basis right up until the day of the election.
Forecast 1: The Simplified Model
In this article, I will present forecasts based on both of these methods. One forecast is based on a simplified version of the “time for change” model originally published in the Crystal Ball on Aug. 4. The simplified model used the incumbent president’s net approval rating in late June or late October to predict the electoral vote. The model using President Trump’s net approval rating of -15 in late June predicted that Joe Biden would receive 319 electoral votes to 219 for Trump and gave Biden a 71% chance of winning the electoral vote.
Table 1: Conditional forecasts of Trump electoral vote and probability of victory based on late October net approval rating
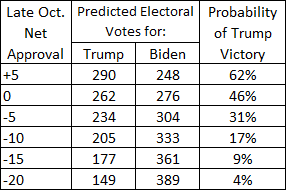
Source: Predictions based regression analysis of incumbent electoral vote on late October net approval rating for U.S. presidential elections with running incumbents, 1952-2012.
We can now update the forecast from the simplified model based on the latest measure of President Trump’s approval rating. Table 1 presents the conditional forecasts from the simplified model for late October. Based on a net approval rating of -12 in the most recent Gallup Poll, the model now predicts that Joe Biden will receive 344 electoral votes to 194 for Donald Trump. The model now gives Biden an 86% chance of winning the electoral vote.
Forecast 2: State polling results
Table 2 presents a classification of states based on Biden’s or Trump’s lead in the most recent state polling average compiled by 270towin.com. States are classified as safe for Biden or Trump if the margin is 10 points or more, favoring Biden or Trump if the margin is between 5 and 10 points and leaning toward Biden or Trump if the margin is under 5 points. Table 3 then presents the overall results of this classification indicating the number of states and electoral votes in each category.
Table 2: Classification of states based on state polling data
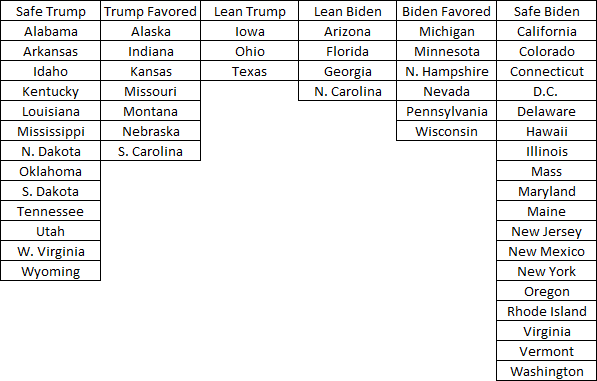
Table 3: Summary of state classifications and predicted electoral votes from state polling data
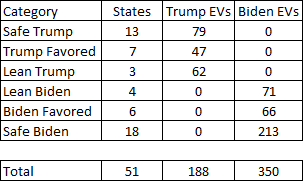
Source: 270toWin.com state polling averages accessed on Oct. 24, 2020.
Based on these state polling averages, Joe Biden is currently predicted to win 350 electoral votes to 188 for Donald Trump. It is striking that this prediction is almost identical to the one based on the conditional forecasting model originally presented in early August. It is worth noting that the prediction from the conditional forecasting model is also almost identical to the most recent forecast available from Nate Silver’s far more complex FiveThirtyEight model. The FiveThirtyEight forecast as of Monday afternoon predicts that Joe Biden will receive 342 electoral votes to 196 for Donald Trump and gives Biden an 86% chance of winning the electoral vote.
Conclusions
Two different methods of forecasting the 2020 presidential election, one based on an aggregate level model of the national electoral vote and one based on individual state polling data, yield almost identical predictions of the outcome. The aggregate level model, first published in early August, predicts a Biden margin of 345-193 in the electoral vote. A forecast based on simply combining the results of recent state polls predicts a Biden margin of 350-188. Both predictions are extremely close to the latest forecast from the much more complex FiveThirtyEight model.

Alan I. Abramowitz is the Alben W. Barkley Professor of Political Science at Emory University and a senior columnist with Sabato’s Crystal Ball. His latest book, The Great Alignment: Race, Party Transformation, and the Rise of Donald Trump, was released in 2018 by Yale University Press. |