| Dear Readers: Later today, University of Virginia Center for Politics Director Larry J. Sabato will hold a Crystal Ball webinar from 1 p.m. to 2 p.m. eastern time. He’ll be discussing the continuing fallout from the 2020 election, the 2022 midterms, and much more. You can tune in for free at https://livestream.com/tavco/sabatoscrystalballjune2021.
To submit a question for today’s webinar, tweet with the hashtag #AskSabato or email us at [email protected]. We will try to get to as many questions as possible. The webinar is part of the UVA Alumni Association’s Reunions Remixed, which is being held virtually June 9-12. See here for more information on Reunions Remixed. You do not need to sign up for Reunions Remixed to watch today’s Crystal Ball webinar. In today’s Crystal Ball, Senior Columnist Alan Abramowitz presents his model for the 2022 midterm House and Senate races, which is informed by House generic ballot polling and the number of seats each side is defending next year. — The Editors |
KEY POINTS FROM THIS ARTICLE
— National House generic ballot polling can be a useful tool in projecting the overall results of House and Senate elections.
— The president’s party often loses ground in midterms, but the magnitude of those losses varies greatly depending on the national political environment and the seats held by each party prior to the election.
— A model using the generic ballot and seat exposure shows that a single digit lead on the generic ballot would give Democrats a good chance to keep control of the Senate. Given the expected impact of redistricting, however, Democrats probably need a larger lead to keep control of the House.
Projecting 2022 through the House generic ballot
The generic ballot — a question in which survey respondents are asked which party they prefer for Congress without providing names of individual candidates — has proven to be a useful tool for explaining the national outcomes of House and Senate elections. A recent article by Seth Moskowitz in the Crystal Ball showed that polls on the generic ballot question, while not perfect, generally give a good indication of the national popular vote in recent U.S. House elections. In this article, I use generic ballot polls to construct a model for forecasting seat change in midterm elections.
The generic ballot model uses two predictors — the generic ballot along with the number of seats defended by the president’s party — to generate forecasts of seat swing in midterm elections. I use the estimates from these models to make conditional forecasts of the results of the 2022 House and Senate elections. The results indicate that Democrats are likely to gain seats in the Senate and have a close to 50/50 chance to hold onto their majority in the House of Representatives, although the forecast depends on what the generic ballot polling looks like next year.
The tendency of the president’s party to lose seats in Congress in midterm elections is one of the best-known regularities in American politics. Table 1 shows that the president’s party has lost House seats in 17 of 19 midterm elections since World War II and Senate seats in 13 of 19. The average seat loss has been almost 27 seats in the House and between three and four seats in the Senate. Beyond this general tendency, however, the magnitude of these losses has varied considerably. House results have ranged from a loss of 64 seats to a gain of eight seats while Senate results have ranged from a loss of 13 seats to a gain of four seats.
Table 1: Change in seats for president’s party in midterm elections, 1946-2018
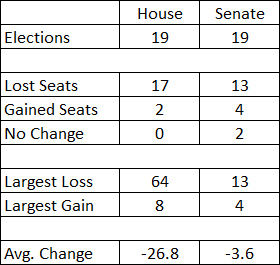
Source: Data compiled by author
Two predictors largely explain the variation in seat swing in midterm elections: the generic ballot and the number of House and Senate seats defended by the president’s party. The generic ballot provides a measure of the national political environment at the time of the midterm election while the number of seats defended by the president’s party provides a measure of exposure to risk. The larger the presidential party’s deficit on the generic ballot and the more seats it is defending, the more seats it tends to lose.
Table 2 displays the results of regression analyses of House and Senate seat change in midterm elections between 1946 and 2018. The House model is highly accurate, explaining over 80% of the variance in seat swing. The Senate model is not quite as accurate, explaining about 60% of the variance in seat swing. This is not surprising given the much smaller number of Senate seats contested in each election and the larger potential impact of local factors such as candidate quality and fundraising.
Table 2: Results of regression analyses of House and Senate seat change in midterm elections, 1946-2018
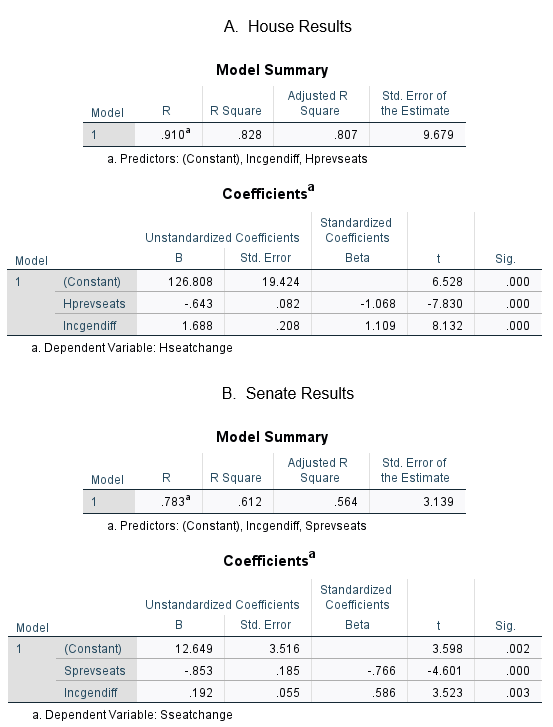
Source: Data compiled by author
The results in Table 2 show that the generic ballot and the number of seats defended by the president’s party have strong and statistically significant effects in both House and Senate elections. Based on the House results, a one-point increase or decrease in the generic ballot margin for the president’s party would be expected to produce a swing of about 1.7 seats and every additional seat defended by the president’s party would be expected to produce a net loss of more than 0.6 seats. Based on the Senate results, a one-point increase or decrease in the generic ballot margin for the president’s party would be expected to produce a swing of about 0.2 seats and every additional seat defended by the president’s party would be expected to produce a net loss of more than 0.8 seats. The size of the seat exposure effect is especially noteworthy considering that the number of Senate seats in play is only about one-twelfth of the number of House seats in play.
Figure 1 displays a scatterplot of the relationship between the forecasts generated by the generic ballot model and the actual seat swing in House and Senate elections between 1946 and 2018. The line in each graph is the regression line generated by the equations in Table 2. The closer fit of the data points to the prediction line in the House data is very clear from these figures. In the House data, the only point that appears to be conspicuously far removed from the line is the one for 2002 — the midterm election that occurred shortly after the 9/11 attacks at a time when the incumbent president, George W. Bush, remained extraordinarily popular. In the Senate data, the point for 2002 is also well above the regression line while points for several other elections including 1962 and 1978 are also well above or below the line. These results indicate that one should interpret the model’s predictions for Senate seat swing cautiously as relatively large errors are not uncommon.
Figure 1: Scatterplots of seat change by predicted seat change in House and Senate midterm elections, 1946-2018
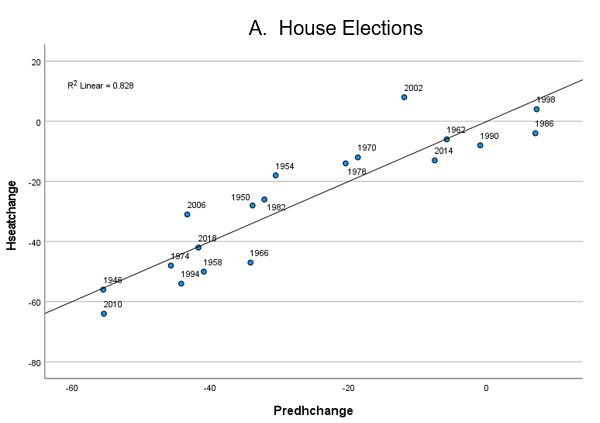
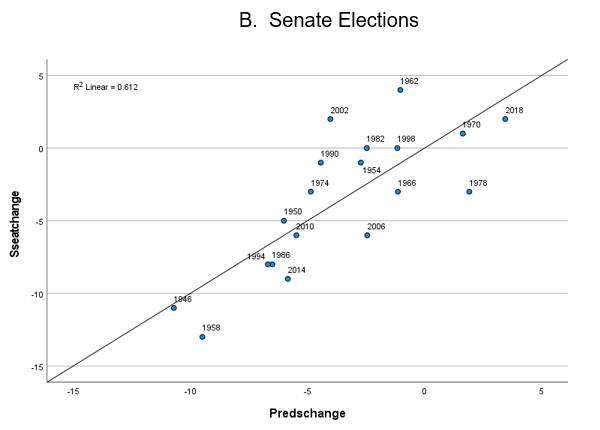
Source: Data compiled by author
Conditional forecasts for the 2022 midterms
Democrats currently hold an extraordinarily narrow 220-211 seat majority in the House of Representatives with four seats vacant — two Democratic seats and two Republican seats. The Senate, of course, is split down the middle with Democrats in the majority by virtue of holding the tie-breaking vote in the person of Vice President Kamala Harris. A net loss of only a handful of House seats and a single Senate seat next November would give Republicans control of both chambers.
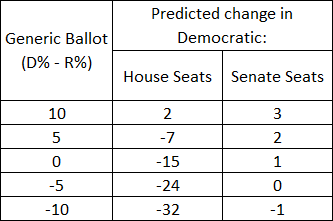
We can use the results from the regression equations in Table 2 to generate conditional forecasts of seat swing in the 2022 House and Senate elections. If one assumes that both parties hold each of their two currently vacant seats, we know that Democrats will be defending 222 of 435 House seats and 14 of 34 Senate seats next year, then the only predictor whose value is unknown is the generic ballot. Based on results from recent elections, I set the range of possible generic ballot results for next fall as +10 Democratic to -10 Democratic (or +10 Republican). Forecasts based on this range of generic ballot results are displayed in Table 3. Forecasts from outside this range can easily be generated by extrapolating from those shown in the table.
Table 3: Conditional forecasts of House and Senate seat change in 2022 midterm election
Source: Data compiled by author
Despite their extremely narrow majorities, the forecasts in Table 3 show that Democrats have a reasonable chance of keeping control of both chambers in the midterm elections if they maintain at least a narrow lead on the generic ballot. A recent Quinnipiac poll gave Democrats a nine-point lead on the generic ballot. A lead of that magnitude would predict a Republican gain of one seat in the House and a Democratic gain of two seats in the Senate giving Democrats a 221-214 seat majority in the House and a 52-48 seat majority in the Senate. Given the standard error of about 10 seats for the House forecast and three seats for the Senate model, however, the safest conclusion would be that the balance of power in both chambers would probably be very close. A smaller Democratic lead in the generic ballot, or a Republican lead, would predict a Republican edge in the House, and possibly also in the Senate.
One additional factor that is not included in the House forecast is the impact of redistricting, which will take place this cycle based on the results of the 2020 census. Republicans are widely expected to gain at least a few additional House seats in 2022 by virtue of controlling states with far more House districts during the redistricting process. A similar situation occurred in the 2012 election, in which Republicans managed to hold onto their majority despite losing the national popular vote for the House. If we assume that redistricting will be worth an additional 10 House seats to the GOP, Democrats would likely need a lead of at least 10 points on the generic ballot in order to maintain control of the lower chamber.
Redistricting has no bearing on Senate elections, and the 2022 Senate map appears favorable for Democrats. Republicans currently hold 20 of the 34 seats at stake in 2022. Because of the large impact of seat exposure in Senate elections, even a small advantage on the generic ballot would give Democrats a good chance to keep control of the upper chamber. However, our forecast does not take into account the specific seats that are on the ballot in 2022, only the numbers of Democratic and Republican seats. In addition, as mentioned earlier, the margin of error for the Senate model is relatively large, leaving room for a range of possible outcomes from a GOP gain of two-to-three seats to a Democratic gain of four-to-five seats. As with the House, the margin of control in the next Senate is likely to be very narrow.
 Alan I. Abramowitz is the Alben W. Barkley Professor of Political Science at Emory University and a senior columnist with Sabato’s Crystal Ball. His latest book, The Great Alignment: Race, Party Transformation, and the Rise of Donald Trump, was released in 2018 by Yale University Press. Alan I. Abramowitz is the Alben W. Barkley Professor of Political Science at Emory University and a senior columnist with Sabato’s Crystal Ball. His latest book, The Great Alignment: Race, Party Transformation, and the Rise of Donald Trump, was released in 2018 by Yale University Press. |