KEY POINTS FROM THIS ARTICLE
— Although off-year elections for governor generally yield worse results for the party of the president than for the opposition, whether the incumbent governor is running for reelection is a mediating factor.
— The worst outcomes for the party of the president often come when that party has to defend an open seat, and the best for the non-presidential party occurs when the sitting governor is making a bid for another term.
— Open seats can be challenging to defend even for the non-presidential party.
What history tells us about this year’s gubernatorial landscape
Speculation is running rampant regarding whether Democrats or Republicans will win control of Congress this November. A different question attracts less attention: How many governorships will change parties? History offers an answer.
Results from 531 elections from 49 states[1] drawn from a series starting no earlier than the 1930s in which at least 2 changes of party control took place, one at the beginning and one at the end of a party’s spell in office, show a pattern displayed in Figure 1.[2]
It shows that in elections held in off-years, the president’s party has only a 25% chance of defending an open-seat governorship: In such elections, the presidential party candidate on average receives 45% of the vote, its share having shrunk by 12 percentage points from its previous showing. If the incumbent governor is running, however, the presidential party has about a two-thirds chance of retaining the office, but by a razor-thin margin, its share of the vote having gone down by an average of 3 percentage points from the last election.
Figure 1: Gubernatorial midterm wins history by incumbency, presidential party status
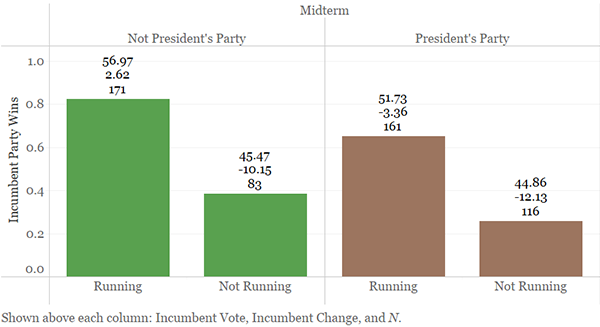
By contrast, the best performance in Figure 1 is that of the party out of the White House when its governor heads the ticket. Under these conditions, the non-presidential party gubernatorial incumbent is reelected 80% of the time, with an average 57% of the vote, an uptick of 3 percentage points from the previous election. However, if the governor is not running, that party’s chances for reelection are only 40%, its vote down 10 percentage points since the last election, placing it as the second worst in the chart.
These patterns suggest two things: even in an off-year election, the fate of the president’s gubernatorial co-partisans is not that bad, provided the sitting governor is running. On the other hand, for the non-presidential party, the off-year election is hardly a guarantee of holding a governorship: again, it depends on whether the incumbent governor is seeking another term.
Having summarized the historical pattern, next I survey this year’s gubernatorial landscape. This is shown in Table 1. This year, 36 states hold gubernatorial elections, 16 controlled by Democrats, shown first, and 20 by Republicans. The table shows the names of the incumbent governors by state, whether they are running for reelection, and the share of the vote the winning party received in the previous election (back in 2018). Based on the average votes shown in Figure 1, I identified states where the incumbent party is in trouble, according to criteria spelled out below. Note, though, that the dependent variable in the analysis is the incumbent party’s (not the individual governor’s) control of the office.
Table 1: 2022 gubernatorial election landscape based on historical trends
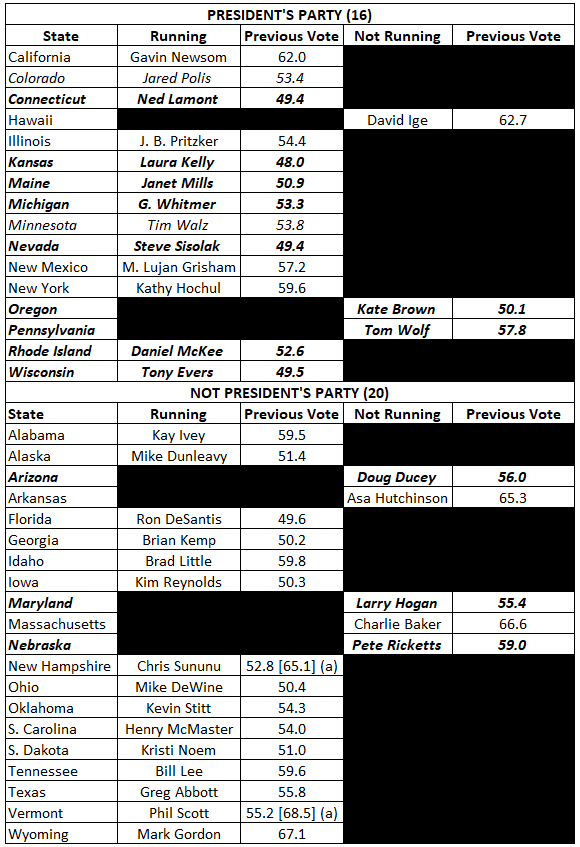
Notes: Italicized rows indicate vulnerable seats; bold, italicized rows indicate endangered seats. See text for the rationale. (a) New Hampshire and Vermont are the only states with a 2-year term for governor as opposed to a 4-year term. I have entered first the 2018 value and, in brackets, the 2020 figure for completeness.
Source: Wikipedia, double-checked by Dave Leip’s Atlas of U.S. Presidential Elections
Assuming that the incumbent party’s candidate needs at least 50% +1 of the vote to hold the state, and taking into consideration whether the person presently occupying the office is seeking another term — regardless of whether he or she assumed it by election or by some other cause, such as resignation of the previous occupant — the following conditions apply. If the party’s previous vote is large enough to absorb the average loss shown in Figure 1 and still come up with at least 50% +1 of the vote, its control is safe. It is vulnerable if the margin of safety is lower than 1 percentage point, and downright endangered if there is no cushion at all.
Based on these criteria, and comparing the particular state’s incumbent party’s vote in the last election shown in Table 1 with the historic averages of loss (or gain) shown in Figure 1, I rate 5 Democratic party controls as safe, 2 as vulnerable, and the rest, 9 in all, as endangered. As for the Republicans, 3 qualify as endangered while all the rest, 17 in all, are safe. Assuming, further, that 75% of the endangered and 50% of the vulnerable are likely to lose, we can expect Democrats to lose 8 governorships and Republicans, 2. If one goes not by the average vote losses under opposite conditions of incumbency but simply by their respective historic probabilities of reelection, shown in Figure 1, I obtain 7 Democratic losses and 6 Republican. This second method pays no attention to individual cases, only to the general historical pattern of reelection and defeat. Note that both methods yield very similar estimates for Democratic losses, 8 and 7, respectively, while those for the Republicans are far apart, the latter method yielding 3 times as many losses as the former, 6 vs. 2. Averaging the 2 estimates for each party, the historically based combined expectation is that the GOP will lose 4 governorships and the Democrats, 8, respectively 20% and 50% of their present holdings, or a net gain of 4 states for the Republicans.
Bear in mind that I have made some simplifying assumptions. In particular, that reelection requires 50% +1 of the vote. This, of course, is not a legal requirement, only that in most gubernatorial elections the winner has done so by at least this margin, and usually by a larger one. Neither have I taken into account factors requiring more state- and contest-specific knowledge. My expectations are based strictly on the historical record.
The usefulness of this exercise lies not in forecasting specific races this far ahead of the election as in setting a benchmark for evaluation of the Democrats’ performance in November. Although governors of the same party as the president are somewhat less exposed to the midterm backlash than their co-partisans in Congress, they are not totally immune to it. Thus, if considerably more or less than the expected number of Democratic governors go down to defeat, it will shed light on the party’s, and the Biden administration’s, present standing with the voters in the states. And it is in the states, we hardly need reminding, that U.S. presidential elections are decided.
Footnotes
[1] The lone exception is the state of Georgia, which having switched control from Democrats to Republicans in 2002, has yet to flip the other way.
[2] For a more detailed description of the data, see Richard J. Heggen and Alfred G. Cuzán, “The Cost of Ruling: An Exploration in U.S. Gubernatorial Elections.” Paper presented at the 2022 “State Politics and Policy Conference,” Tallahassee, FL, April 21-23. Available at https://doi.org/10.33774/apsa-2022-1j9ll.
| Alfred G. Cuzán is a distinguished professor of politology in the Department of Government of the University of West Florida, and author of Laws of Politics. Their Operations in Democracies and Dictatorships (Routledge, 2022). Many thanks to Grace Wheeler, Graduate Assistant in the Department of Government, for her assistance in gathering or proofing some of the data used in this article. |