| Dear Readers: Join us tonight from 6-7 p.m. eastern for a conversation with Matthew Barzun, the former U.S. ambassador to the United Kingdom as well as Sweden. Barzun will be discussing his experiences representing the United States abroad, his work as the national finance chair for Barack Obama’s presidential campaign, and his new book, The Power of Giving Away Power: How the Best Leaders Learn to Let Go.
Andria McClellan, a member of the University of Virginia Center for Politics’ advisory board and a member of the Norfolk City Council, will interview Barzun following introductory remarks from Center for Politics Director Larry J. Sabato. To watch tonight, just click the following link: https://livestream.com/tavco/powerofgivingawaypower Below, Crystal Ball contributor Lakshya Jain looks at how the makeup of the electorate changes from presidential years to midterms, a shift that offers both opportunities and liabilities for Democrats. — The Editors |
KEY POINTS FROM THIS ARTICLE
— Midterm electorates are typically whiter and more educated than presidential electorates.
— At one time, this sort of change from the presidential to the midterm electorate might have made midterm electorates worse for Democrats. But given changes in the electorate, this midterm turnout pattern may actually aid Democrats, or at least not hurt them as much as it once did.
— Minority turnout has fluctuated and is a wild card that plays a big role in determining baseline partisan leans and advantages — presidential-level turnout means Democrats enjoy the advantage, whereas dips favor Republicans.
— The outcome in key swing states whiter than the national average, such as Pennsylvania, Wisconsin, and New Hampshire, may be influenced heavily by educational turnout differential. In states with large nonwhite cores, such as North Carolina, Georgia, Arizona, and Nevada, minority turnout will play a more critical role.
Presidential vs. midterm turnouts
Although an election cycle occurs every two years in American politics, the electorate differs according to the type of cycle. In presidential years, where turnout is generally higher across the board, the electorate typically has more minority voters and more lower-propensity white voters who often do not have a four-year college degree. Meanwhile, in midterm years, the electorate generally has a higher share of voters with a four-year degree and is at least a touch whiter, with college-educated whites making up a greater share of the electorate. In this article, we take a closer look at the ways in which midterm electorates differ from presidential electorates and the implications this could have for 2022.
As a starting point, let’s look at how Catalist, a major Democratic data firm that produces widely-respected estimates of the electorate, calculated the demographics of the past five national electorates (2012-2020).
Table 1: Catalist estimates of electorate composition, 2012-2020
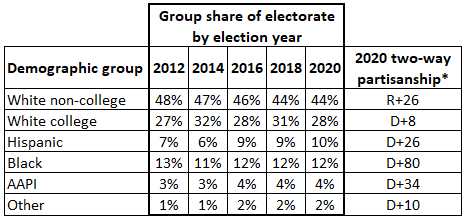
Note: *This shows the two-party presidential result in 2020 for each group, as calculated by Catalist.
Source: Catalist
To better understand what each electorate’s partisan lean would be under current demographic support rates, we perform a simple reprojection, where we calculate what the electorate lean for each year would be under 2020 presidential support rates by demographic. This helps us better understand the range of plausible baseline partisan leans among coalitions given modern-day support rates. In the “actual electorate lean” column on the right in Table 2, we used the presidential results in presidential years (2012, 2016, and 2020). We used the national House popular vote for the two midterms (2014 and 2018).
Table 2: Estimating recent elections using 2020 partisanship
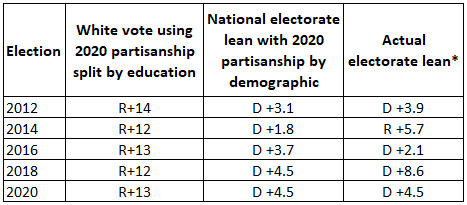
Note: *National popular vote for president used in 2012, 2016, and 2020; national House popular vote used for 2014 and 2018.
We find in Table 1 that midterm electorates are consistently more educated, with white, college-educated voters seeing the biggest spike in their electorate share in both 2014 and 2018 — per Catalist, they comprised 32% of the electorate in 2014, which was a 5% spike from their 2012 levels, and 31% in 2018, which was a 3% spike up from the 28% share they held in 2016. As white college voters now consistently vote significantly more Democratic than non-college whites, current partisanship levels indicate that this midterm turnout dynamic ends up now giving Democrats a boost of roughly 2 points in two-way margin among white voters when compared to the presidential electorates. Of course, Republicans can make up for this by performing better with college-educated whites, but they have been struggling with this group in recent years compared to their previous showings, and improvement on this front will likely be important for a good Republican midterm.
Interestingly, note that the national electorate lean with 2020 partisanship applied to the 2014 electorate would have been D +1.8 as compared to the actual R+5.7; that is to say, Democrats suffered a penalty of about 7.5 additional points caused in large part by college-educated voters voting at an R+14 rate, per Catalist. This 22-point difference in the college-educated vote margin between 2014 (R+14) and 2020 (D+8) would, in itself, cause a roughly 7-point Republican swing in the electorate’s two-way partisan lean.
However, the overall picture of who is favored in midterm electorates is greatly complicated by the picture of minority turnout, given the strongly Democratic lean among nonwhite voters. These voting blocs generally turn out at higher levels in presidential years, but in 2018, the nonwhite share of the electorate was close to 2016 levels. This meant that the primary difference in electorates between 2016 and 2018 came down to the surplus of educated white voters in 2018, which made the midterm electorate more Democratic on a turnout basis. In fact, applying 2020 support rates to the 2016 and 2018 electorates, we find that the national 2018 electorate was more Democratic-leaning than 2016 on presidential support rates by roughly 1 point on margin.
The converse of 2018 occurred in 2014 with nonwhite voters — while the electorate became more educated, resulting in Democrats gaining a 2-point boost on margin among white voters, it was Republicans who gained among the overall electorate based on turnout alone — applying 2020 support rates to 2014 and 2012, we see that the midterm electorate was a point more Republican than the presidential one. This is caused almost entirely by a sharp drop in minority turnout, as the 2014 electorate was 4 percentage points whiter than the 2012 one, and this entirely wiped out any boost Democrats would have gained by educational turnout differential under current coalitions. This drop was most pronounced among Black voters, who are consistently the strongest demographic for Democrats by support rate — they went from 13% of the electorate in 2012 to 11% in 2014.
It is worth noting, at this point, how strongly Black turnout correlates with Democratic performance. In 2014, the Black share of the electorate falling 2% wiped out just about any gain Democrats received from educational turnout differential, especially given how strongly Black voters vote Democratic. One way to think of this is in terms of expected value per vote — if Black voters are a D+80 bloc and white college voters are a D+8 bloc, then Democrats would need to turn out 10 white college voters to net the same amount of expected votes as they would get from a single Black voter. The electorate lean for 2022, therefore, may rely heavily on the percentage of the electorate that is comprised of Black voters.
Swing state implications
Up until this point, we have discussed electorate composition on a national level to glean demographic trends for turnout. However, given the 2022 Senate map and the difference in demographic composition among key swing states, it is worth examining a few of these states in more detail to better understand how the aforementioned turnout dynamics and trends may impact the results of the Senate races in key battleground states.
Figure 1: Demographics of key 2022 Senate states
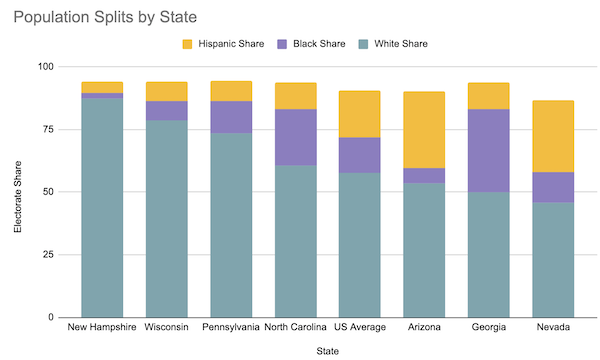
Source: U.S. Census Bureau
Above, we show the demographic splits for several key swing states with contested Senate elections in 2022, sorted from left to right in order of the white population share per state, with the U.S. national average provided for comparison’s sake. These are the seven races that the Crystal Ball rates as either Toss-ups or just leaning one way or the other: Republicans are defending North Carolina, Pennsylvania, and Wisconsin, while Democrats are defending Arizona, Georgia, Nevada, and New Hampshire.
In states with lower minority populations, it is likely that the previously-noted Democratic educational advantage among whites is magnified, and that the degree of influence minority turnout has upon the electorate is relatively blunted. This may be the case in New Hampshire, Pennsylvania, and Wisconsin, all of which are significantly whiter than the nation as a whole. Extrapolating from past electorates, Democrats may begin with an electorate that is anywhere between 1-3 points more favorable than 2020 in terms of presidential lean in these states. For instance, New Hampshire, which was Biden +7.2 in 2020, could see a Biden +9 electorate, given that state’s exceptionally large share of white voters.
In contrast, Arizona, Nevada, North Carolina, and Georgia all have significant blocs of nonwhite voters, and it is here that the outcome of the Senate races may rely more heavily than usual on the turnout of minority groups. Arizona and Nevada, in particular, have heavy concentrations of Hispanic voters, while Georgia and North Carolina have high Black populations. If Democrats replicate their 2018 minority turnout operations in these states, they would go a long way towards avoiding another 2014-esque red wave; however, if those turnout efforts fall short, these states would become prime pickup material for Republicans.
Conclusion
From the analysis, we can see that midterm electorates, in general, have higher levels of four-year college attainment than the presidential electorates, which might actually help Democrats given their recent improvements with these voters. However, the volatility of minority turnout in non-presidential elections makes the overall midterm turnout advantage unclear. If nonwhite turnout stays at presidential levels, it is likely that Democrats begin with an electorate whose baseline presidential lean is more Biden-voting (in terms of 2020 presidential vote cast) than in the 2020 electorate itself, whereas if it dips in the way it did in 2014, Republicans would be advantaged on the whole.
Determining which of the pictures is more likely between 2014 and 2018 is a tall order, especially given the amount of time to go until the 2022 environment. However, whatever happens, it is clear that the midterm and presidential electorates are likely to vary significantly in composition — it is just the areas in which the change is greatest that will play a large role in deciding the electorate’s baseline lean in 2022.
| Lakshya Jain is a software engineer who recently graduated from UC Berkeley with a Masters’ in Computer Science, with a focus on machine learning, and he now teaches a databases course there as a lecturer. His data-centric background and political interest led him to analyze elections in his spare time. More of his analyses can be found on Twitter @LXEagle17. |