| Dear Readers: Join us on Tuesday, April 11 for a conversation with Nguyen Quoc Dzung, ambassador of Vietnam to the United States. The ambassador will speak on the relationship between Vietnam and the U.S. and issues impacting Vietnam and Southeast Asia.
The program begins at 6:30 p.m. eastern at Minor Hall, Room 125, on the Grounds of the University of Virginia. It is free and open to the public to attend with advanced registration through Eventbrite; it will also be livestreamed at https://livestream.com/tavco/ambassadorofvietnam. — The Editors |
KEY POINTS FROM THIS ARTICLE
— After looking at the Midwest last week, we’re comparing the presidential voting trajectory of the bigger counties versus the rest of the state in a number of eastern states.
— Georgia had exactly opposite top and bottom halves in 2020, with a very Republican (but stable) bottom half and Democratic-trending top half driven by changes in Atlanta.
— North Carolina and Pennsylvania are mirror images on opposite sides of the political divide.
— Florida’s turn toward the Republicans has been a bit more pronounced in its top half of bigger counties compared to its bottom half, making it an outlier among the states we’ve studied.
— South Carolina’s status as a red state is much more about its top half than its bottom half.
All aboard the Night Train
James Brown’s version of the song “Night Train” — one of the best songs ever recorded, in my humble opinion — calls out the path of a train starting from Miami and moving up the eastern seaboard. Among other places, the train stops in Atlanta, Raleigh, Richmond, and Philadelphia.
What does this have to do with presidential politics? Well… nothing really. It’s just that I heard the song over the weekend as I was trying to tie together the collection of eastern states I’m analyzing this week. This is a follow-up to last week’s exploration of how the biggest counties in a state vote for president compared to the rest of the state. So, I thought, the Night Train’s path kind of does the trick. Plus, if this apparent non sequitur inspires you to listen to the song, well, trust me, your day will be better off for it.
After analyzing 7 Midwestern states last week, we turn east this week, looking at a series of states extending from Pennsylvania in the north to Florida in the South. They are geographically connected, except that we skipped Maryland on account of it being so overwhelmingly Democratic.
These are a politically diverse group of states, including red South Carolina, bluish Virginia, reddening Florida, and 3 of the nation’s premier battlegrounds: Georgia, North Carolina, and Pennsylvania.
Just like last week, we split each state in half, grouping together the biggest-voting counties that added up to roughly half the statewide vote in the 2020 presidential election (the top half) and comparing them to the other counties that make up the rest of the state (the bottom half). We used Dave Leip’s Atlas of Presidential Elections for the results, and Dave’s Redistricting App to highlight the top half counties in orange on the maps that follow. For a more detailed explanation of methodology, see last week’s piece.
All aboard?
FLORIDA
Map 1: Florida top half counties
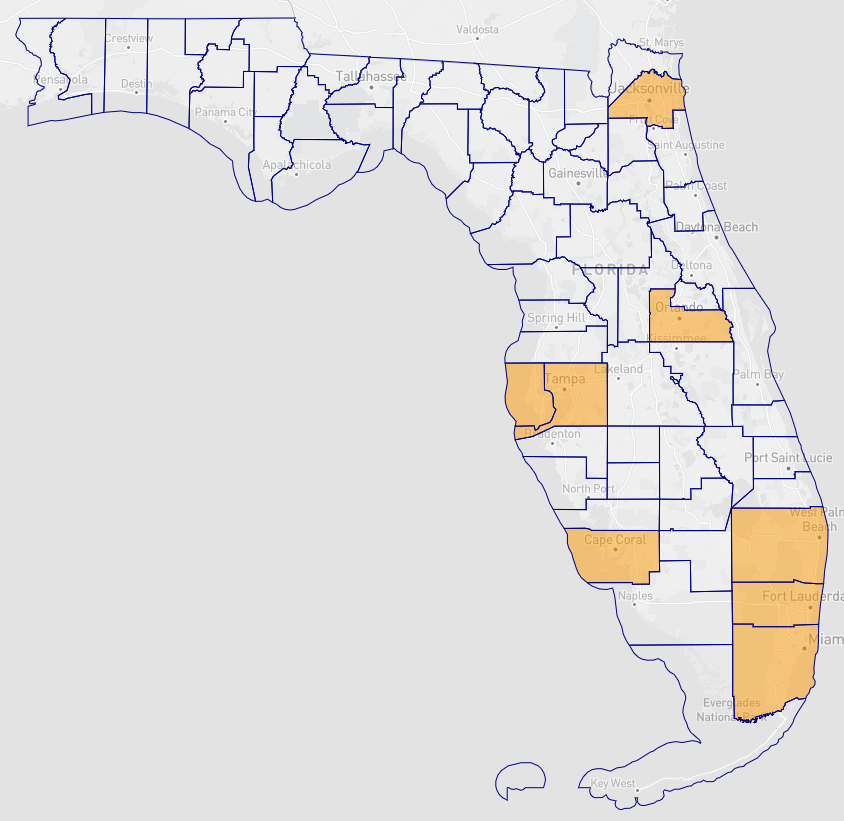
Table 1: Florida presidential voting, 2020 vs. 2012

Top half counties that add up to half the statewide vote: Miami-Dade, Broward, and Palm Beach in South Florida cast about a quarter of the statewide vote. Others in this group are Hillsborough and Pinellas, which make up the core of the Tampa/St. Petersburg/Clearwater area; Duval (Jacksonville) in the northeast; Orange (Orlando) in central Florida; and Lee (Fort Myers/Cape Coral in the southwest). Joe Biden won all of these but Lee; Barack Obama won 6 of the 8, losing Duval and Lee.
Bottom half counties that make up the other half of the statewide vote: The state’s other 59 counties; Obama lost all but 7, Biden lost all but 5.
Of the 13 Midwestern/eastern states we’ve looked at as part of this analysis, Florida has an unusual distinction: It is the only 1 of the 13 where the Democrats’ margin in the top half dropped more than their margin in the bottom half from 2012 to 2020. As you can see in Table 1, the drop was similar — 4.4 points in margin in the top half and 3.9 in the bottom half — which makes it an outlier, too, as generally (not always) the bottom halves of these states have gotten substantially more Republican as the top halves have seen only a modest Democratic decline or, sometimes, a small or even large pro-Democratic shift.
A big reason for a Republican shift in the big counties is that the 3 big South Florida counties were considerably less blue in 2020 than they were in 2012: Obama won the trio by 26 points, while Biden won them by 16 points. Miami-Dade has driven that shift, going from a 24-point Obama margin (and 29 for Hillary Clinton in 2016) to just 7 for Biden in 2020, but the other 2 got less blue as well, albeit not as dramatically.
Overall, Florida has a bottom half that is comparable to some states in the Midwest, perhaps in part because Florida’s booming retirement communities (many of which have big populations but are included in the bottom half) have many Midwestern expats (we looked at some of these counties last year). Trump won Florida’s bottom half of counties by 18 points, very similar to Wisconsin (15 points) and Minnesota (17 points). But the top half of Florida only voted for Biden by 11 points, comparable to the top half of Iowa (12 points), a state that like Florida has shifted right recently. Florida is definitely more competitive than the double-digit victories by Gov. Ron DeSantis (R) and Sen. Marco Rubio (R) last year, but it’s also clearly trending toward Republicans.
GEORGIA
Map 2: Georgia top half counties
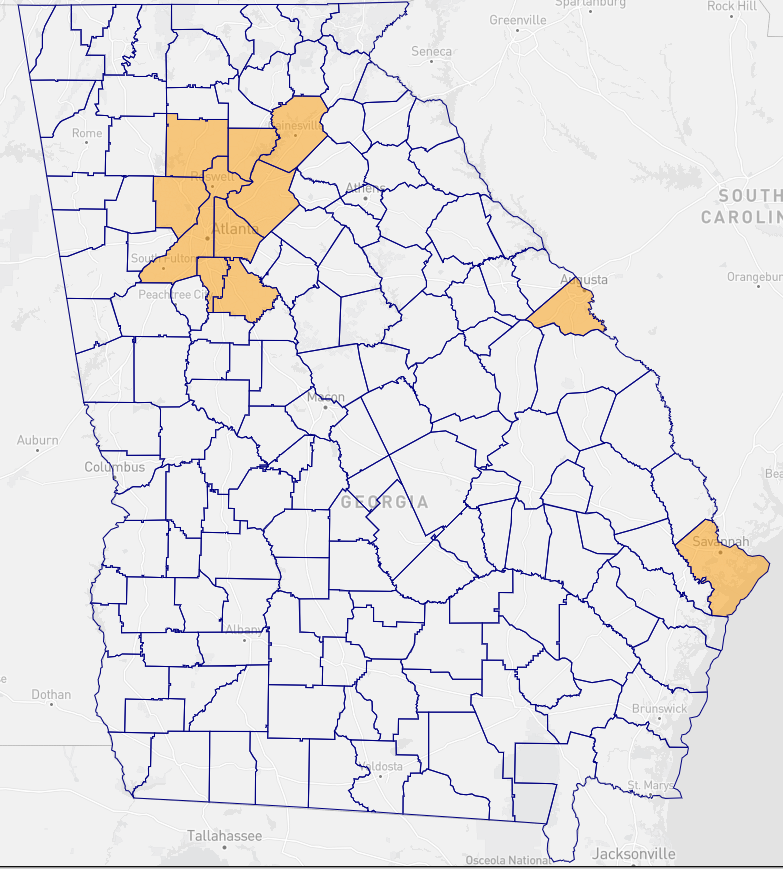
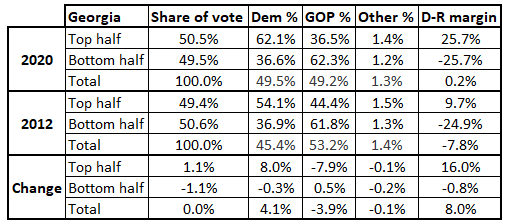
Table 2: Georgia presidential voting, 2020 vs. 2012
Top half: 11 counties, with 9 of those being part of the Greater Atlanta area (Fulton, Gwinnett, Cobb, DeKalb, Cherokee, Forsyth, Henry, Clayton, and Hall, in order of most to least populous). The other 2 counties outside of Atlanta’s orbit are Chatham (Savannah) in the southeast and Richmond (Augusta) in the east. Biden won 8 of these 11, with the exceptions being Atlanta exurbs Cherokee, Forsyth, and Hall. Obama won just 5 of the 11: Clayton, DeKalb, and Fulton in the Atlanta area in addition to Chatham and Richmond.
Bottom half: Georgia has a lot of counties, and 148 of the 159 make up the bottom half. Obama won 29 of these counties, while Biden won 22. Like many other Southern states, Georgia has a lot of rural and heavily Black Democratic counties, which helps account for Democrats’ ability to win these counties, although as their dwindling number suggests, many of these counties have still drifted towards Republicans.
The change in Georgia has been essentially entirely driven by its top half counties, which is dominated by counties in the Atlanta orbit. The Democratic presidential margin in Georgia’s top half has swelled from 10 points in 2012 to 26 points in 2020. Meanwhile, the bottom half has hardly changed at all, moving from a 25-point Republican margin to a 26-point margin. In Georgia, Republicans were effectively already maxed out with rural white voters prior to Trump, and there also are a substantial number of votes in the bottom half from majority Black rural counties and a few larger Democratic-leaning counties to keep Democrats from getting completely blown out in that group (the bottom halves of Iowa and Ohio, for instance, are redder now than the bottom half of Georgia). The bottom and the top halves gave their respective candidates 25.7-point margins — exactly the same, down to a tenth of a point. Biden won because the top half counties cast slightly more of the vote, based on this calculation (50.5% vs. 49.5% for the bottom half).
The bottom line is if Republicans can’t stop the bleeding in the Greater Atlanta area, Georgia eventually could go the way of Virginia and become bluer than the nation as opposed to redder (which it still is).
NORTH CAROLINA
Map 3: North Carolina top half counties
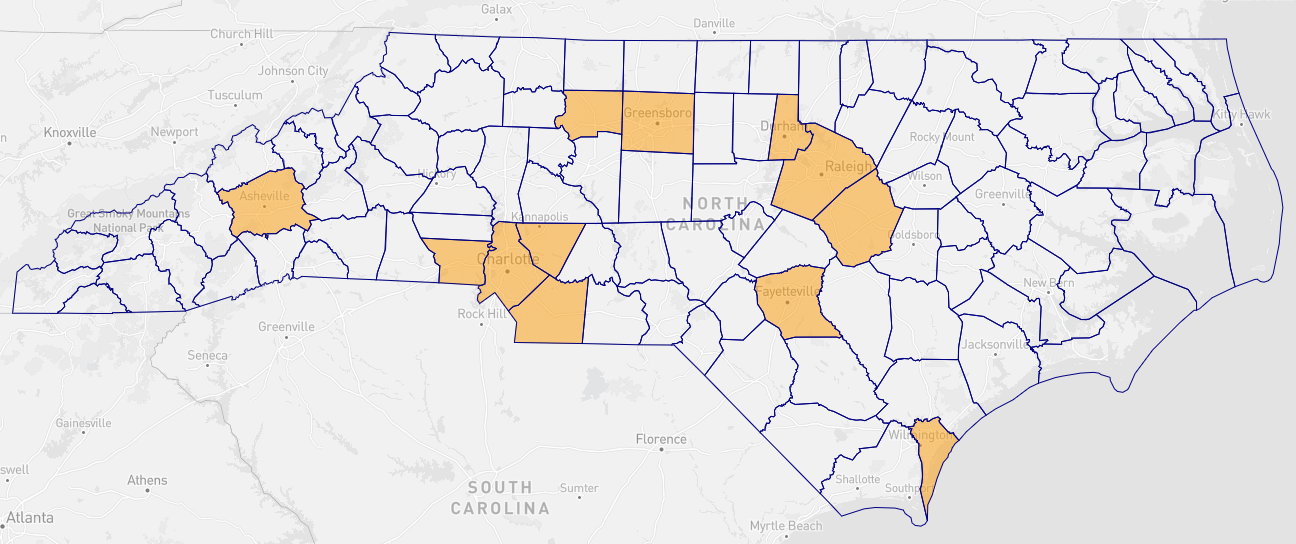
Table 3: North Carolina presidential voting, 2020 vs. 2012
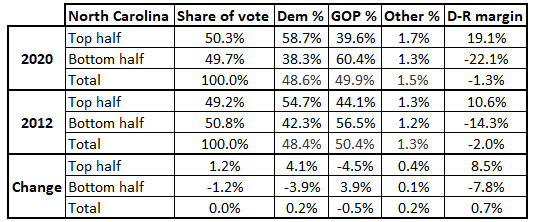
Top half: The dozen counties that make up North Carolina’s top half are generally centered around Raleigh-Durham, Charlotte, and the Piedmont Triad (Greensboro/High Point/Winston-Salem). The biggest source of votes is Wake (Raleigh), and neighboring Durham and Johnston counties are also in this group. Mecklenburg (Charlotte), the second-largest source of votes, is also included, along with neighboring Union, Cabarrus, and Gaston. Guilford (Greensboro) and Forsyth (Winston-Salem) cast the third and fourth-most votes, respectively, and are located west of the Raleigh-Durham metro area. Finally, Buncombe (Asheville), Cumberland (Fayetteville), and New Hanover (Wilmington) provide other vote anchors in, respectively, the western, south-central, and southeastern parts of the state. Biden won 8 of these 12 counties, losing only the suburban/exurban Johnston south of Raleigh as well as the suburban/exurban satellites of Mecklenburg: Cabarrus, Gaston, and Union. Obama won 7 of the 12, with the same lineup as Biden except Obama narrowly lost New Hanover while Biden won it.
Bottom half: The other 88 counties: Obama won 23, Biden won 17.
The Tar Heel State is in a period of considerable flux, with the gap between its top and bottom halves expanding. But for all of the positive Democratic trends in the top half, the bottom half has gotten considerably more Republican over the same time period, too, keeping the state persistently right of center.
At the topline level, North Carolina voted very similarly in 2012 and 2020, producing a 2-point margin for Mitt Romney and then a 1.3-point margin for Donald Trump. In each election, the state was the Republican nominee’s closest victory. Yet like other states, that statewide similarity masks a lot of changes happening at the sub-state level, with Democrats getting bigger margins in the major urban areas but losing ground elsewhere. Biden was the first postwar Democratic nominee to clear 60% of the vote in both Mecklenburg and Wake counties and still came up short, speaking to how much the rest of the state has moved. Two key places of Democratic slippage have come in the northeast, home to several heavily Black rural counties where Democratic performance is not as strong as it once was, as well as a mix of counties near the South Carolina border between Charlotte and Fayetteville. Robeson County, home of the Lumbee Indian tribe, is a prime example, as it went from 58%-41% Obama to 59%-41% Trump in just 8 years.
Two key differences between Georgia and North Carolina are 1. North Carolina is not dominated by a single metro area and 2. Democrats had further to fall in the state’s bottom half in North Carolina but did not in Georgia, at least at the moment. (My colleague J. Miles Coleman took a deeper look at North Carolina trends for the Crystal Ball recently.) Demographically, it is also worth noting that about one-third of Georgia’s residents are Black while less than one-quarter of North Carolina’s are, which is likely another larger-scale factor keeping the latter in the red column.
PENNSYLVANIA
Map 4: Pennsylvania top half counties

Table 4: Pennsylvania presidential voting, 2020 vs. 2012
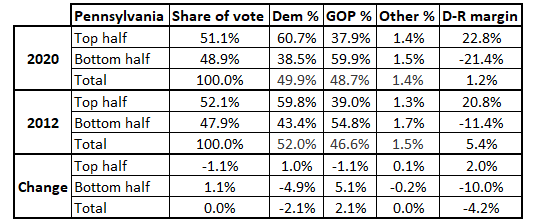
Top half: The 8 counties in this group are all in southeast/south-central Pennsylvania with the exception of Allegheny (Pittsburgh), which narrowly trails Philadelphia County as a source of votes in presidential elections despite only having a population roughly 80% the size of Philadelphia. Philadelphia’s core suburban counties — Montgomery, Bucks, Delaware, and Chester — along with growing Lancaster and York to Philadelphia’s west round out the list. Obama won 5 of the 8, losing Chester, Lancaster, and York. Biden won 6 of the 8, adding Chester.
Bottom half: The other 59 counties: Obama won 8, Biden won 7. They both won the same total number of counties statewide (13), with the only difference between the two being that Obama lost Chester in the Philadelphia suburbs while carrying Luzerne (Wilkes-Barre) in the northeast — Biden won the former and lost the latter, which is adjacent to his childhood home in Lackawanna (Scranton).
Pennsylvania’s top and bottom halves are now very similar to North Carolina’s, as they are close to being mirror opposites of one another. Like many of the states in the Midwest, Republicans have gotten much stronger in Pennsylvania’s bottom half counties in the Trump era, although the Pennsylvania top half has gotten a little bluer.
The Keystone State is often lumped in with the 2 other so-called “Blue Wall” states of Michigan and Wisconsin, which together have all voted Democratic in every presidential election since 1992, with the exception of 2016. Compared to those states, Pennsylvania’s top half is bluer — but its bottom half is redder. It does bring to mind the old adage attributed to Democratic strategist James Carville that the state is Pittsburgh and Philadelphia with Alabama in between (although that’s apparently not exactly what he said, as Politico noted many years ago).
That said, Biden did run better than Hillary Clinton in much of the state (including almost all of its eastern half, with Philadelphia itself being one of just a few exceptions). This helps explain how he flipped the state back after she narrowly lost it. But Democrats are in trouble in Pennsylvania if the native Pennsylvanian’s candidacy was only effectively a rearguard action against more significant Democratic erosion in the smaller counties. Democrats performed quite well in Pennsylvania in the 2022 midterm — but they also did in 2018, and that didn’t prevent the 2020 election from being a nail-biter.
SOUTH CAROLINA
Map 5: South Carolina top half counties

Table 5: South Carolina presidential voting, 2020 vs. 2012
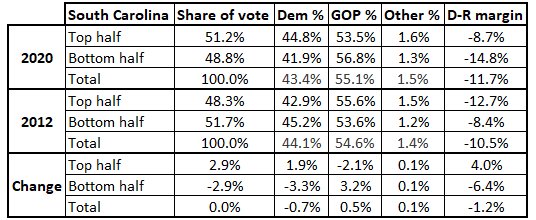
Top half: The largest source of votes in the Palmetto State is not Charleston County (which is second), but rather Greenville in the northwestern part of the state. Its eastern neighbor, Spartanburg, is fifth. The others in this group are Richland (Columbia) and its western suburban neighbor Lexington in the center of the state, Horry (Myrtle Beach) on the state’s northern coast, and York, which is just south of Charlotte on the other side of the North Carolina border. Obama and Biden each carried just 2 of the 7: Charleston and Richland.
Bottom half: The other 39 counties; Obama carried 19 while Biden carried 11. Some of the state’s smaller, rural counties are majority Black (as is the case in other Southern states) and heavily Democratic. Still, Republicans generally dominate the most vote-rich counties in the bottom half.
South Carolina is the least competitive state among these 6, but we included it basically just to show why it is staunchly Republican even as its 2 neighbors along the coast — North Carolina to the north and Georgia to the southwest — are 2 of the nation’s premier battlegrounds.
South Carolina’s big counties, collectively, are not blue, nor are they really even purple. While the state’s top half got a little less red from 2012 to 2020, Trump still won the group by 9 points. Of the 13 states we’ve looked at as part of this series, it’s the only state so far where Trump won the top half. Interestingly, South Carolina’s bottom half was actually less red than its top half in 2012, which likely is explained by the voting habits of several smaller, heavily Black rural counties predominantly located between Columbia and Charleston in the southeastern half of the state. But by 2020, the familiar pattern of the top half being more Democratic than the bottom half had been established in South Carolina.
In order for the state to get competitive, one would need to see a real Democratic trend in the top half, including big swings to the left in historically conservative and strongly Republican places like Greenville and Spartanburg in upstate South Carolina. Greenville actually did get less Republican from 2012 to 2018, but it went from a 28-point Romney margin to an 18-point Trump margin (and Spartanburg actually got a few points redder over the same timeframe). Something much more dramatic than that is needed to make South Carolina an actual swing state, and South Carolina was actually a little closer for president in 2012 than it was in 2020.
VIRGINIA
Map 6: Virginia top half counties
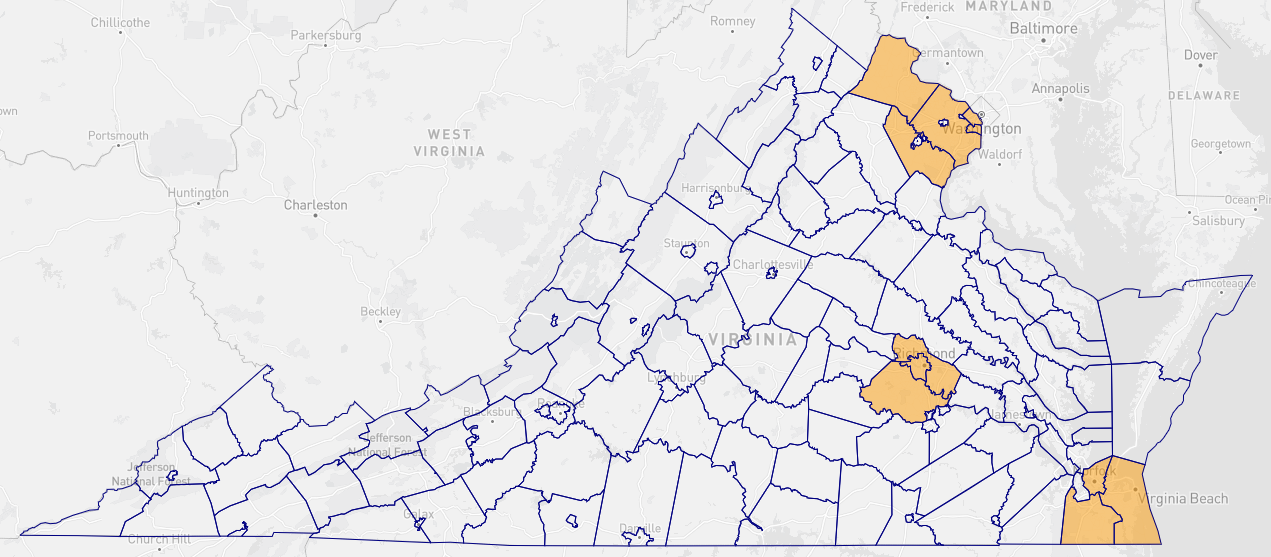
Table 6: Virginia presidential voting, 2020 vs. 2012
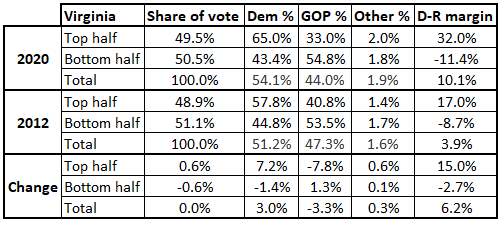
Top half: All 11 of the localities included here are based in Northern Virginia, Greater Richmond, or Hampton Roads — the 3 components of the state’s heavily-populated “Urban Crescent.” We say “localities” because Virginia has both counties as well as independent cities. Fairfax County is by far the biggest voting locality in the state, casting more than double the votes of anywhere else, although it only casts about 13% of the total statewide vote. Prince William, Loudoun, and Arlington counties as well as Alexandria City join it as Northern Virginia components of the top half. The 3 core Richmond localities — the city itself plus neighboring suburban Chesterfield to its south and Henrico to its north — as well as the biggest Hampton Roads localities, the independent cities of Virginia Beach, Chesapeake, and Norfolk, round out this group. Biden won all 11 of these counties/cities; Obama won all but Chesterfield and Virginia Beach.
Bottom half: The other 122 counties/independent cities. Biden carried 35, comparable to the 37 that Obama carried.
The trajectory of Virginia’s top half from 2012 to 2020 mirrors that of the top half of Georgia, as both zoomed roughly 15 points toward the Democrats in terms of margin. Biden won the top half of Virginia by 32 points, a margin greater than the 30 points by which Biden won the top half of Minnesota, which we explored last week. Meanwhile, the Republican margin in the bottom half of Virginia was only about 11 points, or just about 3 points better than it was in 2012.
Democrats are buoyed by the presence of several key voting centers among the bottom half counties/cities, such as overwhelmingly Democratic Newport News, which was the biggest source of votes in the bottom half. There are paths for Republicans to win statewide — as shown in the 2021 state elections — but Virginia has still pretty clearly moved toward the Democrats in federal elections.
Conclusion
Table 7 shows how these 6 states voted in 2020 overall, as well as how their top and bottom halves voted. In all 3 sections, the states are ranked from most Democratic to most Republican.
Table 7: 2020 results in select eastern states
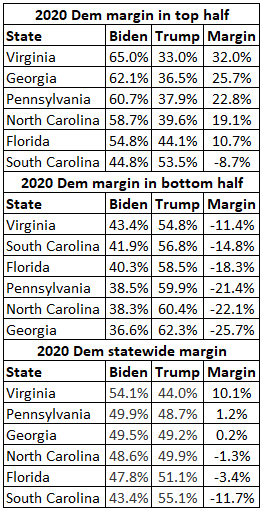
Some takeaways:
— Virginia had both the bluest top and bottom halves, unsurprising for a state that is much more Democratic than the other 5 at the federal level.
— Georgia had the second-bluest top half, but also the reddest bottom half, which contributed to the state’s tiny margin in favor of Biden in 2020. However, the top half got way bluer from 2012 to 2020 while the bottom half hardly moved at all, so the arrow may be pointing up for Democrats in Georgia moving forward.
— There are more than 40-point marginal gaps between the top and bottom halves of both North Carolina and Pennsylvania, with the top halves each being around 20-point Democratic margins and the bottom halves each being around 20-point Republican margins. Each gave their winning presidential candidate a margin of just a little over a point in 2020, so it wouldn’t take much change to flip either.
— Florida’s top half is considerably less blue than those of Georgia, North Carolina, Pennsylvania, and Virginia, which goes a long way toward explaining why it’s become redder than those other states.
— South Carolina’s bottom half is not very red compared to the others, but its top half definitely is.