| Dear Readers: New Center for Politics Professor of Practice Liz Cheney will discuss her time in Congress, her role on the Select Committee that investigated Jan. 6, 2021, and more in a conversation with Center for Politics Director Larry J. Sabato on Wednesday, April 19.
The conversation will run from 6:30 p.m. to 8 p.m. at Alumni Hall’s Jefferson Ballroom on the Grounds of the University of Virginia. Tickets are free and available to the public; those who would like to attend must reserve tickets in person at the UVA Arts Box Office, which is open Tuesday-Friday from noon to 5 p.m. and is located at 109 Culbreth Road in Charlottesville. There is a two-ticket limit. The program will also be livestreamed at https://livestream.com/tavco/conversationwithlizcheney. — The Editors |
KEY POINTS FROM THIS ARTICLE
— We’re continuing our series of looking at how the most vote-rich counties in a state vote versus those that make up the rest of the state by moving to the Southwest.
— The region contains the key swing states of Arizona and Nevada, both of which are dominated by a single county that casts well north of half the statewide vote.
— Both the top and bottom halves of Texas have moved toward the Democrats from 2012-2020, but the top half just is not blue enough at the moment.
— Colorado and New Mexico have moved out of the swing state category, pushed by top-half shifts.
Presidential trends in the Southwest
We received several kind emails from readers last week who enjoyed our reference to James Brown’s “Night Train” on our political trek up the East Coast, so this week’s itinerary is provided courtesy of Brown’s much lesser-known song “Day Train,” which follows a meandering route from Galveston, Texas to Grand Junction, Colorado.
Just kidding — no such song exists, as far as we know. The musical inspiration for this week should perhaps be Marty Robbins’s “El Paso,” or, if we want to stick to train references, maybe the movie 3:10 to Yuma.
We’re applying our top half/bottom half presidential voting analysis to 5 key states in the Southwest: Arizona, Colorado, Nevada, New Mexico, and Texas.
Unfortunately, this method of analysis — comparing how a state’s biggest counties that cast roughly half the statewide vote have changed from 2012 to 2020 versus the bottom half counties that cast the remainder of the statewide vote — does not work well with Arizona and Nevada, the most competitive states in the region and 2 of the 7 states that were decided by less than 3 points in 2020. That’s because each has a single dominant county that casts considerably more than half of the statewide vote. But these 2 states are so interesting and important that we are going to look at them here as well.
As recently as 2004, George W. Bush carried all 5 of these states, but there’s been a Democratic trend in the region more broadly in the years since, with Colorado, Nevada, and New Mexico voting Democratic in each of the last 4 elections, and traditionally Republican Arizona flipping to Joe Biden in 2020. Meanwhile, the megastate Texas — which now has 40 electoral votes — is showing signs of becoming markedly more competitive even as it is still clearly positioned to the right of the nation. We’ll start there and work our way across the region.
As with our similar pieces from the last couple of weeks on the Midwest and the East, the election results are from Dave Leip’s Atlas of U.S. Presidential Elections unless otherwise noted, and the maps highlighting the “top half” counties in each state (in orange) are from Dave’s Redistricting App.
TEXAS
Map 1: Texas top half counties
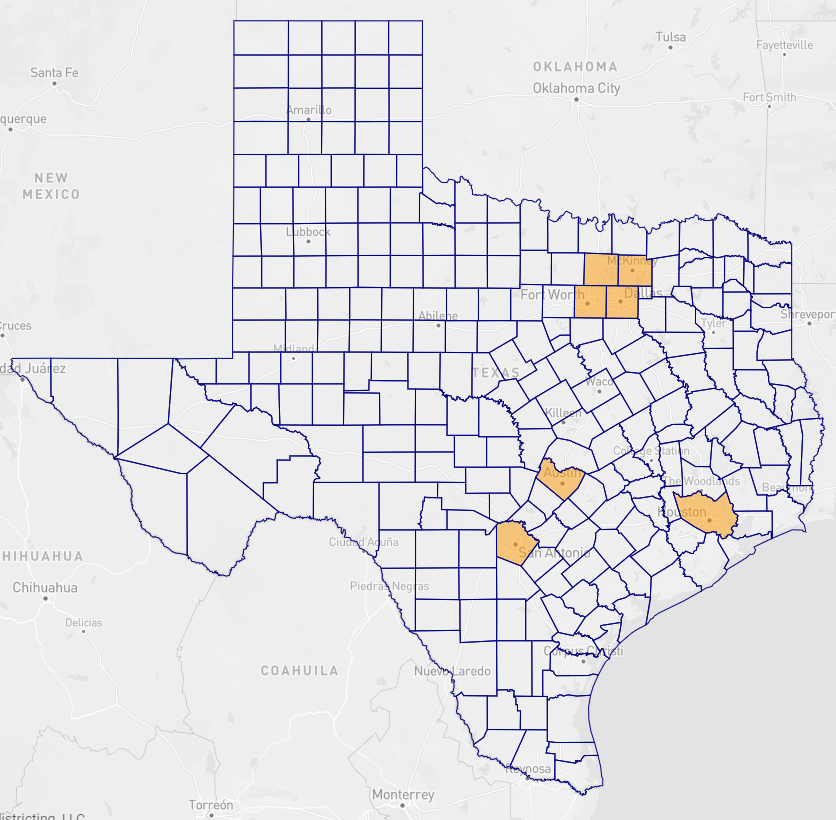
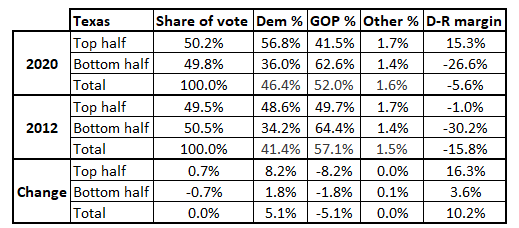
Table 1: Texas presidential voting, 2020 vs. 2012
Top half of counties that add up to half the statewide vote: Seven counties that are centered around 4 major urban areas: Harris (Houston); the quartet of Dallas, Tarrant, Collin, and Denton, which make up the heart of the Dallas-Fort Worth Metroplex; Travis (Austin); and Bexar (San Antonio). Harris is by far the largest single source of votes, casting a little under 15% of the statewide vote, although combining the second and third-largest sources of votes, Dallas and Tarrant (Fort Worth), slightly surpasses Harris, as that combination casts a little over 15% of the statewide vote. Biden won all of these counties but Collin and Denton; Barack Obama lost Tarrant in addition to Collin and Denton, and his margin in mighty Harris was only about a tenth of a point, while Biden’s edge there was 13 points.
Bottom half counties that make up the remainder of the statewide vote: The other 247 of the megastate’s 254 counties. Suburban Houston’s Fort Bend is the biggest source of votes in this group, with about 360,000 cast in 2020 (roughly triple what the county cast in the 2000 election, which is a tribute to the county’s exploding population), while the smallest source is Loving County in the western panhandle, which cast just 66 votes for president in 2020. When you’ve got 254 counties plus a lot of open land and even some desert, some of those counties aren’t going to cast very many votes. Biden won 17 of these counties; Obama won 22.
Outside of the core swing states, Texas is probably the most interesting state in presidential politics — not for what it is, but what it could be. If it were to become an actual swing state, Texas would immediately become a gigantic prize — its 40 electoral votes are nearly half of the total cast by the 7 total states that were most closely decided in 2020 (Arizona, Georgia, Michigan, Nevada, North Carolina, Pennsylvania, and Wisconsin, with 93 combined electoral votes under the most recent Electoral College apportionment). But the Lone Star State is still positioned clearly right of center: Donald Trump won it by 5.5 points while losing the national popular vote by 4.5 points, meaning that its margin was still 10 points right of the nation in 2020. However, that’s also much less red than in 2012, when Mitt Romney won Texas by 16 while he was losing the national popular vote by 4. So relative to the nation, Texas got markedly less red from 2012 to 2020. Another turn of that wheel would place Texas right around how the nation votes — whether it is coming is anyone’s guess.
Texas is similar to Georgia, which we covered last week, in that its top half has moved toward the Democrats from 2012 to 2020 while its bottom half remained fairly static. Romney actually won the top half of Texas, narrowly, in 2012 en route to his 16-point statewide win. By 2020, though, Biden carried the top half by 15 points; in the process, he became the first Democrat to carry Fort Worth’s Tarrant County since Lyndon Johnson, a Texan, in 1964. At the same time, Biden improved by a modest 3.5 points in the bottom half, although he still lost that half by about 27 points. In Georgia, the top and bottom voted, respectively, for Biden by 26 points and Trump by 26 points, an equilibrium that allowed Biden to narrowly win the state. In Texas, the GOP margin in the bottom half remains about 10 points larger than the Democratic margin in the top half.
We have generally just restricted ourselves to comparing 2012 to 2020 in this series, in part because the national popular vote margin was almost identical between the 2 years (3.9 points for Obama to 4.5 points for Biden), whereas Hillary Clinton’s popular vote margin was just 2.1 points in her Electoral College loss. We also wanted to capture the entirety of the changes from 2012 to 2020, as there were some added wrinkles in 2020 (continued suburban realignment toward Democrats, a drop-off for Democrats in some urban and/or diverse areas, a better Trump performance in some white rural areas, etc.). One other reason to stick to 2012 and 2020 is that the total vote share for third party candidates was just about 2% in each election, but it was a higher 6% in 2016. But we wanted to look at 2016 in Texas to try to see if the strong shift toward Trump in some heavily Hispanic areas from 2016 to 2020 (particularly in South Texas) contributed to some unusual patterns — namely, if Biden did worse in the bottom half counties than Clinton did despite his overall improvement.
The answer is no, although Biden’s bottom half improvement over Clinton was very small.
In 2016, Clinton won the top half of Texas by 9.9 points and lost the bottom half by 27.6 points. So Biden’s margin in the top half was about 5 points better than Clinton’s, and he did a point better in the bottom half. The Democratic decline in places like South Texas was counterbalanced by Democratic improvements in some more populated counties. For instance, Biden not only flipped Tarrant, but also Travis’s (Austin) neighboring suburban counties, Williamson to the northeast and Hays to the southwest (Clinton did not win any of those counties). Overall, South Texas just doesn’t cast that many votes relative to the entire state — about 75% of the state’s population is located in the so-called “Texas Triangle,” which has as its top point the Metroplex, at its bottom left point San Antonio, and at its bottom right point Houston (Tomas Pueyo had a widely shared tweet thread about the Texas Triangle last week).
Still, the Democratic improvements in the top half showed some signs of stalling in 2020. For instance, Houston’s Harris had almost exactly the same presidential margin in 2016 and 2020 (12.3 points versus 13.3 points — its big shift toward the Democrats came in 2016). This came as the other components of the top half continued to get clearly more Democratic from 2016 to 2020.
In order for Democrats to carry the state, we suspect Democrats would have to carry all 4 of the core Metroplex counties: Collin and Denton in addition to Dallas and Tarrant. That may happen in the not-too-distant future, as both Collin and Denton voted for Romney by about 31.5 points but only voted for Trump by about 4.5 (Collin) and 8 (Denton) points respectively, although of course Democrats will need improvements elsewhere, too. Our hunch is that Republicans aren’t really going to have to worry about Texas for 2024, but maybe they will later on in this decade or in the next one.
COLORADO
Map 2: Colorado top half counties
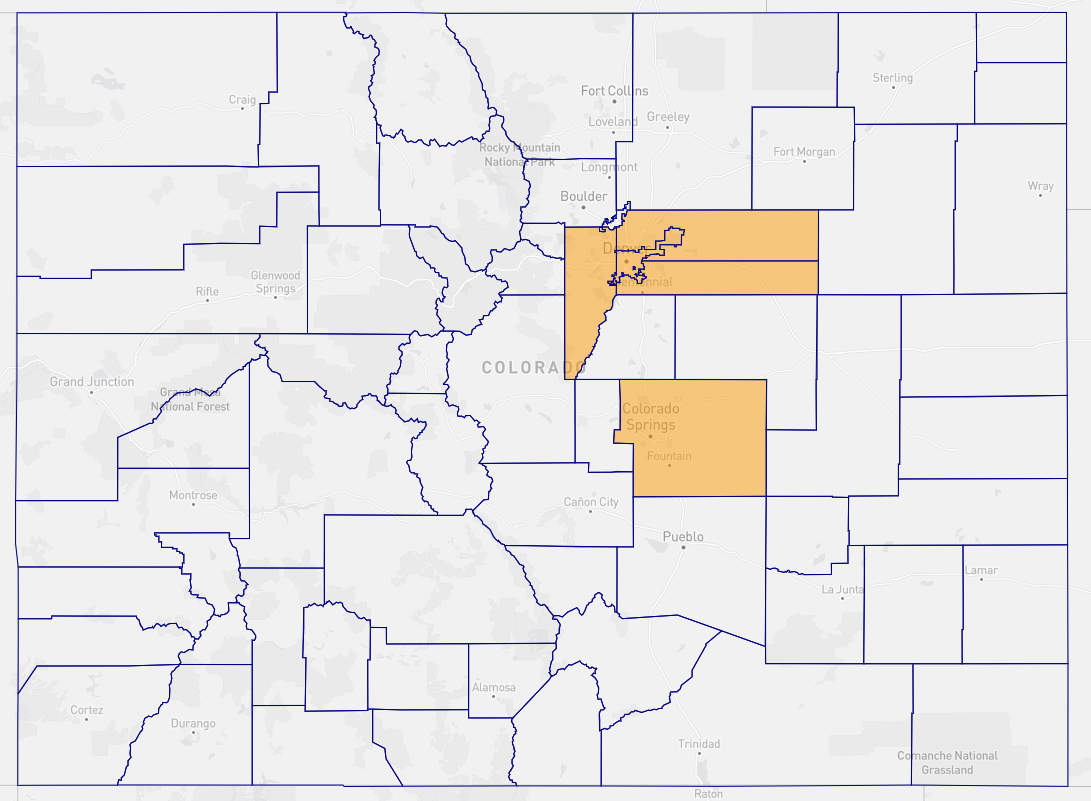
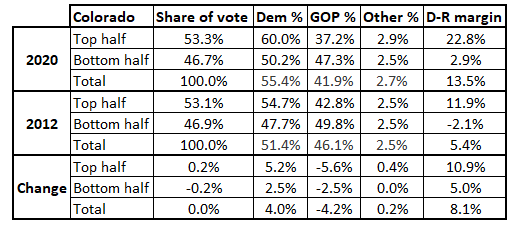
Table 2: Colorado presidential voting, 2020 vs. 2012
Top half: The top half is focused on Denver: 4 of its 5 counties are the city itself (which is the consolidated city/county of Denver) and the 3 suburban counties that surround it: Jefferson, Arapahoe, and Adams. Together they make up a little more than 40% of the statewide vote. However, the second-largest source of votes in the state (slightly behind Denver and just ahead of Jefferson) is El Paso County, home of historically conservative Colorado Springs and the U.S. Air Force Academy. However, El Paso County has been getting more competitive. Both Biden and Obama won 4 of these 5, with El Paso being the only exception.
Bottom half: The state’s 59 other counties, of which Obama won 23 and Biden won 20. Colorado features a wide variety of counties. The eastern third of the state is sparsely populated and politically reminiscent of its neighbors in western Kansas and Nebraska (very Republican). There are also deeply blue ski resort areas (like Pitkin County, home to Aspen), as well as some significant conservative pockets on the Utah border. Boulder County, home of the University of Colorado’s flagship university, provides a substantial blue anchor in this group.
Perhaps no Obama-era swing state has moved more decisively toward the Democrats in the Trump era than Colorado — of the states that were close in 2012, the only other real contender is Virginia, and Colorado moved a bit more from 2012 to 2020 than the Old Dominion did.
The story is a bit different than other states. Yes, the Democratic shift has been driven by a big swing to the left in the top half counties, with the Democratic edge ballooning in Denver and its surrounding suburban counties and the Republican advantage in Colorado Springs declining. This makes it similar to some other states we have looked at. However, Colorado’s bottom half also moved about 5 points in margin toward Democrats. This is actually the first state we have looked at in this series (encompassing 18 total states) where Biden won the bottom half counties. So while the top half of Colorado is not quite as blue as some other states — its 2020 Biden margin was the same as Pennsylvania’s top half — the movement in both the top and bottom halves has pushed it out of the competitive zone in American presidential politics.
If Florida was basically the most impressive showing for Republicans in the 2022 midterm, Colorado may have been the most impressive performance for Democrats: Democratic Gov. Jared Polis and Sen. Michael Bennet won by 19 and 15 points, respectively, very similar to the landslide margins enjoyed by Republican Gov. Ron DeSantis and Sen. Marco Rubio in Florida. As we often say, midterms do not project forward to presidential elections, but just as there was nothing encouraging for Democrats in Florida last year, nor was there anything encouraging for Republicans in Colorado.
NEW MEXICO
Map 3: New Mexico top half counties
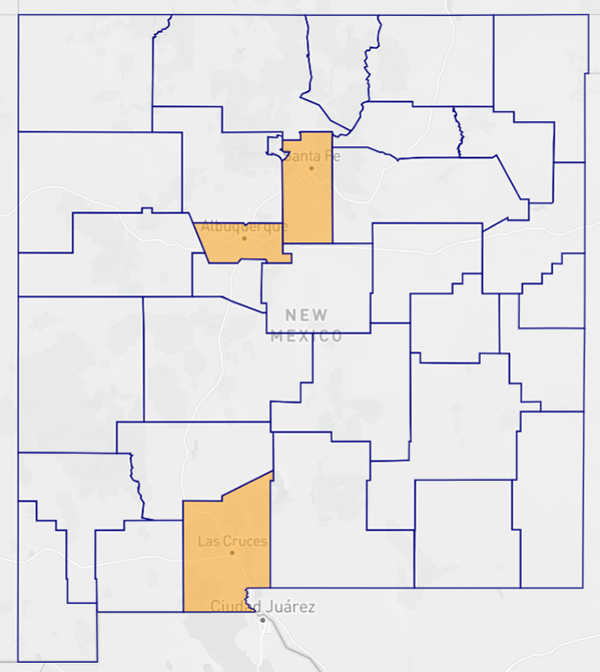
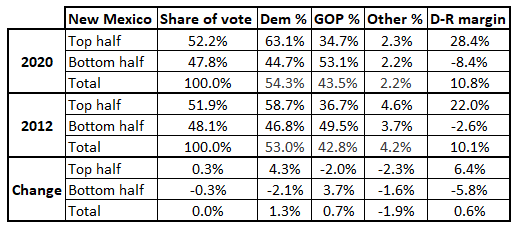
Table 3: New Mexico presidential voting, 2020 vs. 2012
Top half: Half the statewide vote comes from just 3 counties: Bernalillo (Albuquerque), which alone casts a little over a third of the vote, along with neighboring Santa Fe as well as Dona Ana in the southern part of the state, which is just on the other side of the Texas border from El Paso and contains the city of Las Cruces. Both Obama and Biden swept these counties.
Bottom half: 30 other counties; Obama won 14, while Biden won 11. There are some blood red and decently-populated portions of the state, like San Juan County in the state’s northwest corner and Chaves, Eddy, and Lea in the southeast corner. The oil-rich Permian Basin is mostly contained in Texas but covers some of southeast New Mexico, and the whole area is deeply Republican.
Since becoming a state in advance of the 1912 presidential election, New Mexico has only voted for the losing candidate 3 times: 1976, when it backed Gerald Ford, as well as 2000 and 2016, when it voted for Democratic presidential nominees who won the popular vote but lost the Electoral College. The state was very hotly contested in both 2000 and 2004, but since then its smallest Democratic margin was 8 points in 2016. Both before and after that election, the Democratic performance was very similar: Obama won by a little over 10 points in 2012 and Biden won by a little under 11 in 2020.
The top half moved about a half-dozen points toward the Democrats in those 8 years, while the bottom half moved about a half-dozen points toward the Republicans. Back in Bush’s 2 elections, Bernalillo and Dona Ana were fairly closely contested (Santa Fe has been overwhelmingly Democratic for the past few decades). Now that all 3 of the top half counties are very clearly Democratic, the state appears out of reach for Republicans at the presidential level.
ARIZONA AND NEVADA
We’re treating both of these states differently than the others we have covered because they break the rules of how we’ve constructed the top and bottom halves of states. Each state has a single county that casts well north of half the statewide vote, so it’s impossible to separate them into 2 roughly equal halves (there’s also not much point in a map, given that we would only need to highlight a single county). Still, we show how their dominant counties voted compared to the rest of their states in Tables 4 and 5.
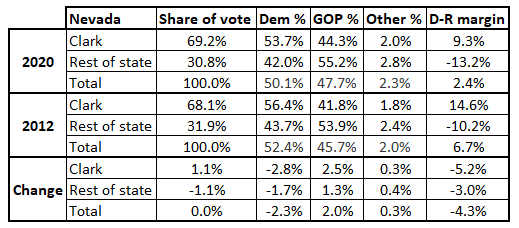
Tables 4 and 5: 2020 vs. 2012 in Arizona and Nevada
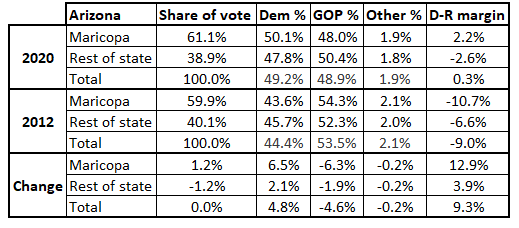
In Arizona, Maricopa County (Phoenix) casts about 60% of the vote. It voted Democratic in 2020 for the first time since 1948; in that same timeframe, Arizona voted Democratic for president just 2 times (2020 as well as 1996, when Bill Clinton narrowly won Arizona despite losing Maricopa). Notice that in 2012, the rest of Arizona was less Republican than Maricopa. That was a consistent trend throughout almost the entirety of Arizona’s presidential voting history. Like New Mexico, Arizona first participated in a presidential election in 1912. In every election until 2016, Maricopa was more Republican than the state. But Maricopa voted slightly less red than Arizona as a whole in 2016, and in 2020 it flipped Democratic overall, pulling the rest of Arizona along with it. Both halves of the state got bluer from 2012 to 2020, although Maricopa’s shift was much more dramatic. Pima (Tucson) provides a Democratic base south of Phoenix and casts about 15% of the statewide vote, while the combination of Pinal (bordered to the north and west by Maricopa), Yavapai (to Maricopa’s north), and Mohave (in the state’s northwest corner) collectively cast about 13% of the statewide vote and are very Republican. Combining those with Maricopa and Pima accounts for about 90% of the total.
In Nevada, Clark County (Las Vegas) casts an even greater share of the statewide vote — nearly 70%. Clark is still Democratic-leaning, but the Democratic edge has eroded in recent years, dipping into the single digits in 2020 after 3 straight double-digit margins from 2008-2016. This has left the Democratic statewide edge tenuous — a little under 2.5 points in both 2016 and 2020.
The political geography of Nevada is fairly simple: Clark in the state’s southern tip votes Democratic, but not overwhelmingly so. Washoe (Reno) in the northwest casts more than half of the state’s remaining vote, and it is a swing county that Democrats have generally won in close races recently: Former Gov. Steve Sisolak (D) carried it by 1.5 points last year, but he lost to now-Gov. Joe Lombardo (R) anyway because Lombardo kept Sisolak’s margin under a half-dozen points in Clark. The rest of the state is extremely Republican, although combined those counties cast only 13% of the statewide vote.
The major cities in both Arizona and Nevada, Phoenix and Las Vegas (respectively), make up about 20% of the statewide vote by themselves. The cities differ in terms of how they compare with their counties: Phoenix itself voted for Biden by about 21 points while Biden only won the county by 2; meanwhile, Las Vegas voted for Biden by about 10.5 points, just a little bit better than Biden’s Clark County margin. As recently as 2012, Las Vegas was clearly more Democratic than Phoenix, but the 2 cities voted fairly similarly in 2016 and then Phoenix voted substantially more Democratic than Las Vegas in 2020. (We used Dave’s Redistricting App, which uses the Voting and Election Science Team as a source, to calculate these city-level statistics.)
One key difference between Clark and Maricopa counties is 4-year college attainment, which has been a driving indicator in recent political trends (with places with higher attainment likelier to be moving toward Democrats). In Maricopa, 4-year college attainment is about 34.5%, markedly higher than Clark’s 26%.
Given recent trends, it wouldn’t shock us if Arizona eventually became a more reliable state for Democrats than Nevada. But in the context of 2024, we would expect both to be very hotly contested.
Conclusion
Because Arizona and Nevada don’t really have comparable top and bottom halves to the other 3 states, we’re not going to rank these 5 states in comprehensive tables (like we did for the Midwest and East previously). However, we do have a few concluding takeaways:
— Clark County in Nevada is still more Democratic than Maricopa County in Arizona, but we could imagine the counties converging in the not-too-distant future. If that happened, Arizona would very likely move to the left of Nevada.
— The top halves of both Colorado and New Mexico are both blue to varying degrees, and the bottom half of Colorado stands out as actually voting for Biden in 2020.
— Democrats have made some progress in both the top and bottom halves of Texas, but they need the top half of Texas to look more like that of Georgia to win the state.