| Dear Readers: Join us on Monday, April 3 for “Drawing the Lines: Political Cartoons in the Digital Age,” a conversation with 4 of the nation’s top political cartoonists. Center for Politics Director Larry J. Sabato will moderate the discussion with Lalo Alcaraz, winner of the 2022 Herblock Prize and two-time Pulitzer finalist; Darrin Bell, Pulitzer-winning political cartoonist and creator of the comic strip “Candorville”; Ann Telnaes, Pulitzer-winning editorial cartoonist for the Washington Post; and Matt Wuerker, Pulitzer-winning staff cartoonist and illustrator for Politico.
The program begins at 6:30 p.m. eastern at Ridley Hall, Room G008, on the Grounds of the University of Virginia. It is free and open to the public to attend with advanced registration through Eventbrite; it will also be livestreamed at https://livestream.com/tavco/thepowerofpoliticalcartoons. — The Editors |
KEY POINTS FROM THIS ARTICLE
— This piece analyzes recent presidential voting patterns in the Midwest by comparing the big counties that cast roughly half the statewide vote with the smaller counties that cast the rest of the statewide vote.
— In Illinois and Minnesota, more than half of the statewide vote comes from dominant metro areas, and improvements in those areas from 2012 to 2020 allowed Democrats to maintain their strong position in both states.
— The smaller-county halves of Iowa and Ohio have zoomed right, pushing them out of the roster of competitive states.
— The bottom hasn’t dropped out for Democrats in nearly the same way in Michigan and Wisconsin.
Competing halves in the Midwest
A couple of weeks ago, I gave a presentation back home in Cleveland about the trajectory of Ohio’s presidential voting. The book I wrote several years ago about the state, The Bellwether, is clearly a work of history now, examining what was as opposed to what is. The Buckeye State has moved to the right, removing it from its long-held position as one of the nation’s key presidential bellwethers.
One of the main factors driving that change is a clear Republican shift in the state’s smaller counties — back in 2012, I noted to the audience, there were just 6 of Ohio’s 88 counties that gave Mitt Romney more than 70% of the vote. By 2020, 44 counties — fully half of the state’s total — had given Donald Trump greater than 70%.
However, it is worth remembering that half of a state’s counties does not mean half of a state’s votes. Those 44 Ohio counties that gave Trump landslide margins cast just about 15% of the statewide vote in 2020. Starting from the county that cast the least votes and working up, you would need to put together 79 of the 88 counties to get roughly half the statewide vote in Ohio. The other half of the vote is cast by just the 9 biggest-voting counties.
This got me thinking about looking at the Midwest more broadly, and dividing not just Ohio, but also 6 other classically-defined Midwest states (Illinois, Indiana, Iowa, Michigan, Minnesota, and Wisconsin) into halves, and comparing how they voted in 2012 (when Barack Obama won all but Indiana) to 2020 (when Joe Biden beat Donald Trump in 4 of the 7, with the former winning Illinois, Michigan, Minnesota, and Wisconsin, and the latter carrying Indiana, Iowa, and Ohio).
What follows is an examination of how these states vote, divided into halves: the votes cast by the biggest counties adding up to roughly half the state (which we’ll call the top half) compared to the other half of the vote cast by the rest of the state (which we’ll call the bottom half). The story told is a familiar one: Throughout the Midwest, the vote cast by the top half is markedly more Democratic than the vote cast by the bottom half, and the bottom half generally zoomed right from 2012 to 2020 while the top halves varied.
The location and voting habits of the more populous counties in a state also factors into the differences among them. Illinois and Minnesota, for instance, are dominated by their respective main metro areas (Chicago and the Twin Cities), which helps explain why they are the most Democratic states in the region. Likewise, the diffuse nature of Indiana, Iowa, and Ohio’s most vote-rich counties combined with the strong Republicanism of their smaller counties accounts for their recent surge to the right (particularly in the case of Iowa and Ohio, which both voted for Obama twice but are no longer credible Democratic presidential targets). This also gets at the urban versus rural divide in these states, although we don’t really use that distinction in our commentary below, largely because it oversimplifies the divide between the big county half and the small county half. As you’ll see, there are lots of decently-sized or even big counties that are not included in the “top” half in each state, meaning that we wouldn’t really call them “rural.”
Before we go state by state, let’s explain how we did this. We used our favorite source for presidential election results, Dave Leip’s Atlas of U.S. Presidential Elections, and sorted the counties in each state according to how many votes they cast in 2020. Starting with the most vote-rich county, we kept adding counties until we got closest to half the statewide vote. As you’ll see in the tables, this was different for every state, as we did not split any counties, so the total share of the vote cast by the group of bigger counties ranged from about 49%-52% of the vote. We calculated the voting patterns for each “half” of the state — the big county group (top half) versus the small county (bottom half) group — and then compared how each half voted in 2012. Even though in a few instances the lineup of counties in each group was a little different in 2012 than 2020, we stuck with the 2020 order when looking at the 2012 results — and the tables show what percentage of the vote each group of counties cast in both elections. Percentages in the tables may not add precisely to 100% because of rounding.
The maps shade the counties included in the top half group in each state in orange; all of the remaining counties, combined, cast roughly the other half of the vote in the state and make up the bottom half group. We created the maps using Dave’s Redistricting App.
ILLINOIS
Map 1: Illinois top half counties
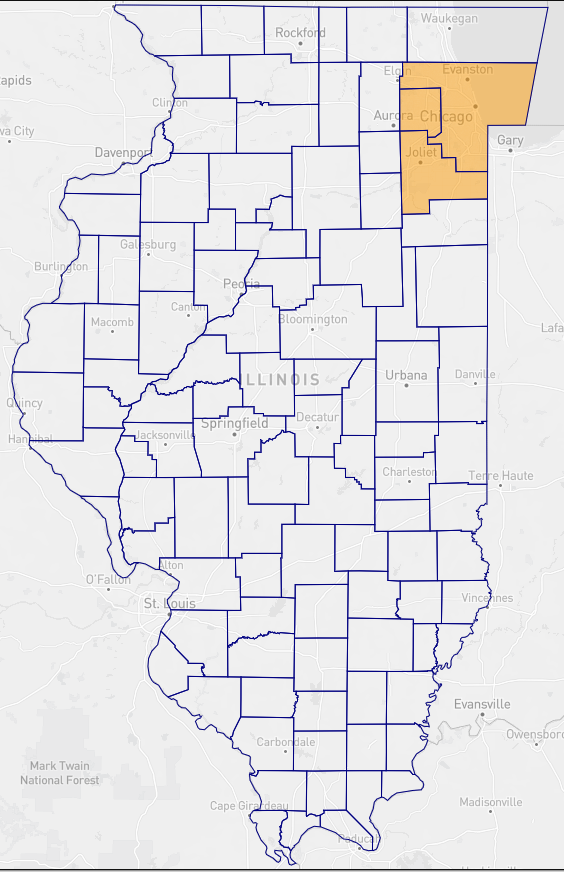
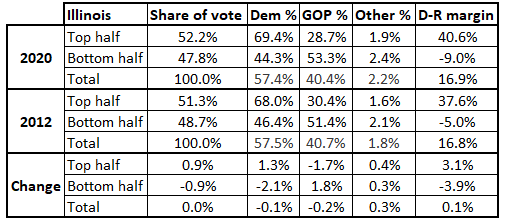
Table 1: Illinois presidential voting, 2020 vs. 2012
Top half counties that add up to half the statewide vote: Cook, DuPage, and Will. Cook is Chicago, while DuPage and Will are 2 of its collar counties. Back in 2012, one of the other collar counties — Lake, directly north of Cook — was the third-largest source of votes, but it has since been surpassed by Will, which is directly south of Cook.
Bottom half counties that make up the rest of the state: 99 of the state’s 102 counties, including the other Chicago collar counties: Lake, Kane, and McHenry.
Illinois, which at one time was a bellwether state, is dominated by Chicago and its collar counties: Those 6 counties cast nearly two-thirds (64%) of the statewide vote in 2020, with Cook itself accounting for 38%. The interplay between Chicago and its suburbs kept Illinois competitive: Cook has long been Democratic (although it has gotten bluer more recently), the collars were long Republican, and downstate was marginal. But Joe Biden carried all of the collar counties except for narrowly losing McHenry in 2020, and while Republicans have gained downstate, those improvements have been canceled out by Democratic gains closer to Chicago. The changes have kept Illinois in Democratic-leaning stasis: Its margins in favor of Democrats in the last 3 presidential elections were nearly identical each time. Barack Obama won the state by 16.84 percentage points in 2012, Hillary Clinton won it by 16.88, and Biden won it by 16.94.
INDIANA
Map 2: Indiana top half counties
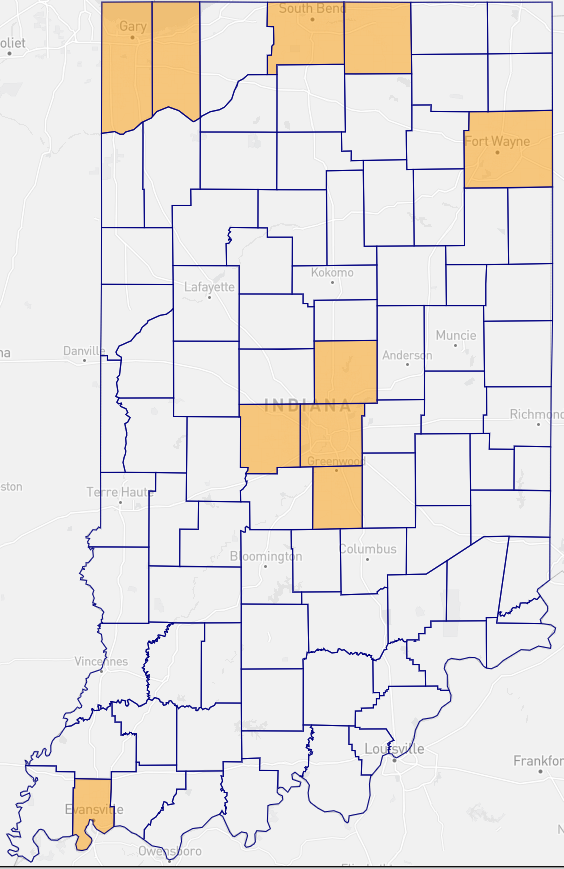
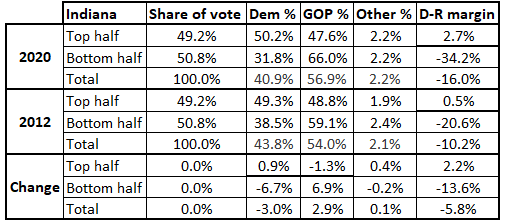
Table 2: Indiana presidential voting, 2020 vs. 2012
Top half: Marion (Indianapolis), along with 3 of its collar counties (Hamilton to the north, Hendricks to the west, and Johnson to the south); Lake and Porter in the northwest; St. Joseph (South Bend) and Elkhart in the north central; Allen (Fort Wayne) in the northeast; and Vanderburgh (Evansville) in the southwest. Biden carried only Marion, Lake, and St. Joseph.
Bottom half: The other 82 counties. Biden carried only 2: Monroe and Tippecanoe, home of, respectively, Indiana University and Purdue University.
Of these 7 states, Mitt Romney carried only Indiana in 2012. This was after the state voted very narrowly for Obama in 2008, which was a blip in what is otherwise a clearly Republican-leaning state.
The Hoosier State’s biggest source of votes is Marion County (Indianapolis). But it only casts about 13% of the statewide vote. Several of its surrounding suburban/exurban counties are also in the bigger county bloc, as are several northern counties covering Gary/Hammond (Lake) and South Bend (St. Joseph). Fort Wayne’s Allen County and Evansville’s Vanderburgh are also in this group. As it was, Biden actually performed slightly better than Obama in the bigger counties, but they were very closely contested, while the Republican margin swelled in the counties in the smaller-county half. As Illinois is the most Democratic state in the region, Indiana is the most Republican, and an examination of its halves tells the tale: The big county portion is only barely Democratic, and the small county portion is redder than any other examined here.
IOWA
Map 3: Iowa top half counties
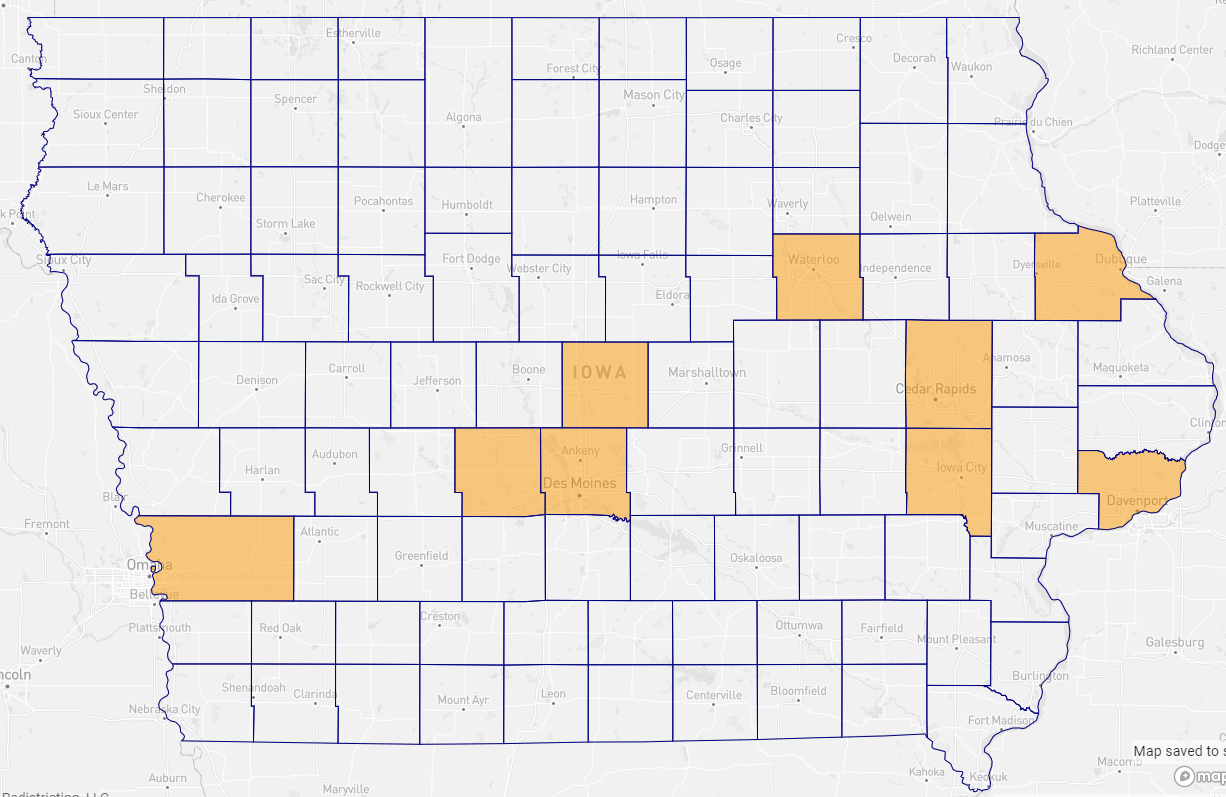
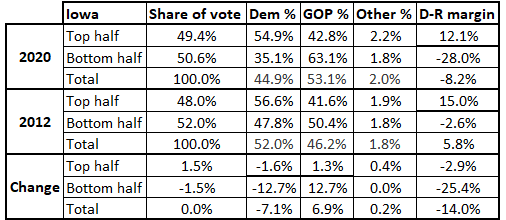
Table 3: Iowa presidential voting, 2020 vs. 2012
Top half: Polk (Des Moines) casts only about 15% of the statewide vote. It’s joined in this group by its growing suburban/exurban western neighbor, Dallas, and its northern neighbor, Story. The other major vote centers are mostly east of Des Moines: Black Hawk (Waterloo), Dubuque, Linn (Cedar Rapids), Johnson (Iowa City), and Scott (Davenport). Pottawattamie, in the southwest, is on the other side of the state border from Omaha, Nebraska. The only county that switched from 2012 to 2020 was Dubuque, which voted for Obama by 15 but Trump by 3.
Bottom half: 90 other counties. Obama carried 31 of them in 2012; Biden carried none.
No state in the region swung as heavily Republican between 2012 and 2020 as Iowa, which went from a 6-point Obama victory in 2012 to an 8-point Trump win in 2020. The Democratic fall was largely about the smaller counties: Biden’s margin in the bigger counties was 12 points, just 3 points worse than Obama’s 2012 margin. Biden lost a lot of ground in the big population centers of eastern Iowa, with the exception of the most Democratic county in the state, Johnson, home to the University of Iowa. But he did better than Obama in the 3 vote centers in central Iowa: Polk (Des Moines), as well as its western neighbor, Dallas, and Story to its north, home of Iowa State University.
The big change was that Obama came within about 2.5 points of carrying the small-county group in 2012; Biden lost it by nearly 30 points. This was the biggest swing of any of the state halves we examined in this region.
MICHIGAN
Map 4: Michigan top half counties
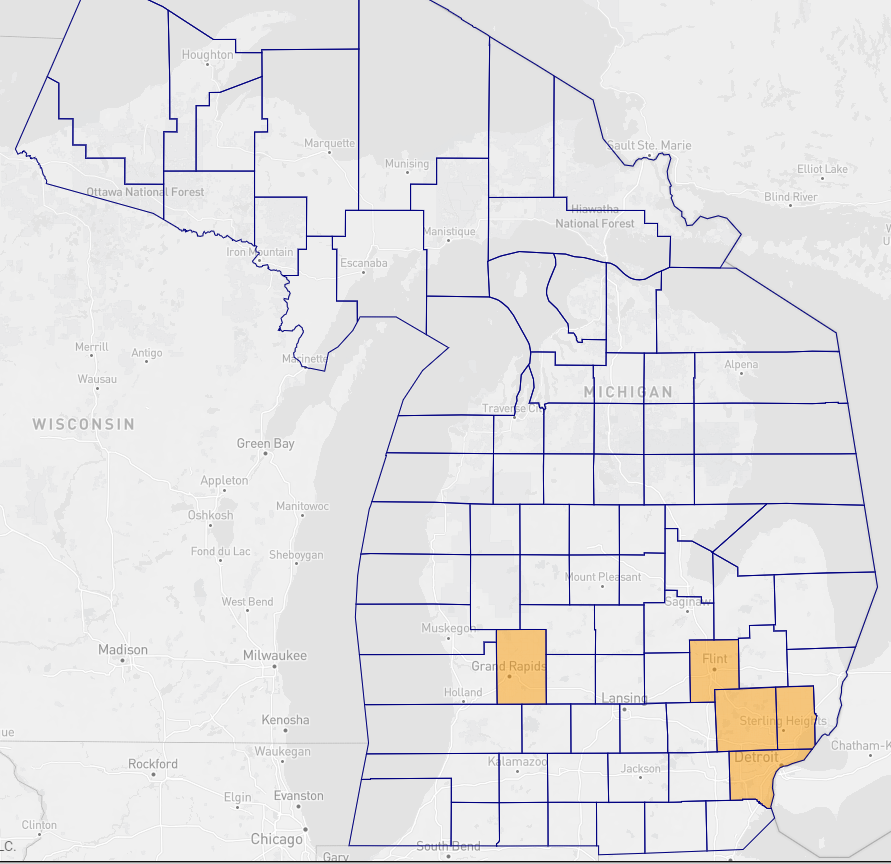
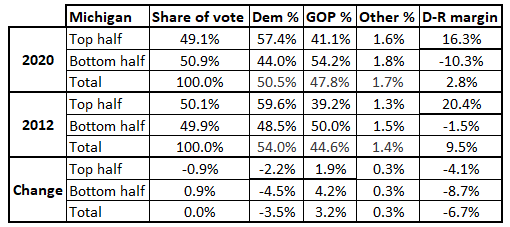
Table 4: Michigan presidential voting, 2020 vs. 2012
Top half: Wayne (Detroit), along with its suburban neighbors, Oakland to the northwest and Macomb to the northeast. Genesee (Flint) is just outside of Detroit’s orbit, while Kent (Grand Rapids) is in western Michigan. Biden won 4 of 5, losing only Macomb; Obama won 4 of 5, losing only Kent. While pro-Democratic suburban trends have shifted Kent and Oakland leftward, the other 3 have swung rightward to varying degrees.
Bottom half: This group contains 78 of the state’s 83 counties. Washtenaw, which was the bluest county in the state in 2020 and is the home of the University of Michigan, is the biggest county in this group. Biden won 7 of these counties, down from Obama’s 16.
Michigan’s big half vs. small half dynamic is somewhat similar to Illinois and Minnesota, in that a lot of its vote is concentrated in a single metro area (Detroit), but Detroit does not quite dominate Michigan the way that Chicago or the Twin Cities dominate their respective states — which is part of why Michigan is more competitive than the other two, at least at the moment. Another key difference is that Macomb, the suburban/exurban Detroit county that became synonymous with the so-called “Reagan Democrats,” is not a Democratic-leaning county (it voted for Obama twice, but also Trump twice). Democrats have seen erosion in both the top and bottom county halves, but the decline in the latter is more modest than many of these other states, probably because there are some major Democratic vote anchors included in that group, including Washtenaw and Ingham (home to Lansing, the state capital, and Michigan State University) as well as Kalamazoo (Western Michigan University).
MINNESOTA
Map 5: Minnesota top half counties
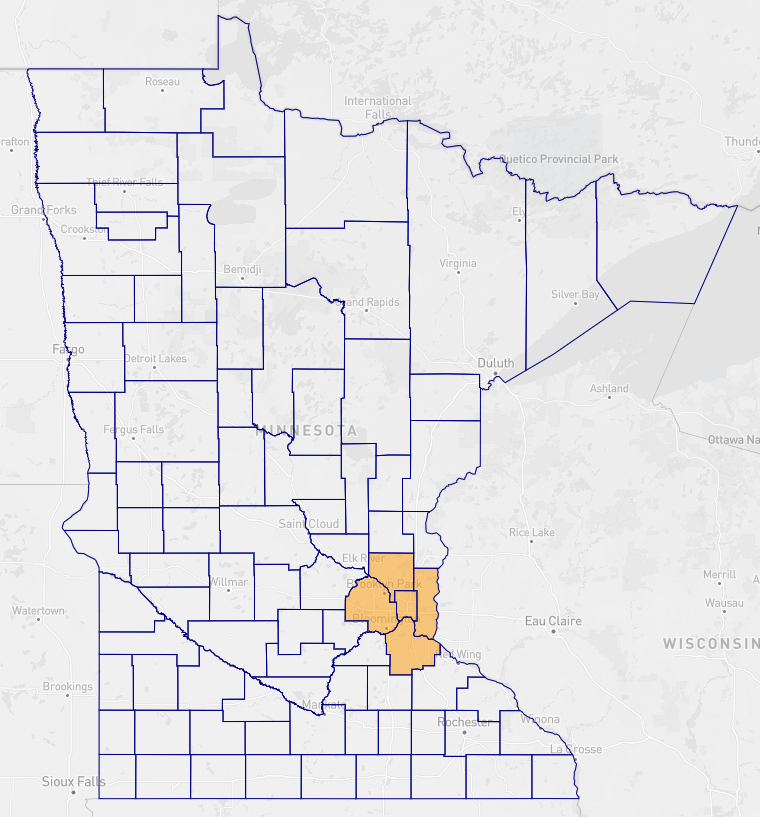
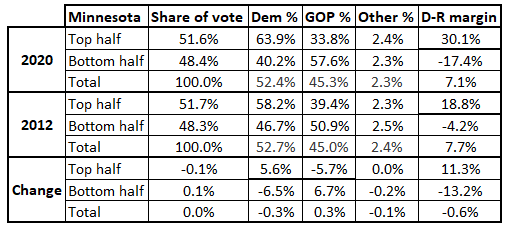
Table 5: Minnesota presidential voting, 2020 vs. 2012
Top half: All 5 are anchored in the Twin Cities: Hennepin, by far the state’s largest source of votes, covers Minneapolis, while Ramsey contains Saint Paul. Dakota is to the Twin Cities’ south, Anoka is to its north, and Washington is to its east. Both Obama and Biden carried 4 of the 5 counties, as they both lost Anoka, although only by a few points apiece.
Bottom half: A couple of the counties covered by the Twin Cities’ Metropolitan Council, Carver and Scott both to the southwest of the Twin Cities, are included in this group, underscoring the political weight of the Twin Cities metro area. Carver and Scott are Republican but getting more competitive: In 2012, Carver was Romney’s 13th best county in the state, but by 2020, Trump did better in 69 other counties. Scott has seen similar trends. More broadly, this group includes 82 of Minnesota’s 87 counties. Obama carried 24 but Biden only carried 9.
The Twin Cities provide a strong anchor for Democrats: Together, Hennepin and Ramsey counties cast a little under a third of the statewide vote (32%), and they gave Biden a 44-point margin. They do not quite have the weight of Cook in Chicago — 38% of the statewide vote and a 50-point Democratic margin — but they are comparable. The movement in the 5 key Twin Cities counties has made that half of the vote much bluer in 2020 than it was in 2012 — a 30-point Democratic margin for Biden compared to 19 for Obama.
Meanwhile, the rest of the state has indeed moved right, collectively: The roughly 13-point Republican improvement in margin is effectively the same as Wisconsin’s change in its half of smaller counties, and the overall Republican margin in Minnesota’s bottom half counties was actually a couple points better in 2020 than Wisconsin’s. But the Twin Cities are just bluer than the collection of Wisconsin counties that make up its heaviest-voting areas.
The net result of these changes is that Minnesota’s overall statewide margin was very similar in 2012 and 2020, with Democrats winning the state by 7.7 points in 2012 and 7.1 in 2020. (Trump did come within 1.5 points of carrying Minnesota in 2016, but the full weight of Trump-era realignment stabilized Democratic performance in 2020.)
OHIO
Map 6: Ohio top half counties
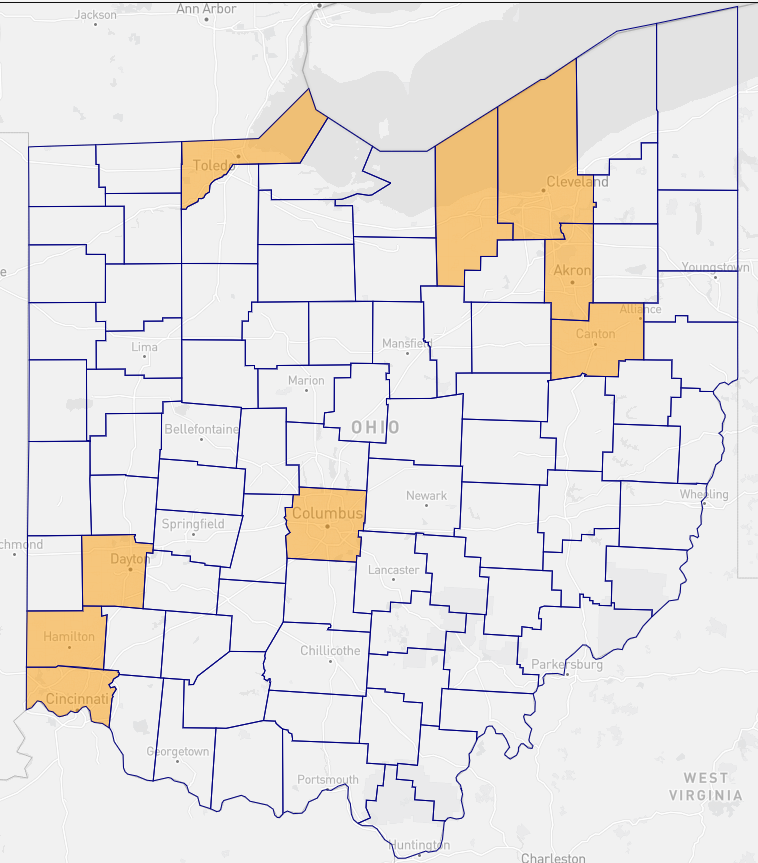
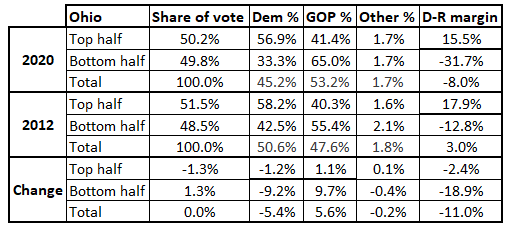
Table 6: Ohio presidential voting, 2020 vs. 2012
Top half: The “3 Cs” big city counties — Cuyahoga (Cleveland) in the northeast, Franklin (Columbus) in the center of the state, and Hamilton (Cincinnati) in the southwest — cast a little less than 30% of the statewide vote. The other pieces of this group are Lorain and Summit (Akron), located to Cleveland’s west and south, respectively; Stark (Canton), south of Summit; Lucas (Toledo) in the northwest; and Montgomery (Dayton) and Butler (suburban/exurban Cincinnati, plus Miami University) in the southwest. Romney only won Butler; Trump added Lorain and Stark.
Bottom half: The remaining 79 other counties include the red suburban/exurban collar counties around the big urban centers not previously mentioned, as well as Obama-to-Trump bastions like Mahoning (Youngstown) and Trumbull (Warren) in northeast Ohio on the Pennsylvania border. Obama won 9 of these counties, while Biden won just 1: little Athens in the southeast, home to my alma mater, Ohio University (and even then, Biden’s 15-point margin was 20 points less than Obama’s).
Collectively, Biden held up OK in the half of bigger counties, running only about 2.5 points in margin behind Obama. That’s largely because Franklin and Hamilton are getting bluer even as the others are not as blue as they used to be — or even flipped to Trump, like Lorain and Stark in Northeast Ohio. At one time, Stark was seen as a bellwether county: Perhaps no single county in the whole country got as much attention as it did during the 2004 presidential election (and John Kerry actually carried it even as George W. Bush was winning the state and the election). But Trump won Stark by about 19 points.
Meanwhile, Trump won the bottom half of Ohio by 32 points, just a couple points shy of Indiana’s tally and a margin much larger than that in Michigan, Minnesota, and Wisconsin. Iowa and Ohio have both moved clearly right of center because those states’ smaller counties have zoomed right while the big ones, collectively, have also gotten a little less Democratic, too.
WISCONSIN
Map 7: Wisconsin top half counties
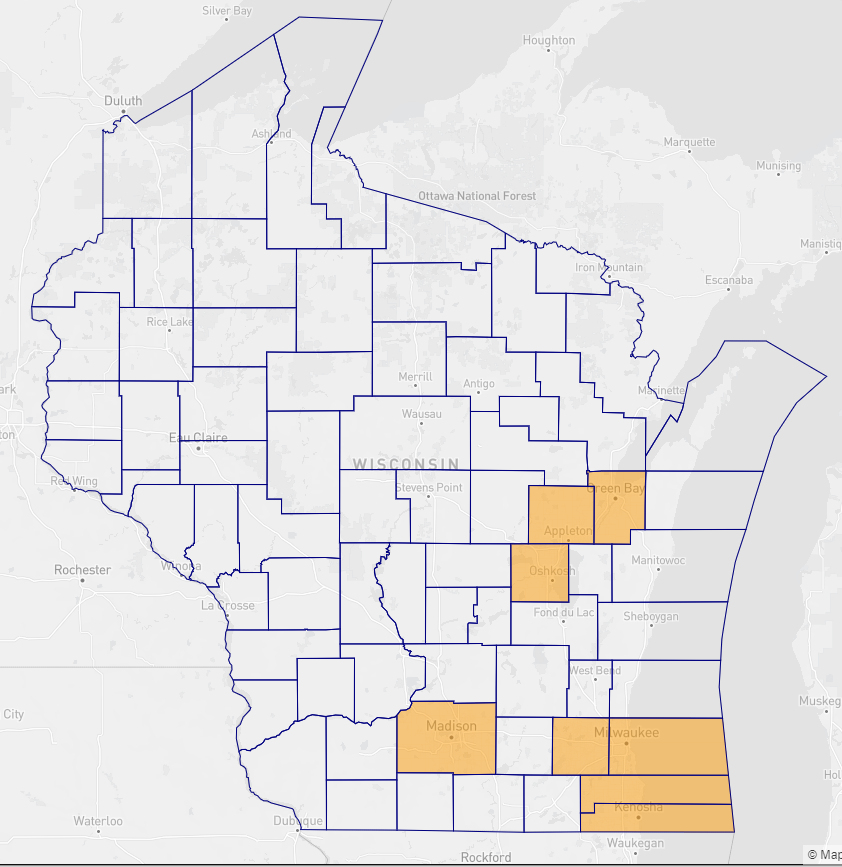
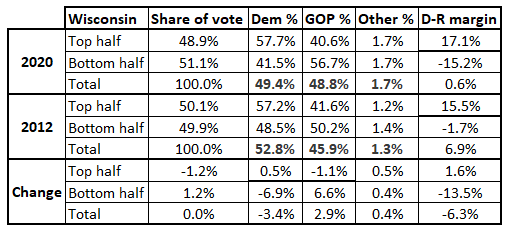
Table 7: Wisconsin presidential voting, 2020 vs. 2012
Top half: Milwaukee and Dane (Madison) together cast a quarter of the statewide vote. Joining them are a few counties in Milwaukee’s orbit: Waukesha, a suburban county directly west of Milwaukee, and Racine and Kenosha directly south. The other 3 counties in this group are Brown (Green Bay), Outagamie (Appleton), and Winnebago (Oshkosh), 3 adjacent counties in central/eastern Wisconsin sometimes called the “BOW” counties. Biden carried only Milwaukee and Dane, although many are competitive (Obama carried Kenosha, Racine, and Winnebago as well).
Bottom half: This group has 64 of Wisconsin’s 72 counties. Obama won 30 of these counties, while Biden won only 12. There are some Democratic-leaning counties in this group, such as La Crosse and Eau Claire, although the biggest single source of votes in this group (albeit casting just about 2.5% of the statewide vote) is Washington County, the reddest of the so-called “WOW” suburban counties around Milwaukee (the others are the aforementioned Waukesha west of Milwaukee and Ozaukee north of Milwaukee — the Republican margin in each dropped double digits from 2012 to 20202, while it only fell a couple of points in Washington).
The story in Wisconsin takes from both the pro-Democratic and pro-Republican trends seen in other states. Democrats actually did a little bit better in the top half in 2020 than in 2012, making Wisconsin similar (at least in terms of direction) to Illinois and Minnesota. However, the Wisconsin top half is still considerably less Democratic than the top halves of those bluer states. Meanwhile, Republicans did make big gains in the bottom half, although the gains were not as big as those seen in redder Iowa and Ohio.
Milwaukee has gotten a little bluer in terms of margin, but it also is the only county in the state that saw its total votes cast decline from 2012 to 2020, likely both because of the county’s falling population and also reduced Black turnout from the very high levels of the Obama era (Cleveland’s Cuyahoga County is experiencing something similar, but the difference is that Cuyahoga’s Democratic margin of victory got smaller, too, from 2012 to 2020). In 2020, the closer-in suburbs actually cast 7,000 more votes than they did in 2012, but that was more than offset by the 40,000-vote drop in the city itself over the same period. That Milwaukee dynamic helps explain why the top half counties cast a slightly larger share of the vote in 2012 than they did in 2020.
Dane, meanwhile, has explosive growth and is getting more Democratic, to the point where it actually produced a bigger percentage margin for Democrats than Chicago’s Cook County did in 2020. But Dane only casts about 10% of the statewide vote, making it far less impactful in Wisconsin than Cook is in Illinois.
A little bit more erosion for Democrats in the bottom half would likely doom them in Wisconsin — however, it’s not clear that will happen, as Democrats held up OK there in 2022 as they held the governorship and came close to unseating Sen. Ron Johnson (R-WI). For more on Wisconsin, see my colleague J. Miles Coleman’s state Supreme Court race preview, which we published yesterday.
Conclusion
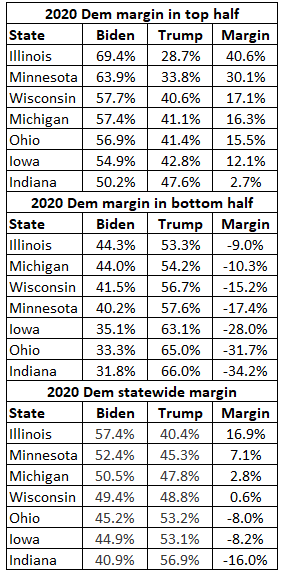
Table 8 lists the 2020 results in each of these 7 states, essentially summarizing the tables from above.
Table 8: 2020 Midwest results
Some takeaways:
— Illinois has both the most Democratic top and bottom halves, explaining its position as the most Democratic state in the region. The presence of several populous Democratic-trending Chicago collar counties in the “bottom half” is a big reason why. Likewise, Indiana has the reddest halves in both categories, explaining its position as the most Republican state in the region.
— Minnesota’s bottom half is actually redder than Michigan’s and Wisconsin’s, but the Twin Cities metro sets the political tempo for the state and has zoomed left over the past decade.
— While its top half is way less Democratic, Michigan’s bottom half is comparable to that of Illinois, in part because Michigan’s bottom half contains some significant Democratic vote centers, like Ann Arbor and Lansing.
— Ohio’s top half is fairly similar to Michigan’s and Wisconsin’s, but its bottom half is way redder — more Republican even than Iowa’s, which also has moved quickly right over the past decade.