| Dear Readers: Our new Sabato’s Crystal Ball: America Votes webinar is now available on YouTube and on our YouTube channel, UVACFP. We discuss the latest in the pivotal Georgia Senate runoffs and hear from Greg Bluestein of the Atlanta Journal-Constitution, who is covering those races as closely as anyone.
Our webinars are also available as a podcast on Apple, Spotify, and other podcast providers. — The Editors |
KEY POINTS FROM THIS ARTICLE
— Joe Biden did better than Hillary Clinton in the lion’s share of states.
— However, when one takes into account how the states voted relative to the nation, Republicans retain an edge in the Electoral College.
— Despite voting for Biden, key battleground states such as Nevada, Pennsylvania, and Wisconsin all became more Republican relative to the national voting. Biden did solidify a number of the Clinton-won states, though, most notably Minnesota and New Hampshire.
The 21st century’s Electoral College trends
In winning the national popular vote by about 4.5 points, President-elect Joe Biden improved on Hillary Clinton’s two-point victory by about 2.5 points. In so doing, Biden also won the Electoral College 306-232, a reversal of President Donald Trump’s victory four years ago.
With almost all state results certified, Biden improved on Clinton’s two-party share of the vote in 44 of 50 states (44 of 51 if one includes the District of Columbia). Table 1 shows the 2016 and 2020 two-party Democratic presidential share — political science research often uses just the two-party share to measure Democratic vs. Republican performance over time as a way of accounting for the different third party share in each election. The two parties are a constant in American politics, while the seriousness of third party candidacies differs from election to election. The total third party share in 2016 was about 6%, but that dropped to roughly 2% in 2020. If you want to figure out the Republican share, just subtract the Democratic share from 100.
The states are listed in order of Biden’s improvement over Clinton.
Table 1: Democratic two-party percentage, 2016 vs. 2020
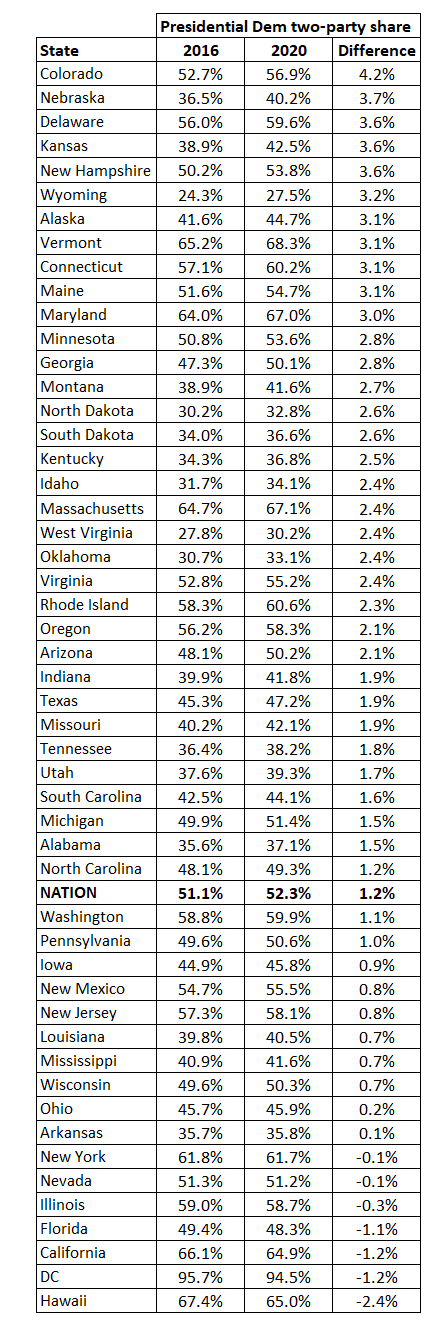
Source: Dave Leip’s Atlas of U.S. Presidential Elections. Results are as of the morning of Tuesday, Dec. 8.
Biden’s biggest improvements came in a mix of blue and red states, with Colorado leading the way. Meanwhile, Trump did a bit better in a few places, with diverse, blue Hawaii his best overperformance from 2016. This is perhaps a reflection of some of Trump’s improvements with nonwhite voters (Hawaii has the biggest nonwhite population share of any state in the Union). Trump also did markedly better in Florida, where Democratic support in diverse South Florida took a major nosedive. He also stood his ground in Nevada, another diverse, competitive state where Democrats have had a small edge in recent years.
Remember, Biden did about 2.5 points better nationally than Clinton did, so that means a state that voted essentially the same in both elections, like Nevada, actually became redder relative to the nation. So too did the crucial states of Pennsylvania and Wisconsin, even though they both flipped from Trump 2016 to Biden 2020.
What follows is a regional examination of how all 50 states have voted for president relative to the nation in the six elections from 2000 to 2020. This is an updated version of a piece we first published in 2019, and it builds on research that I did for my 2016 book on Ohio’s presidential voting history, The Bellwether.
In order to show how states vote compared to the nation, we’re using a statistic that we’ve dubbed presidential deviation. To calculate this metric, take the state-level Democratic two-party vote share in a given state in a given year and subtract it from the national Democratic vote share. A positive number means the state was more Republican in that election; a negative number means it was more Democratic. The deviation is rounded to the nearest integer.
Let’s use our home state, Virginia, as a way to illustrate the calculation. This shows the state’s trend over the last four elections:
2008: The Democratic presidential candidate, Barack Obama, won 53.7% of the two-party vote nationally. He won 53.2% in Virginia. 53.7% – 53.2% = 0.5, which rounds up to R +1.
2012: 52.0% nationally – 52.0% in Virginia = 0, so no presidential deviation at all.
2016: 51.1% nationally – 52.8% in Virginia = -1.7, rounding to -2 or D +2 (remember, negative numbers indicate a Democratic lean here, while positive ones represent a Republican lean).
2020: 52.3 nationally – 55.2% in Virginia = -2.9, rounding to -3, or D +3.
So as this makes clear, Virginia has been getting more Democratic relative to the nation over the past several elections.
This statistic is a little different than the commonly-cited Partisan Voter Index, created by our friends at the Cook Political Report. The PVI uses an average of the last two presidential elections to determine the lean in a given district or state. Our presidential deviation calculation only involves how much more Republican or Democratic a state was compared to the nation in a given year. The charts below track the presidential deviation of each of the 50 states over the last six elections. This gives us a sense of how the states vote relative to the nation, and how their positioning has changed or remained the same.
As you look at the charts, keep in mind that the key on the y-axis showing the range of presidential deviations from high positive numbers (most Republican) to high negative (most Democratic) differs from chart to chart, so re-orient yourself as you move from region to region. In any event, the closer any state is to zero in a given year, the closer it was to voting the same way the nation voted in that year. A line that is moving upwards across the six elections indicates a state is getting more Republican relative to the nation; one that moves downward indicates a state is getting more Democratic.
As we did last year, we broke the nation down into 10 regions, and we’ll start in the west and move east.
Chart 1: Presidential deviation of the Pacific states, 2000-2020 (AK, CA, HI, OR, WA)
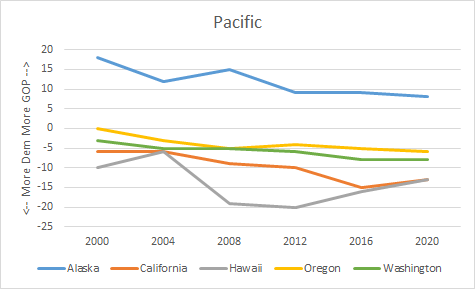
Outside of Alaska, the states that touch the Pacific Ocean are uniformly Democratic, and that did not really change in 2020. California and Hawaii got a little less blue, but Biden still easily won each state. Oregon and Washington remained left of center, although they are more competitive than California and Hawaii. The Last Frontier, Alaska, had its smallest Republican lean since the 1972 election, but Trump still carried it by a little more than 10 points in the two-party vote.
Chart 2: Presidential deviation of the Northern Interior West states, 2000-2020 (ID, MT, ND, SD, WY)
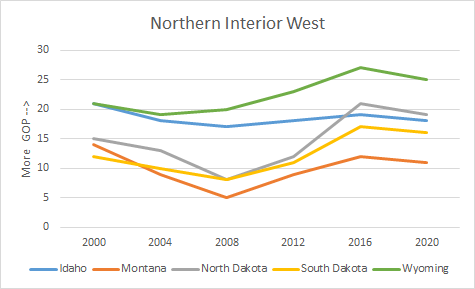
The Northern Interior West is a very Republican region, although these states all became slightly less red relative to the nation in 2020 even as Trump easily carried all of them. Wyoming remained the most Republican state in the nation for the second straight election. Notice that the Dakotas both took big jumps in Republican presidential deviation from 2012 to 2016, and then they stayed in that general vicinity in 2020. That is something we’ll see in other states.
Chart 3: Presidential deviation of the Southwest states, 2000-2020 (AZ, CO, NV, NM, UT)
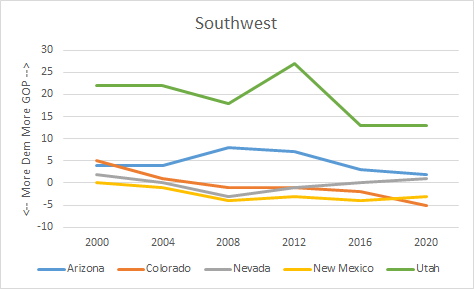
The big story in the Southwest was Arizona, which flipped to Biden narrowly. It also became a bit less Republican compared to the nation, but it’s still right of center. Colorado surpassed New Mexico as the most Democratic state in the region, while Nevada voted a little bit to the right of the nation as its Democratic two-party share hardly budged (Clinton got 51.3% there, Biden got 51.2%). Utah’s deviation was the same in 2016 and 2020 even though, in reality, its vote changed a lot. In 2016, there was a huge third-party vote there as Trump won 45%-27% over Clinton, with Mormon conservative alternative Evan McMullin earning 21% and the remainder going to other candidates. This time, Trump won 57%-37%, with a smaller 5% going to other candidates (that was still the biggest third-party share in the nation). But remember, this calculation ignores the third party vote. We’ll have to see if a non-Trump GOP candidate restores Utah’s previously-larger Republican lean, although 2012 was an outlier because now-Utah Sen. Mitt Romney was on the ballot, and he did great in Utah even by Republican standards.
Chart 4: Presidential deviation of the South Central states, 2000-2020 (AR, LA, OK, TX)
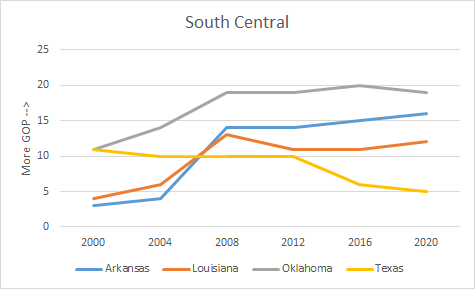
Texas’ drift toward competitiveness continued in 2020, with the state posting its smallest Republican lean since 1988 (when two Texas candidates, Republican presidential nominee George H.W. Bush and Democratic vice presidential nominee Lloyd Bentsen, were on the ballot). But it’s still a clearly right of center state. The other three states in this region are very Republican.
Chart 5: Presidential deviation of the Western Midwest states, 2000-2020 (IA, KS, MN, MO, NE)
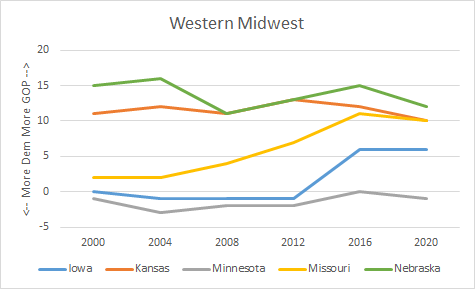
Minnesota returned to voting more Democratic than the nation after it voted slightly more Republican for the first time since 1952, although Minnesota’s Republican deviation was so small four years ago that it rounded to zero. Trump also lost ground in Kansas and Nebraska, which cost him an electoral vote in NE-2, the Omaha-based congressional district that gave its electoral vote to Biden (Maine and Nebraska award some of their electoral votes by congressional district). Trump did slightly worse in Iowa than in 2016, but not enough to change its R +6 presidential deviation, solidifying the Hawkeye State as right of center.
Chart 6: Presidential deviation of the Eastern Midwest states, 2000-2020 (IL, IN, MI, OH, WI)
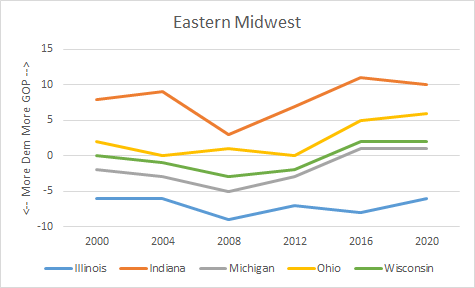
Just like Iowa in the western part of the Midwest, Democrats struck out in Ohio, which got redder relative to the nation as Trump again won it by the same margin as 2016 (roughly eight points in each election). Ohio shed its bellwether label in 2016 and became even less representative of the nation in this election. Biden won Michigan by nearly three points, but that still placed the Wolverine State to the right of the nation. Biden’s improvement in Wisconsin was smaller than his national shift, meaning that even though its R +2 deviation remained the same, the state got slightly redder relative to the nation (remember, there’s rounding going on in these calculations). Illinois remains the most Democratic state in the Midwest.
Chart 7: Presidential deviation of the Greater Appalachian states, 2000-2020 (AL, KY, MS, TN, WV)
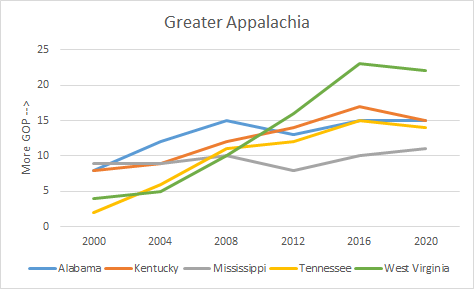
The rightward zoom of some of the Greater Appalachian states stalled in 2020, but that’s only because many of them had moved so far toward the Republicans that there may not be much further for them to go. Of these five states, only Mississippi has not become markedly more Republican over the course of the 21st century, likely because it has the largest share of Black voters of any state, which provides a Democratic counterweight to the very Republican (and significantly larger) white vote. Alabama has a sizable Black share too, but it’s smaller than Mississippi’s, and Alabama has more clearly trended Republican over the last several elections. As a bit of trivia, Tennessee gave Trump his biggest raw vote win of any state this year, surpassing Texas (hats off to my colleague J. Miles Coleman for pointing this out). Two of the other states in this group, Alabama and Kentucky, were third and fourth for Trump in terms of his raw vote margin behind Texas.
Chart 8: Presidential deviation of the South Atlantic states, 2000-2020 (FL, GA, NC, SC, VA)
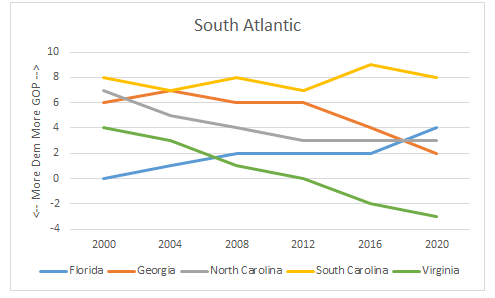
Georgia joined the ranks of the top-tier swing states in 2020, voting more Democratic than both Florida and North Carolina for the first time since 1992, which also was the last time a Democrat carried the Peach State for president. North Carolina has remained persistently more Republican than the nation, posting identical R +3 deviations for the past three elections. Florida had its biggest Republican lean since 1992. As noted above, Virginia continues to move toward the Democrats; South Carolina remained in its familiar place, with a Republican presidential deviation in the high single digits.
Chart 9: Presidential deviation of the Middle Atlantic states, 2000-2020 (DE, MD, NJ, NY, PA)
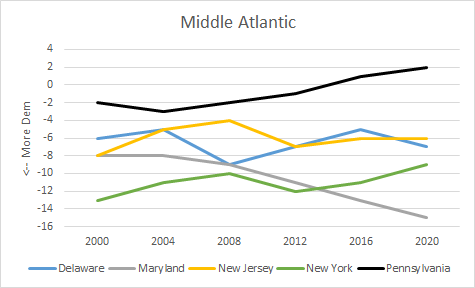
Pennsylvania actually moved from R +1 to R +2 this year, meaning it became more Republican relative to the national voting even as Joe Biden narrowly carried it. The rest of the states in this region are heavily Democratic: Maryland and Biden’s home state of Delaware became more Democratic, while New York became a little less Democratic: Biden made some gains over Clinton upstate but lost a little ground in New York City (which remains overwhelmingly Democratic as a whole). New Jersey retained a D +6 deviation. The District of Columbia would be included in this region, but its D +42 deviation is such an extreme outlier that it would distort the chart.
Chart 10: Presidential deviation of the New England states, 2000-2020 (CT, MA, ME, NH, RI, VT)
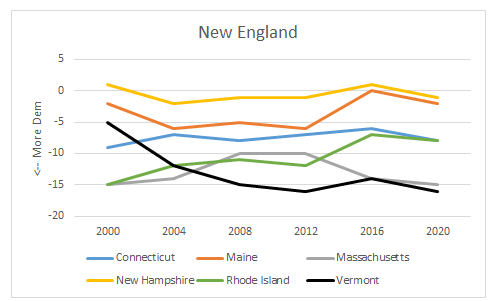
New England is the only region where every state voted more Democratic than the nation; this is a change from 2016 because New Hampshire swung heavily to Biden and voted to the left of the nation after voting to the right in 2020. Biden also improved in every other state in the region, although it was not enough for Biden to win back Maine’s 2nd Congressional District, which stuck with Trump.
Conclusion
Across the 50 states, trends from 2016 either continued or stabilized. Swing states that shifted strongly Republican relative to the nation, like Iowa and Ohio, remained there in 2020. Key industrial North states that switched from Trump to Biden, namely Michigan, Pennsylvania, and Wisconsin, remained right of center relative to the overall results. Nevada is the only Clinton-won state that voted right of center, as Biden performed better in Minnesota and New Hampshire than he did nationally after Clinton lagged in both states four years ago. The two crucial Sun Belt states that voted Democratic for the first time this century, Arizona and Georgia, are trending Democratic but still vote more Republican than the nation.
All told, Republicans still enjoyed an advantage on the 2020 electoral map. While Trump lost 306-232, 311 electoral votes’ worth of states/districts voted more Republican than the nation as a whole, while 227 voted more Democratic.
That’s only slightly different from 2016, when 320 voted more Republican and 218 voted more Democratic. In 2020, Minnesota, New Hampshire, and the NE-2 electoral vote shifted from having a Republican-leaning deviation to a Democratic-leaning deviation, and Nevada went from Democratic-leaning to Republican-leaning.
Biden was able to overcome this Republican lean by building a strong enough national popular vote edge to carry enough electoral votes across the finish line.