| Dear Readers: After the new year, please join us for a special University of Virginia Center for Politics event: “The Shock of Jan. 6,” commemorating the first anniversary of the storming of the U.S. Capitol on Jan. 6, 2021. UVA Center for Politics Director Larry J. Sabato will moderate the event live from the UVA Rotunda’s Dome Room on Thursday, Jan. 6, 2022 from 6 p.m. to 7:45 p.m. Scheduled speakers so far are: Jonathan Karl of ABC News; Jim Acosta of CNN; Center for Politics resident scholars Jamelle Bouie, Chris Krebs, and Tara Setmayer; author Mary Trump; Project Home Fire’s Larry Schack and Mick McWilliams; and Renew America Movement co-founder Miles Taylor. Plan to join us via livestream at https://livestream.com/tavco/theshockofjanuary6th.
This is the latest edition of “Notes on the State of Politics,” which features short updates on elections and politics. We’re delighted to feature the work of one of our Crystal Ball interns in this edition, Makala Gray — she wrote the final item, looking back on last month’s Virginia House of Delegates elections. This is the last edition of the Crystal Ball this year. As always, we appreciate your readership and we wish you and your families a wonderful holiday season. — The Editors |
Assessing redistricting so far: a GOP edge
With Maryland completing their congressional redistricting process last week (more on that state below), 20 of the 44 states with more than one congressional district have completed redistricting. If we add the 6 states with just one district — the states that don’t have to redistrict their congressional lines — there are now a bare majority of states (26) with congressional maps in place for the 2022 election. So where do things stand right now?
These 26 states will have a combined 169 U.S. House seats based on the new census, or about 39% of all the seats. Currently in these states, Republicans have a 96-70 edge. Based on the new apportionment, these states have collectively added 3 net seats, which accounts for the discrepancy between the number of seats these states currently have (166) compared to what they will have under the new census (169).
Based on our Crystal Ball ratings for the new districts in these completed states, we have 99 districts at least leaning to the Republicans, 65 at least leaning to the Democrats, and 5 Toss-ups. One of the Toss-ups is a newly-added seat in Colorado, CO-8; the other 4 are currently Democratic-held seats IA-3, IL-17, ME-2, and NC-1. So one way of looking at this is that the Republicans are up 3 seats in these states, collectively, while the Democrats would have to win all of the Toss-ups just to get to the 70 seats they currently hold in these states.
Table 1 shows our ratings in the completed states so far.
Table 1: Crystal Ball House ratings for states that have completed redistricting
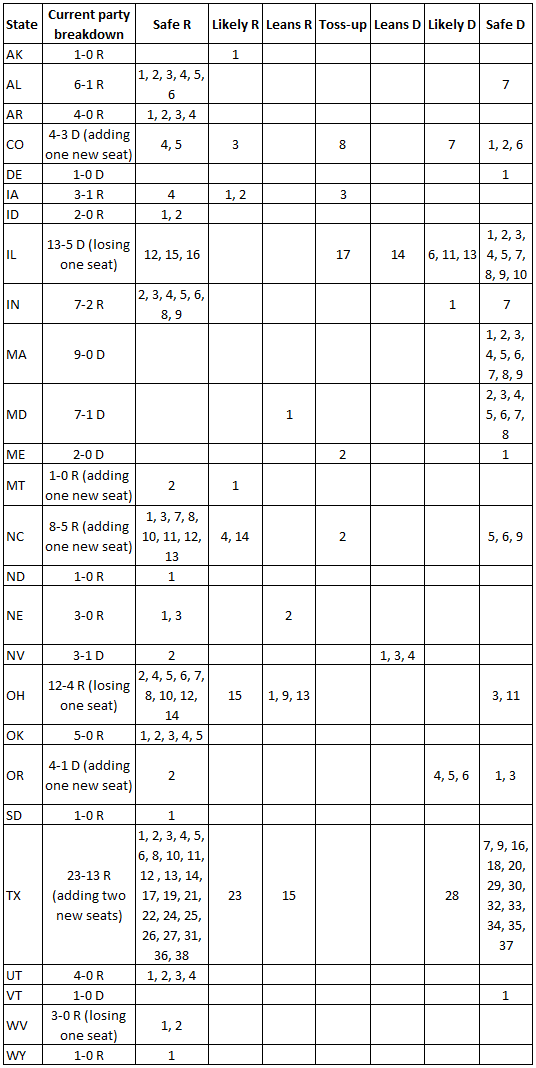
We would not draw any big conclusions so far. For one thing, this is an incomplete picture of the redistricting process — remember, roughly 3/5s of the districts have not been finalized yet. And some of these maps may very well end up being changed as the result of lawsuits: for instance, Democrats are hoping that state courts take the edge off of GOP gerrymanders in North Carolina and Ohio, a couple of big states that contribute greatly to the Republican edge in the completed states so far. But one can see, collectively, an improved Republican position, and the Republicans only need to win 5 more seats than they won in 2020 in order to win the House majority.
Several other states are very close to completing their House maps. Govs. Brian Kemp (R-GA) and Michelle Lujan Grisham (D-NM) have not yet signed as of this writing what are, respectively, Republican and Democratic gerrymanders of their states. Each is designed to give the line-drawing party an extra seat, although the gain for Republicans in Georgia will be easier than the gain for Democrats in New Mexico.
Washington’s state Supreme Court adopted a commission-drawn map that largely preserves the current map there, which is 7-3 Democratic but where Rep. Kim Schrier (D, WA-8) should be in for a close race. The state legislature is now reviewing the map, but legislators don’t have much power to change it.
After the new Virginia commission failed to produce a map, the state’s Supreme Court tasked a pair of outside special masters to create a new map; their draft preserved 7 Joe Biden-won seats in the state — just like on the current map — but they reduced Biden’s winning margin in the Hampton Roads seat held by Rep. Elaine Luria (D, VA-2) from about 5 points to 2, making her swingy seat even swingier. If this maps holds — the process is not yet finished — Democrats will be hard-pressed to maintain their 7-4 edge in the commonwealth’s delegation, and Republicans could even win a 6-5 edge in an optimal scenario.
Commissions in Arizona, California, and Michigan are supposed to wrap up their work soon.
So there will be plenty of redistricting news to cover in the new year, and we will continue to rate and analyze the maps after they are completed — and then revise those ratings and analysis when and if courts intervene.
But our bottom line takeaway so far is that we expected Republicans to benefit, on balance, from redistricting before any maps were drawn, and we still feel that way overall with about 2/5ths of the districts drawn.
New (and cleaner) lines in Maryland, but same 7-1 split likely for 2022
Though Maryland has, on paper, divided government, Democrats hold supermajorities in both chambers of the legislature, which gave them the upper hand in the redistricting process.
After 2010, the Democrats, who then had unified control of the state, sought to increase their advantage in the state’s 8-seat delegation from 6-2 to 7-1. At the time, MD-6, a conservative seat in western Maryland, was redrawn to take in a healthy chunk of suburban Montgomery County, which gives Democrats large majorities. The gerrymander worked as intended for 2012, delivering an additional seat to the Democrats. Although MD-6 nearly reverted to the GOP in 2014, there has otherwise been little general election action since then in Maryland congressional races.
With their hold on the House majority appearing potentially tenuous, state Democrats felt some pressure from their national counterparts to aim even higher: a plan that would shut Republicans entirely out of their delegation was feasible. During the last round of redistricting, then-first-term Rep. Andy Harris (R, MD-1), who holds an Eastern Shore-based district, was strengthened — though he has been reelected comfortably, some adjacent and overwhelmingly Democratic districts could have been unpacked to his detriment.
Meanwhile, Gov. Larry Hogan (R-MD), who has a national reputation as one of his party’s more moderate members, has taken adamant stances against partisan gerrymandering — one look at the tangled lines on his state’s current map helps explain why.
Earlier this year, Hogan established an independent redistricting commission — which did produce some clean maps — but its recommendations were not binding. With that, it wasn’t surprising when Hogan vetoed the legislature’s more partisan plan last week. Almost immediately, legislative Democrats voted to override his veto and enact their plan anyway.
The map that legislators passed is more compact than the current plan — though that is not a very high bar — and it makes reelection harder, but far from impossible, for Harris. Map 1, from state political analyst James Newton, gives the 2020 presidential breakdown by the new lines.
Map 1: 2020 presidential election in Maryland by 2022 districts
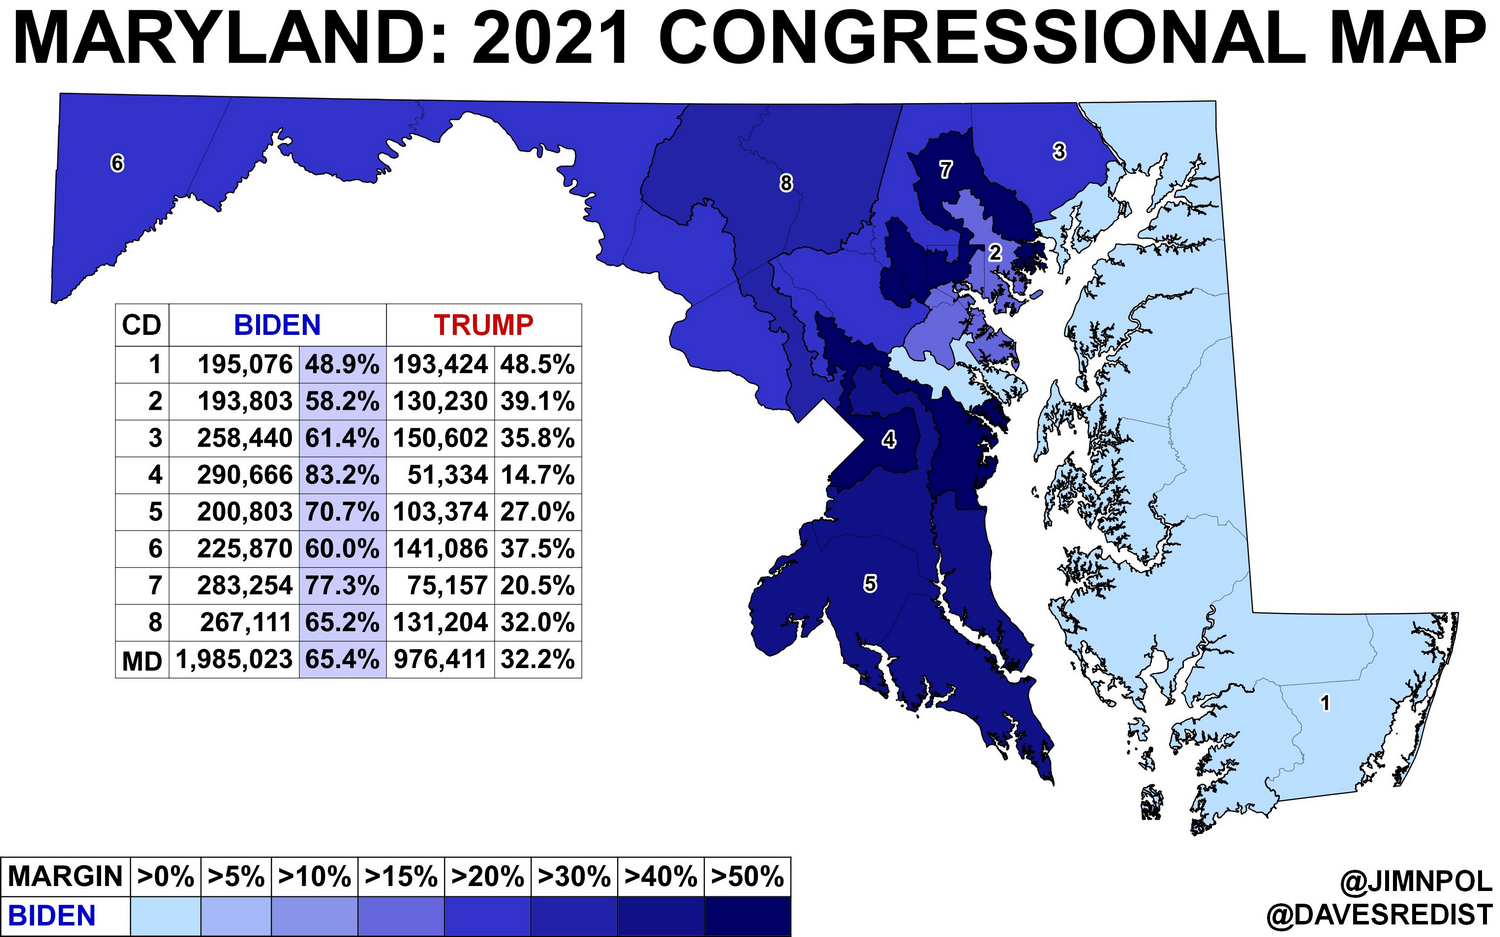
Compared to the outgoing map, MD-1 drops most of its suburban Baltimore precincts and crosses the Chesapeake Bay Bridge to take in parts of the Annapolis area — as a result, Trump’s share drops from 58.5% to 48.5%, while Biden claims a slim plurality in the new district.
While we’ll follow the Democratic primary in MD-1, we’re starting the district off as Leans Republican. Though Harris, a House Freedom Caucus member, has cast some controversial votes during his tenure, the eventual Democratic nominee may not be able to match Biden in what very well could be a less-than-ideal environment next year. In 2016, both Hillary Clinton and now-Sen. Chris Van Hollen (D-MD) would have lost the district by 8 points, which may be a better indicator of MD-1’s partisanship.
Aside from MD-1, there are few drastic changes, at least from a purely partisan perspective. Trump took below 40% of the vote in the 7 Democratic-held seats, though he fared best in Rep. Dutch Ruppersberger’s MD-2, which is now a tidier eastern Baltimore seat. Rep. John Sarbanes (D, MD-3), who has the most grotesquely shaped seat on the outgoing map and has long been mentioned as an eventual statewide candidate, retains voters in both the state’s main metros, Baltimore and Washington D.C.
Districts 4 and 7, the two darkest blue seats, are both majority Black by composition, although MD-5 may elect a Black member later this decade. House Majority Leader Steny Hoyer, who has held the seat since the early Reagan era, will be 83 on Election Day next year — the Black percentage in the district is nudged up to 45%.
Rounding out the map, Reps. David Trone (D, MD-6) and Jamie Raskin (D, MD-8) both have sizable portions of Montgomery County, which should, electorally, overwhelm the further-out counties in their districts. Trone may be somewhat vulnerable if 2022 ends up being a truly smashing cycle for House Republicans, but he has the luxury of being able to self-finance.
Finally, though we are assuming the enacted map will be in place for the midterms, the new lines have prompted litigation spearheaded by the group Fair Maps Maryland. Though a majority of the judges on the state Court of Appeals (Maryland’s state Supreme Court equivalent) were appointed by Hogan, there is no guarantee the high court will intervene. But it is possible that after state courts in North Carolina and Pennsylvania intervened against Republican gerrymanders over the last few cycles, a state court in Maryland could do the same against a Democratic gerrymander now.
New Jersey: Ciattarelli’s coalition
Last month, as the barnburner gubernatorial contest in our home state of Virginia got most of the attention, voters in New Jersey also went to the polls. Though Gov. Phil Murphy (D-NJ) was considered a clear favorite, former Republican state Assemblyman Jack Ciattarelli held him to just a 51%-48% victory.
Considering the lower profile of the New Jersey contest, the close margin there may have been an even better indicator than the Virginia result of the Democratic Party’s weakened standing nationally. In fact, Murphy’s margin represented a 12.7 percentage point decline from Biden’s showing in New Jersey last year — this was a slightly larger pro-GOP swing than Virginia’s, which was almost exactly 12 points.
Conveniently, for the sake of comparison, Ciattarelli got about the same number of raw votes as then-Gov. Chris Christie (R-NJ) did in 2013. Though Christie took over 60% in his reelection bid 8 years ago, Ciattarelli earned only about 24,000 fewer votes statewide. Map 2 compares the raw vote totals that the two Republicans received.
Map 2: Christie 2013 vs Ciattarelli 2021

Some of Ciattarelli’s weakest areas overlap with the Piedmont region. He lost votes in every municipality in Mercer County, where the state capital, Trenton, is located, along with Princeton University. The streak of blue continues north to the state’s New York City suburbs. These areas tend to be either more college-educated or racially diverse. Christie, who saw some of his highest approval ratings during the 2013 campaign season, probably won uncommon crossover support in those areas.
Ciattarelli fared worse in many South Jersey communities that bump up against the Philadelphia metro area. However, there was also bad news for Democrats in South Jersey.
Aside from the close gubernatorial topline, one of the most surprising results out of New Jersey was in the 3rd Legislative District, where state Senate President Steve Sweeney (D) was unseated. Though Sweeney often performed better than other Democrats, his district was an Obama-to-Trump seat. Ciattarelli earned almost 1,000 more votes than Christie in the district (isolated on Map 2), running best in the rural sections — this likely contributed to Sweeney’s narrow loss.
While some of the trends in South Jersey are promising for Republicans, the Jersey Shore may be even more critical to future GOP prospects in the state. Compared to Christie, Ciattarelli gained almost 20,000 votes in Ocean County and about 18,000 more in Monmouth County, immediately to its north — these were by far his largest gains. Both counties have seen an influx of retirees in recent years, something that has pushed comparable areas in other states rightward. Ocean County is home to the state’s fastest-growing municipality, Lakewood, which has a large Orthodox Jewish community. Ciattarelli still gained votes there, but without leaders of the community (which is known for bloc voting) endorsing Murphy earlier this year, he could have easily gained more votes there.
We should note that Murphy earned close to 530,000 more votes than Christie’s 2013 opponent, then-Democratic state Sen. Barbara Buono, which accounted for a 25 percentage point swing in the Democratic direction between the two elections. But with Ciattarelli coming so close to an upset, we thought it was worth seeing where he was able to find new Republican voters.
As we saw in Virginia, Gov.-elect Glenn Youngkin benefited from getting the redder areas of the state to punch above their weight. Ciattarelli’s gains in the rural and coastal parts of New Jersey clearly helped him beat expectations.
The Republicans’ Virginia House of Delegates victory: A closer look
Speaking of Virginia, the 2021 Virginia election saw Republicans not only narrowly win the state’s 3 statewide elected offices, but also take a small majority, 52-48, in the state House of Delegates (the state Senate, where Democrats hold a 21-19 edge, was not on the ballot this year).
Republicans flipped 7 seats in the Virginia House of Delegates. Let’s take a closer look at what happened.
When Democrats won their majority in 2019, they won roughly 54.5% of the total 2-party vote (in other words, just including votes cast for Democratic and Republican candidates who appeared on the ballot), which translated into 55% of the seats in the 100-member chamber (a 55-45 majority). In November, Republicans won 52% of the seats with roughly 52% of the overall vote, meaning that the statewide 2-party vote once again translated to the winning (and losing) party’s share of seats. However, that overall tally is a bit deceptive, because many seats were uncontested in either 2019, 2021, or both. Democrats did not run candidates in 8 seats in 2019, and Republicans left 28 seats uncontested. In 2021, Republicans left just 2 seats uncontested, while Democrats left just 7 uncontested.
Overall, 61 seats were contested by both parties in both elections. In 2019, more than 1.5 million voters cast votes for either a Democratic or Republican candidate in these districts. But, reflecting the higher turnout of what was a very high-participation gubernatorial election year — statewide offices were not on the ballot in 2019 — close to 2.1 million did the same in 2021.
In these 61 districts, Republicans actually won a majority of the 2-party vote even in 2019, 53%-47%, despite losing the majority overall. Their edge in these districts expanded in 2021 to 56%-44%, so they did about 3 points better while Democrats did about 3 points worse.
Understanding the GOP’s House victory can be observed in the 6 districts they won from Democrats that were contested by major party candidates both years. The Democrats won a roughly 4.5-point aggregate edge in these districts in 2019. That reversed to a roughly 3.5-point combined Republican margin in 2021, so Republicans improved in these seats a little bit more than they did in the contested seats as a whole from 2019 to 2021. However, the 6 House Districts that changed hands were all relatively close, with the exception of the 12th District, possibly in part because of a scandal regarding Democratic incumbent Chris Hurst tampering with election signs before the election. Republicans flipped a 7th seat, the 63rd District, but it’s not included with the other because Republicans did not have a nominee there in 2019. Instead, Democratic incumbent Lashrecse Aird defeated independent Larry Haake by close to 11 points. In 2021, Aird lost to Kim Taylor (R) by about 1.5 points.
Table 2 shows what happened in these districts in both 2019 and 2021. District 63 is separated from the other 6 because it lacked a Republican candidate in 2019.
Table 2: 2019 vs. 2021 in GOP-flipped Virginia House of Delegates districts
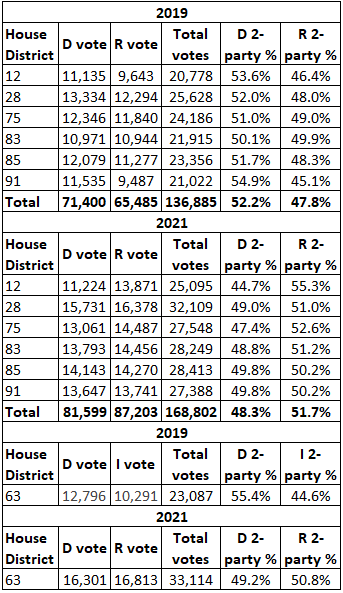
Source: Virginia Department of Elections
In the 6 districts where both parties ran candidates in both years, close to 32,000 more people voted than in 2019. But Democrats only gained about 10,000 votes, collectively, from 2019. Republicans won more than 20,000 votes compared to 2019. This was reminiscent of the gubernatorial race, where Terry McAuliffe, the Democratic nominee, won more raw votes than outgoing Gov. Ralph Northam (D-VA) did in his 2017 victory. But Gov.-elect Glenn Youngkin (R-VA) gained way more votes compared to losing 2017 candidate Ed Gillespie (R).
The data discussed here indicates that Democrats did not necessarily lose voters, they just could not keep up with Republican turnout. In all of the districts that flipped, Democrats gained more votes than in 2019, but Republicans just did this better. This indicates that voter enthusiasm was stronger among Republicans than Democrats.