| Dear Readers: This is the latest edition of the Crystal Ball’s “Notes on the State of Politics,” which features short updates on elections and politics.
This week, we are featuring contributions from two of our stellar Crystal Ball interns: Parakram Karnik notes a couple of tightening polls in the California gubernatorial runoff, and Nishita Ghanate points out some connections between vaccinations rates and 2020 presidential voting both nationally and at the county/city level in Virginia. — The Editors |
Upset in TX-6
In a result that’s being framed as a black eye for Donald Trump, last night in the Dallas area, a (mostly) Republican electorate sided against the former president. Texas’ 6th District became vacant in February, when then-Rep. Ron Wright (R, TX-6), who was just sworn in for a second term, died of COVID-19 complications.
For much of the campaign, the late congressman’s widow, Susan Wright, was a tenuous frontrunner. With the help of a late Trump endorsement, Wright placed first in a May all-party primary, while Republican state Rep. Jake Ellzey claimed second. The candidates met in yesterday’s runoff.
As the runoff campaign wound down, an upset looked increasingly feasible: Ellzey, who was often seen around the district wearing a cowboy hat, emphasized his background as a Naval aviator, and ran an energetic campaign. Ellzey’s efforts paid off, as he won the runoff with just over 53% of the vote. As an aside, considering now-Rep. Mike Garcia’s (R, CA-25) win last year, this has been a good stretch for former Navy pilots running in special elections.
Three years ago, Ellzey came up short in his first bid for Congress: the late Rep. Wright defeated him 52%-48% in a Republican runoff. Wright ran up the score in his home Tarrant County (TX-6’s most populous county), while Ellzey, who represents Ellis County in the legislature, did well there, and in Navarro County. Given the similar circumstances, it seemed that yesterday’s election would fall along those geographic lines. But that wasn’t entirely the case.
As with 2018, Ellzey ran best in Ellis County, but as Map 1 shows, he did considerably better in Tarrant County this time. Though Trump’s support was obviously not sufficient, it still may have helped Wright in rural quarters of the district, as she picked up Navarro County.
Map 1: TX-6 runoffs, 2018 vs 2021
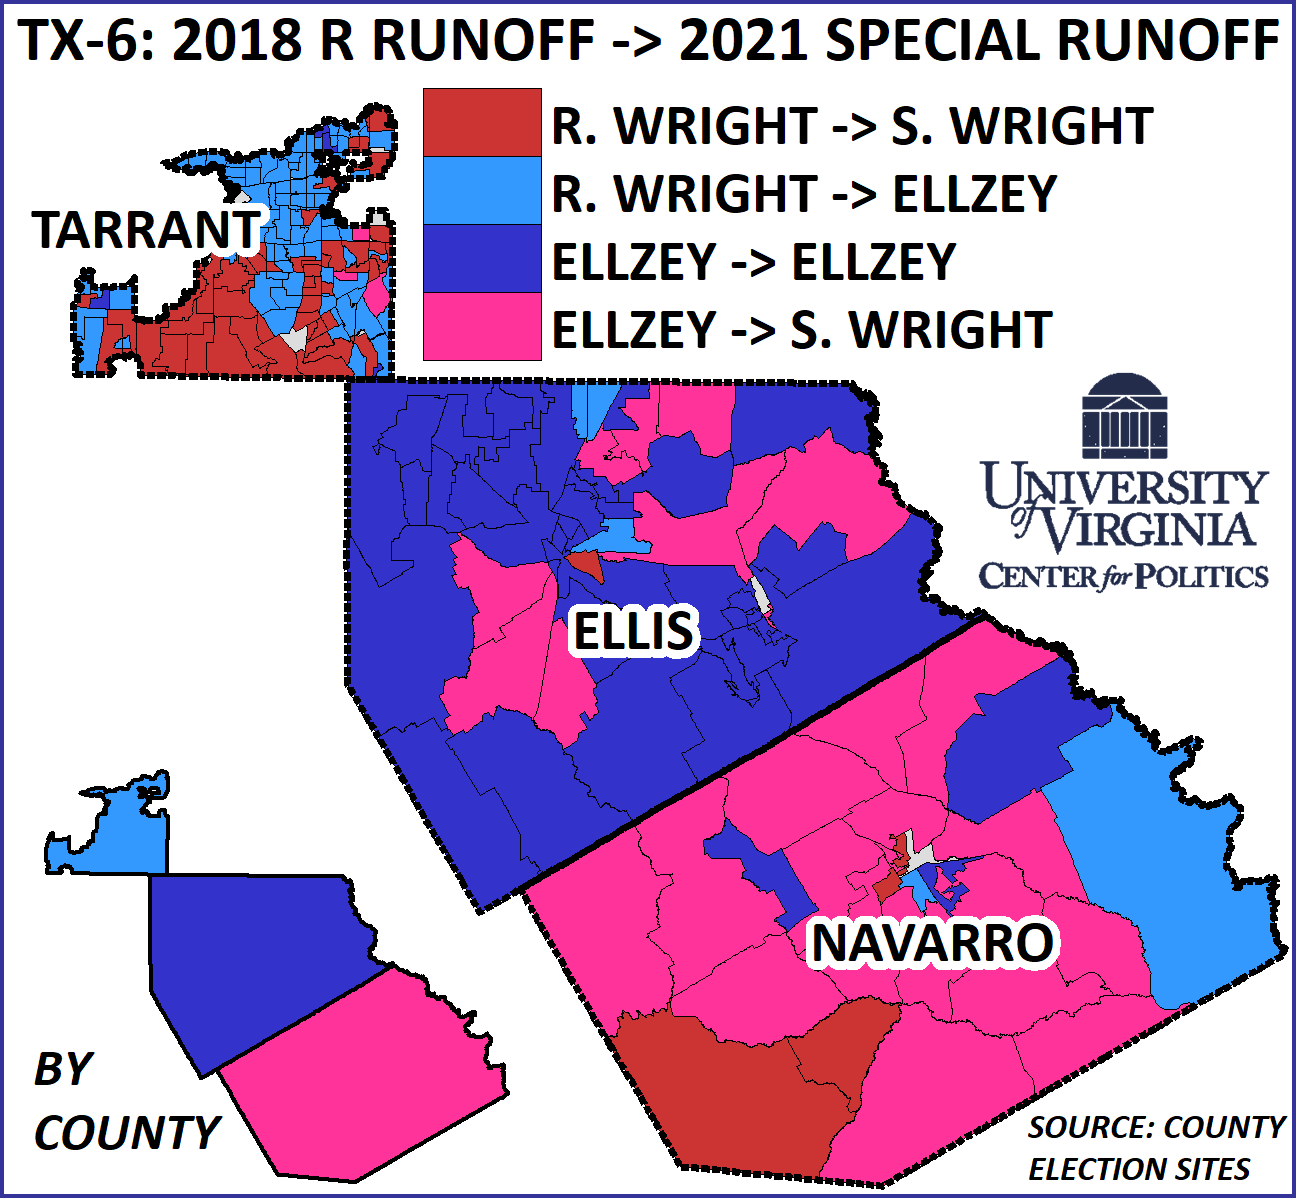
Limiting our analysis to Tarrant County, the light blue precincts that Ellzey picked up supported President Biden by a 56%-42% spread in last year’s general election. The red precincts that stuck with Wright supported Biden as well, but by a slimmer 52%-47%. So while this suggests Democratic voters broke to Ellzey, turnout was especially low in most of Biden’s best precincts. In fact, across the board, turnout was extremely low, even by special election standards.
Just about 40,000 votes were cast yesterday, or just about 12% of the 340,000 cast in the TX-6 regular election last fall. Granted, no one should expect a special election turnout to come anywhere close to a general election turnout, particularly a very high-turnout election like 2020’s was. But this was still low. By comparison, a recent special election in NM-1 won by a Democrat over a Republican had about 130,000 votes cast, or about 41% of the 320,000 votes cast last November. That this was a Republican vs. Republican contest surely dissuaded a lot of voters from coming out — turnout was about double for the first round of voting, when Wright and Ellzey advanced to the runoff from a crowded field. So beware of drawing any major conclusions from it — although it does seem fair to say that Trump’s involvement in the race didn’t spur much participation.
While it may be too early to write off the significance of Trump’s endorsement in Republican contests, next week’s contest in Ohio’s 15th District will represent another test of the former president’s clout. In that Buckeye State race, Trump has endorsed former lobbyist Mike Carey, who is in a crowded primary field, which also includes several current and former state legislators.
Though he didn’t have the former president’s backing, Ellzey is not anti-Trump. Big-name Republicans, such as Rep. Dan Crenshaw (R, TX-2) and former Gov. Rick Perry (R-TX), endorsed him, so we can expect him to be a reliable party vote in Congress. Once Ellzey is sworn in, Democrats will hold 220 seats to the Republicans’ 212.
Polling shows tightening California Recall
A recent poll by Emerson College in collaboration with Nexstar Media shows that Gov. Gavin Newsom (D-CA) may have a larger issue than he may have thought when it comes to defeating his recall effort. It shows that 43% of California voters support a recall effort, while 48% oppose, with 9% undecided. On Tuesday, another poll, this time from the UC Berkeley Institute of Governmental Studies poll co-sponsored by the Los Angeles Times, found 47% support for the recall, with 50% opposed.
The recall is Tuesday, Sept. 14.
In the Emerson poll, the recall is supported by independents (54% support) and Hispanics (48% support, 44% oppose). On four key issues (COVID, wildfires, droughts, homelessness), pluralities of voters consider Newsom’s responses to be poor, including a 52% majority on homelessness. That said, Newsom still has the support of Black Californians (70%) and voters who hold a college degree (56%), as well as the backing of his native Bay Area (58%). In addition, his approval rating sits at 49%, which is not a bad place to be before an election. However, these two recent polls are disappointing for Newsom when compared to the other most recent nonpartisan poll, conducted by the Public Policy Institute of California (PPIC) in May, which suggested that 57% would vote against a recall.
California recall ballots have two questions on them. The first asks whether a voter would like to see the incumbent governor recalled. This one simply demands a yes-or-no answer. If the “No” side wins a majority of the vote, Newsom gets to stay in office. However, the second question seeks to provide an answer for the next step if “Yes” wins in question one: voters select, from a list of candidates, the person they wish to see become governor in the event Newsom must step down. If “Yes” from the first question wins a majority, the candidate from the second question with the most votes becomes the next governor of California.
Will Newsom lose his job? Those who argue yes often point to historical precedent. The most famous California recall in recent history was in 2003, where Democratic Gov. Gray Davis was successfully recalled and replaced with famous actor and Republican Arnold Schwarzenegger. The unpopular Democrat presided over an economic downturn, an energy crisis, and a surging deficit; one poll found his approval rating at just 24%. On Election Day, 55% of Californians voted to remove Davis from office. Meanwhile, Schwarzenegger received 48.6% of the votes on the second question, granting him a plurality and the keys to the governor’s mansion. He was reelected to a full term in 2006. Some believe that Newsom is in a similar spot to Davis. Earlier this year, Schwarzenegger told Politico’s Carla Marinucci, “It’s pretty much the same atmosphere today as it was then. There was dissatisfaction, to the highest level. And it’s the same with the momentum. Something that sets it off to a higher level, kind of the straw that breaks the camel’s back … like an explosion.”
On the other hand, many argue that there are stark differences between 2003 and 2021. In 2004, around the time of the Davis recall, Republicans won 44% of the vote in the presidential election and the party was more competitive down the ballot. By 2020, the Republican presidential share had fallen to 34%. While it should be noted that Republican turnout may be disproportionately higher in a recall against a Democrat, the GOP is starting at a much lower floor than it was in 2003. Of course, there is a chance that some Democrats may vote for the recall for their own reasons; their vote is not necessarily pledged to Newsom, whose party label won’t actually appear on the ballot. Or Democrats may just disproportionately skip the vote, imperiling Newsom. In the UC Berkeley poll, Newsom does significantly better with the larger pool of registered voters compared to his smaller lead among likely voters, suggesting a Democratic enthusiasm problem that he needs to fix.
Unlike 2003, there is no major Democrat to vote for in the second question. While many Democrats are listed, none hold office, have held office, or are notable in any significant way otherwise. By comparison, Republicans have several more prominent choices. John Cox is a businessman who may have built up name recognition from his previous run against Newsom in 2018. Kevin Faulconer is the former mayor of San Diego, and may perform better in the southern part of the state. Caitlyn Jenner, the reality television star and former Olympic athlete, has also thrown her hat in the race. But for now, political commentator and libertarian talk-show host Larry Elder, who made it to the ballot after a legal dispute almost held him back, leads in the field, with 16% of voters planning to choose him for the second question, according to the Emerson poll (he also leads with 18% in the UC Berkeley poll). A full list of all candidates can be found here.
In summary, Newsom still has the advantage, though it may not be as open-and-shut as could be expected in such a Democratic state like California. While his approval rating and recall numbers could be better, it seems unfair to draw a direct line between Newsom and Gray Davis, as Davis was in a much worse position, and the GOP wasn’t as weak in California back then as it is now. That being said, Newsom must be vigilant, and his best bet is probably to appeal to Democrats through a partisan angle, casting the recall as a partisan effort by the Republicans to remove him. The Crystal Ball currently places the race at Likely Democratic.
Does party affiliation affect vaccination rates?
It is no secret that the COVID-19 pandemic has become increasingly partisan as numerous public safety measures, such as social distancing and mask mandates, have received support from Democrats while often facing intense backlash from Republicans. A Pew Research Poll from February, at a time when it was harder for many Americans to get access to vaccines, found that 96% of Democrats as opposed to 72% of Republicans supported requiring face masks on public transportation and 66% of Democrats supported closing K-12 schools for in-person learning, compared to only 25% of Republicans. But does this party divide extend to the vaccine, the potential solution to the pandemic?
Polls suggest the answer is yes. In May, Gallup found that 46% of Republicans compared to only 6% of Democrats did not plan on getting vaccinated, a 40-point difference. An Associated Press-NORC Center for Public Affairs Research poll from mid-July reported a similar finding: 43% of Republicans said they aren’t vaccinated and probably or definitely won’t get the vaccine, compared to just 10% of Democrats.
We looked at vaccination data and checked if there was any correlation with the 2020 presidential election results. Of the 10 states with the highest rates of people who have gotten at least one dose, all 10 were won by Joe Biden last year. Similarly, of the 10 states with the lowest vaccination rates, nine were won by Trump with the one exception being Georgia, a state Donald Trump lost by less than one percentage point.
Table 1: States with the 10 highest COVID-19 vaccination rates
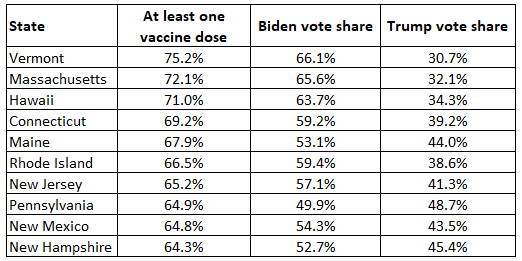
Source: Mayo Clinic, as of late afternoon 7/26
Table 2: States with the 10 lowest COVID-19 vaccination rates
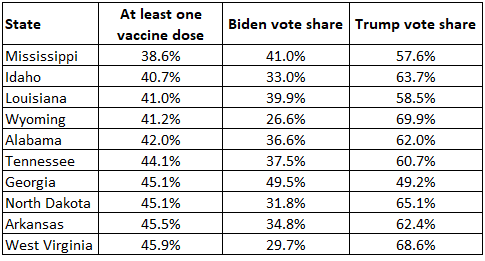
Source: Mayo Clinic, as of late afternoon 7/26
Looking at the aggregate data, the correlation coefficient (a measure on a scale of -1 to 1 determining the strength of a linear relationship between two variables) between vaccination rates and Biden’s vote share by state was 0.806, proving a strong correlation between Biden support and vaccination rates. The correlation between Trump’s vote share and vaccination rates was also very similar, -0.812, which indicates that there is an inverse relationship between Trump’s share of the vote and vaccination rates (Trump doing better was correlated to some extent with vaccination rates being lower).
We also looked at vaccination rates against the presidential results across counties/independent cities in Virginia. Of the 10 counties/cities with the highest vaccination rates, eight were won by Biden, and of the 10 with the lowest vaccination rates, eight were won by Trump. However, the correlation coefficient decreased in strength to 0.406 and -0.413 for Biden’s and Trump’s vote share, respectively. These numbers still indicate a relationship between party identification and vaccination rates; however, it is a significantly weaker relationship than the one seen at the national level. Varying voter turnout rates, third party voting, and larger child populations are all potential reasons the relationship is weaker, but regardless, it is evident that party identification has some influence on the decision to get vaccinated.
Another potential explanation for the weaker relationship also could be lower vaccination rates in places with larger communities of color, whether because of hesitancy to get the vaccine or a lack of access to it. Georgia, a Biden-voting outlier on the state level, has a 32.6% Black population, which is significantly larger than the 13.4% Black population nationally. This may also shed some light on outliers in the Virginia data. For instance, Virginia has a 19.9% Black population as compared to 15.8% for Goochland County — the smaller Black population may provide some indication as to why the county has a higher-than-expected vaccination rate. Prince Edward County and Norfolk city, the two places that voted for Biden but are among the bottom 10 in vaccination rate, are, respectively, 32.8% and 41.1% Black, which may help explain their lower-than-expected vaccination rates. Lancaster County is an outlier with a higher-than-expected vaccination rate but a larger Black population as compared to the rest of Virginia, but the data suggest that governments may need to expand vaccine access among minority communities.
Table 3: Virginia counties/independent cities with highest COVID-19 vaccination rates
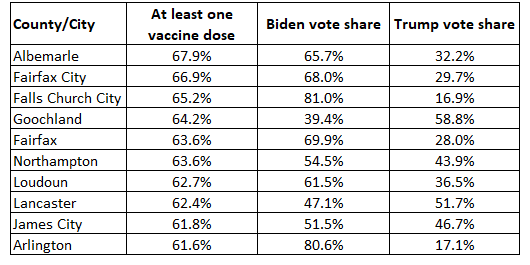
Source: Virginia Department of Health, as of late afternoon, July 26
Table 4: Virginia counties/independent cities with lowest COVID-19 vaccination rates
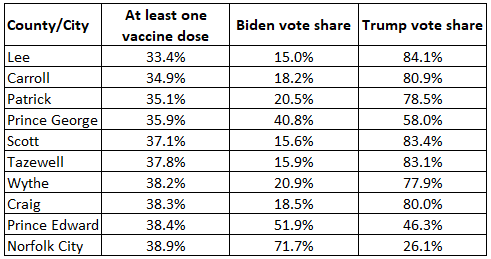
Source: Virginia Department of Health, as of late afternoon, July 26
It is still unknown exactly what percentage of the population needs to be vaccinated in order to reach herd immunity against COVID-19, but only 57% of the population has received even one dose of the vaccine. Compared to the 95% herd immunity vaccination rate required for measles and the 80% required for polio, according to the World Health Organization, we are still a long way away. Unless lawmakers figure out a way to overcome partisan dogma and convince more people to get vaccinated, it seems likely the coronavirus may be a part of our future for a while.