| Dear Readers: Join us Tuesday, Feb. 15 as Center for Politics Director Larry J. Sabato interviews ABC News’ Jonathan Karl about his new book, Betrayal: The Final Act of the Trump Show. The program will run from 7 p.m. to 8 p.m. eastern time, and you can watch live at this link.
See here for more information about the event. – The Editors |
KEY POINTS FROM THIS ARTICLE
— For all 50 states, we looked at 3 variables that are increasingly linked with partisan voting patterns: education level, race, and urbanization.
— When the states are rank-ordered by their composite scores on these 3 measures, the Republican-voting states for the 2020 presidential election cluster on one end of the spectrum, while the Democratic-voting states cluster at the other end, with many battleground states somewhere in the middle.
— In both the top (Republican) and bottom (Democratic) halves of our 1-through-50 list, only 5 out of 25 states broke ranks by voting for the presidential candidate who was at odds with the state’s demographic tendencies. This suggests that these 3 demographic factors have a strong influence on presidential voting behavior.
The 3 demographics that help sort the states
In contemporary politics, demography is destiny. Just how true this has become can be demonstrated by a simple calculation using 3 basic demographic variables.
For all 50 states, we looked at 3 variables that are increasingly linked with partisan voting:
— What percentage of the state’s residents 25 or older have at least a bachelor’s degree?
— What percentage of the state’s residents are white?
— How urban or rural is the state?
Put simply, Republican candidates now perform strongest among white voters without a college degree, especially if they live in rural areas. And Democrats, conversely, are performing best among minority voters, those with at least an undergraduate degree, and those who live in or near urban areas.
To make our calculations, we drew on the most recent education data from the National Center for Education Statistics’ Digest of Education Statistics, the most recent racial data from the U.S. Census Bureau, and FiveThirtyEight’s urbanization index.
For each of these 3 metrics, we ranked the states on a 1-to-50 scale.
Specifically, the state with the lowest percentage of residents 25 or over holding a bachelor’s degree was ranked 1, while the state with the highest percentage holding a bachelor’s degree was ranked 50. For the racial measurement, the whitest state was ranked 1, while the least-white state was ranked 50. For the urban-rural measurement, the least urban state was ranked 1, while the most urban state was ranked 50.
Once we had all 3 rankings in hand, we simply added together the rankings for each state, then rank-ordered that composite score for the states from 1 to 50. The states that ranked closer to 1 offered more friendly demographics for the GOP, while the states closer to 50 offered demographics more friendly to the Democrats.
Spoiler alert: With a handful of exceptions, the top half of the list voted Republican in the 2020 presidential race, while the bottom half of the list voted Democratic.
Let’s take a closer look. Table 1 shows the rankings for the 3 demographic indicators — percentage of residents 25 or older with a bachelor’s degree, percentage of white residents, and urbanization. The column on the far right shows the combined rating. The number in parentheses refers to the ranking of that state when I ran a similar calculation for Governing magazine in 2019; the rankings from 2019 and 2022 are not dramatically different.
Table 1: Ranking of states by certain demographic characteristics
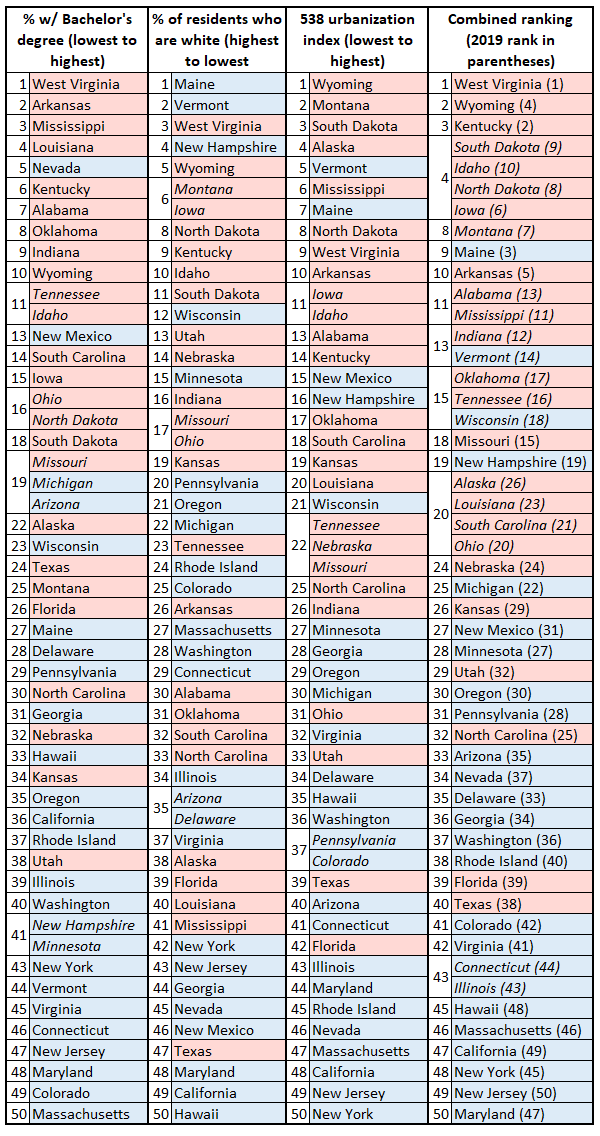
Notes: Parentheses in far right column indicate where the state ranked in the composite ranking back in 2019. Italics indicates when 2 or more states are tied in a certain ranking.
Sources: National Center for Education Statistics’ Digest of Education Statistics; U.S. Census Bureau; FiveThirtyEight urbanization index
It is not surprising that the states at the top and bottom of the composite list are staunchly Republican and Democratic, respectively.
Among the 8 most Republican-friendly states, only one — Iowa — has been won by a Democratic presidential candidate in the last decade. The others — West Virginia, Wyoming, Kentucky, South Dakota, Montana, North Dakota, and Idaho — are rock-ribbed Republican states on the presidential level.
Similarly, the Democrats haven’t come close to losing any of the bottom 8 states on the list in recent presidential elections: Maryland, New Jersey, New York, California, Massachusetts, Illinois, Hawaii, and Connecticut.
And not surprisingly, several of the states around the midpoint of our list have been fiercely contested in recent presidential elections. The list of states between the rankings of 19 and 36 include New Hampshire, Ohio, Michigan, Minnesota, Pennsylvania, North Carolina, Arizona, Nevada, and Georgia. Indeed, our 2019 list featured both Arizona and Georgia in the Democratic half of the rankings, presaging their shift from Trump in 2016 to Biden in 2020.
Naturally, the states that stand out are the 5 that are demographically friendly to the GOP but have voted Democratic, and the 5 that are demographically friendly to Democrats but have voted for the GOP (2 of these, Donald Trump-voting Kansas and Joe Biden-voting Michigan, are right in the middle of the rankings, so they are not really outliers compared to the others we will mention).
Among the 5 Republican-leaning states that have nonetheless voted Democratic for president, 3 of them — Maine, Vermont, and New Hampshire — are located in New England, perhaps the nation’s most liberal region, and they share some similarities.
These states are heavily white and relatively rural, but they score high on the college education ranking. Even the state with the fewest bachelor’s degrees of the 3 — Maine — ranks better on that score than all but 4 Republican-voting states nationally. (The 4 Republican-voting states scoring highest for bachelor’s degrees are North Carolina, Nebraska, Kansas, and Utah.) Meanwhile, New Hampshire and Vermont rank among the top 10 states nationally for bachelor’s degrees.
The other 2 demographically GOP-friendly states that voted for Biden in 2020, Michigan and Wisconsin, backed Trump in 2016 and are part of the historically competitive Midwest.
The flip side involves 5 states that have Democratic-friendly demographics but have voted Republican for president: Utah, Kansas, North Carolina, Florida, and Texas.
Utah is the most eccentric of the group: It’s the Republican state with the highest percentage of bachelor’s degrees, and it’s relatively urbanized. Historically, Utahns have long been staunchly Republican, but Donald Trump’s standing in the state has never been as high as it has been in other, similarly Republican states. Kansas also has deep historical GOP roots but stands out for its relatively high levels of college attainment (it’s also a bit less white and a bit less rural than one might otherwise think). Still, we doubt Utah or Kansas are going to be on Democratic target lists anytime soon.
The other Democratic-friendly states that voted for Trump probably will be: Florida and North Carolina, which have been considered presidential battlegrounds for multiple elections running, and Texas, which became a contested state for president in 2020.
Each of these 3 states has extensive urban and suburban areas with large minority populations and college-educated residents; these areas have voted Democratic, in many cases increasingly so. Yet each of these states has remained an elusive prize for Democrats, due to continuing GOP strength outside of metro areas. In Florida, this Republican lean has been reinforced by a continuing influx of white retirees, as well as residual GOP strength among Cuban-Americans and inroads with other Hispanic voters. The underlying demographics mean that these 3 states should remain Democratic targets in future elections, but Democratic strategists would be advised to keep expectations modest.
One factor that might help explain the outliers here is religion. Church attendance can be an important indicator of how a person votes: according to a post-election survey from the Pew Research Center, voters who attended church at least once a month voted for Donald Trump by a roughly 20-point margin, while those who said they only attended church a few times a year or less backed Joe Biden by a similar, roughly 20-point margin. According to Pew’s 2014 Religious Landscape Study, Florida, Kansas, North Carolina, and Texas, as well as heavily Mormon Utah, all ranked in the upper half for percentage of residents who are “highly religious,” while Wisconsin, Maine, Vermont, and New Hampshire all ranked near the bottom of the list (Michigan was near the middle but in the lower half of states).
All in all, this exercise shows that just 3 carefully chosen demographic factors can explain how 20 of the 25 states in the top and bottom halves of our chart voted in the 2020 presidential election — an 80% accuracy rate. Elections, of course, will still be won by factors such as the political environment, the quality of the candidate, and the sharpness of the candidate’s operation. But these 3 little factors, it appears, can get you a long way to the result.
| Louis Jacobson is a Senior Columnist for Sabato’s Crystal Ball. He is also the senior correspondent at the fact-checking website PolitiFact and is senior author of the Almanac of American Politics 2022. He was senior author of the Almanac’s 2016, 2018, and 2020 editions and a contributing writer for the 2000 and 2004 editions. |