| Dear Readers: Join the UVA Center for Politics this Friday from 3 p.m. to 4 p.m. eastern for a virtual panel, “Crisis in Europe: The Russian Invasion of Ukraine.” Center for Politics resident scholar Chris Krebs, the former director of the Department of Homeland Security’s Cybersecurity and Infrastructure Security Agency, will discuss the latest developments in the conflict between Russia and Ukraine and the response by the United States and its allies with Dr. Alina Polyakova, President and CEO of the Center for European Policy Analysis, and Prof. Jeff Rossman, Director of the UVA Center for Russian, East European, and Eurasian Studies.
You can watch the panel on Friday here. — The Editors |
KEY POINTS FROM THIS ARTICLE
— Based on presidential voting patterns, a much larger proportion of U.S. House districts strongly favor one party and a much smaller proportion are closely divided than 50 years ago.
— However, gerrymandering is not the major reason for this trend. Partisan polarization has increased dramatically in U.S. states and counties, whose boundaries have not changed.
— Moreover, despite the growing partisan divide evident in presidential voting, the competitiveness of House elections has changed very little over the past 5 decades because the personal advantage of incumbency has declined sharply during this period.
Competition in House elections
Congress is dysfunctional, and many political observers believe that gerrymandering is a significant reason why. Gerrymandering — the drawing of U.S. House (and state legislative) district lines by partisan actors to benefit themselves and their party — is seen as contributing to a growing proportion of seats that are safe for one party, and therefore to declining competition in House elections. As a result, this argument goes, members of the House are increasingly concerned with their own party’s primary voters rather than the broader electorate and have little incentive to work with colleagues from the opposing party.
In this article, I examine the impact of redistricting on the competitiveness of House elections over the past 5 decades. I show that, based on presidential voting patterns, the proportion of districts that strongly favor one party or the other has doubled while the proportion that are closely divided has fallen by 50%. However, this long-term decline in the competitiveness of House districts is not primarily a result of redistricting. In fact, the same trend is evident in U.S. states and counties, whose boundaries do not change over time the way congressional districts do.
Despite the growing proportion of districts that strongly favor one party based on presidential voting, the actual margins of House elections have changed very little over the past 50 years, and partisan turnover has fallen only slightly, if at all. The explanation for these contradictory trends is that the personal advantage of incumbency has declined dramatically since the 1980s: The ability of House incumbents to attract votes across party lines and thereby insulate themselves from competition is now much more limited than it was in the 1970s and 1980s.
The evidence
Figure 1 displays the trends in the competitiveness of House districts between 1972 and 2020 based on presidential voting patterns. I classified districts as competitive if the Democratic or Republican share of the major party presidential vote was within 4 points of the national Democratic or Republican vote share in that election. I classified districts as strongly Democratic or strongly Republican if the presidential vote was at least 10 points more Democratic or Republican than that party's national vote share. Districts where the presidential vote was between 4 and 10 points more Democratic or Republican than that party’s national vote share were classified as moderately competitive.
Figure 1: Partisan lean of U.S. House districts based on presidential vote, 1972-2020
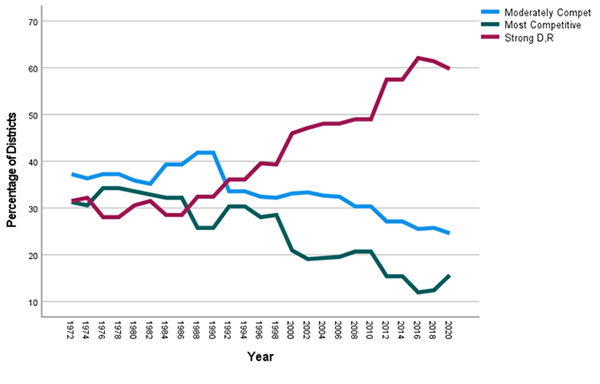
Source: Data provided by Gary Jacobson
The findings displayed in Figure 1 show that the proportion of districts classified as competitive fell from 33% in the 1970s to 14% in the 2010s, while the proportion classified as strongly Republican or Democratic rose from 30% in the 1970s to 60% in the 2010s.
However, redistricting does not explain all, or even most of these trends. While there was a noticeable increase in the proportion of strongly Democratic or Republican districts and a corresponding decrease in the proportion of competitive districts in 2012, immediately following redistricting, there was an even larger increase in one-sided districts and decrease in competitive districts in 2000.
The trend toward increasing partisan sorting of House districts has been going on since the 1980s and reflects a broader trend toward partisan sorting along geographic lines. Author Bill Bishop has documented a similar trend at the county level. In an article published in Sabato's Crystal Ball last week, Rhodes Cook showed that the increasing partisan divide among counties accelerated in the Trump years.
U.S. states are also becoming increasingly divided by party. In 1976, when Jimmy Carter defeated Gerald Ford by about 2 percentage points in the national popular vote, 20 states were decided by a margin of less than 5 points while only 10 states along with the District of Columbia were decided by a margin of 15 points or more. In contrast, in 2020, when Joe Biden defeated Donald Trump by about 4.5 percentage points in the national popular vote, only 8 states were decided by a margin of less than 5 points while 30 states along with the District of Columbia were decided by a margin of 15 points or more.
It is clear from the data in Figure 1 that congressional districts have become far more divided in terms of presidential voting over the past 40 years. The question this raises is what impact this growing divide has had on competition for House seats. To address this question, Table 1 displays the distribution of House elections based on the winning candidate’s margin of victory by decade between the 1970s and the 2010s. For each decade, I also include the number and percentage of uncontested House elections — those in which there was only one major party candidate.
Table 1: Average margin of winning candidate in U.S. House elections by decade
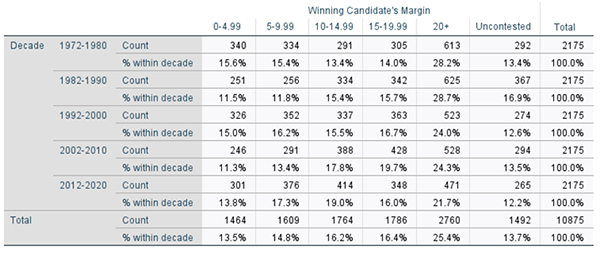
Source: Data Provided by Gary Jacobson
The data displayed in Table 1 show that there has been little change in the competitiveness of House elections since the 1970s. About 14% of House elections were decided by a margin of less than 5 points in the most recent decade — slightly above the average for the previous decade and similar to the average for the past 50 years. Moreover, the percentage of House elections that were uncontested or decided by at least 20 points was actually slightly lower in the last decade than in any of the four prior decades. Even though a larger proportion of House races were contested than in previous decades, the average margin of victory between 2012 and 2020 was 14.3 points, slightly below the average of 15.2 points for the entire 50 years and smaller than the average in any of the previous 4 decades.
Figure 2: Percentage of seats switching party in House elections, 1972-2020
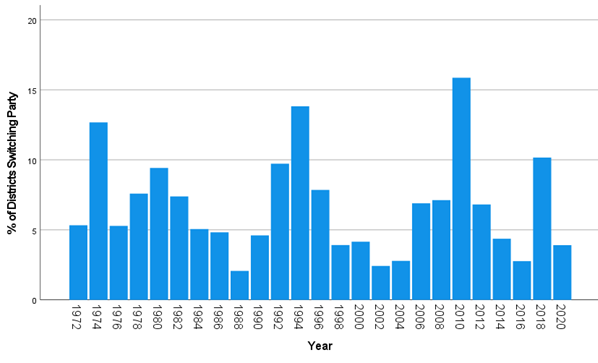
Source: Data provided by Gary Jacobson
Another measure of the competitiveness of House elections is the rate of partisan turnover of House seats. Figure 2 displays the trend in the percentage of districts that switched party control in House elections between 1972 and 2020. The data in this figure show that the rate of partisan turnover is highly variable from election to election: It has varied between 2% and 16% over these 5 decades. Elections with high rates of partisan turnover like 1974, 1994, 2010, and 2018 generally occur when there is also a large swing in party control of seats. Democrats made big gains in 1974 and 2018, while Republicans made big gains in 1994 and 2010. However, there is little evidence of a long-term trend in the rate of partisan turnover throughout this period. The average rate of partisan turnover was 5.6% for elections between 2012 and 2020. That was slightly below the averages of 7.1% for elections between 2002 and 2010 and 7.9% for elections between 1992 and 2000 but slightly above the average of 4.8% for elections between 1982 and 1990. Moreover, because the division of seats between Democrats and Republicans has been closer, there have been more changes in party control of the House in recent decades: 3 between 2002 and 2020 compared with only 1 between 1972 and 2000.
How was it possible for competition for House seats to remain unchanged despite the growing divide in presidential voting among House districts and despite the fact that the outcomes of House elections have become increasingly consistent with the outcomes of presidential voting at the district level? The answer is that something else changed over these 5 decades that largely offset the growing presidential divide — the declining personal advantage of incumbency. During the 1970s and 1980s, House incumbents were able to insulate themselves from competition regardless of the partisan lean of their districts by attracting a substantial amount of support beyond their party's normal vote. As congressional elections expert Gary Jacobson has demonstrated, however, the personal advantage of incumbency has been declining for some time due to growing partisan polarization. Voters are much less willing now to cross party lines to support an incumbent from the opposing party.
Figure 3: Average difference between vote share of House incumbent and adjusted vote share of presidential candidate by decade
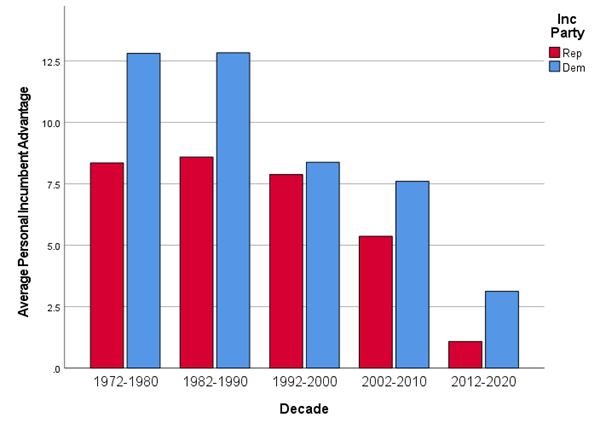
Source: Data provided by Gary Jacobson
Figure 3 displays the trend in the average advantage of incumbency in House elections over the 5 decades between the 1970s and the 2010s. In this case, I have measured the personal advantage of incumbency by the difference between the vote share for House incumbents and the adjusted vote share for their party's presidential candidate in the district. I adjusted the presidential vote share to reflect national trends. These results show that during the 1970s and 1980s, Democratic incumbents ran more than 12 points ahead of the Democratic presidential candidate on average, while Republican incumbents ran about 8 points ahead of the Republican presidential candidate on average. In the most recent decade, however, Democratic incumbents only ran about 3 points ahead of the Democratic presidential candidate on average, while Republican incumbents only ran about 1 point ahead of the Republican presidential candidate.
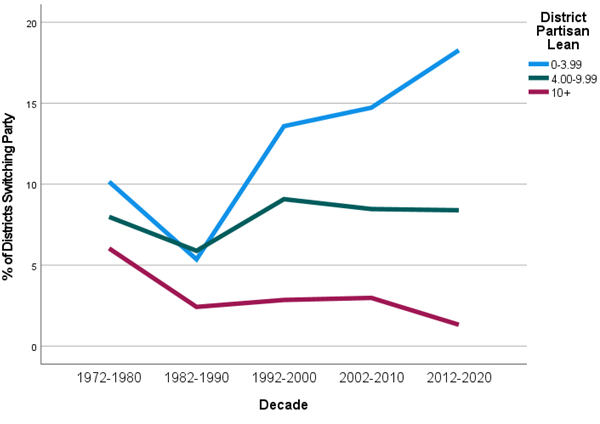
Figure 4: Percentage of districts switching party by partisan lean of district, 1972-80 to 2012-20
Source: Data provided by Gary Jacobson
The declining personal advantage of incumbency has had a dramatic impact on competition in House elections, especially in districts in which the division of the presidential vote is close to the national average. This can be seen in Figure 4, which displays the trends in the rate of partisan turnover of House seats since the 1970s depending on the partisan lean of the district. The data in this figure show that partisan turnover has fallen slightly in the least competitive districts and remained fairly stable in moderately competitive districts. However, partisan turnover has increased sharply in the most competitive districts — those where the division of the presidential vote is closest to the national average. During the 1980s, the rate of turnover in these districts averaged only 5%. During the most recent decade, however, the rate of turnover in these districts averaged close to 18%.
Conclusions and implications for 2022
Based on presidential voting patterns, a much larger proportion of U.S. House districts strongly favor one party, and a much smaller proportion are closely divided than 50 years ago. However, gerrymandering is not the major reason for this trend. Partisan polarization has increased dramatically in U.S. states and counties, whose boundaries have not changed. Moreover, despite the growing partisan divide evident in presidential voting, the competitiveness of House elections has changed very little over the past 5 decades because the personal advantage of incumbency has declined sharply during this period.
The declining ability of incumbents to attract support across party lines means that incumbents in marginal districts — those in which the presidential vote is close to the national average — are now much more vulnerable than they were in the 1970s and 1980s. Incumbents in moderately competitive districts remain somewhat vulnerable as well. Whether that vulnerability turns into actual party turnover depends mainly on the strength of national tides. Large-scale party turnover of House seats tends to occur when there is a strong tide favoring one party. Even if redistricting results in a decline in the number of closely divided districts based on presidential voting, a strong national tide favoring Republicans in 2022 could still result in a large number of seats flipping from Democratic to Republican control. The number of seats switching parties in 2022 and succeeding elections will depend more on the strength of national tides than the number of marginal districts.
 Alan I. Abramowitz is the Alben W. Barkley Professor of Political Science at Emory University and a senior columnist with Sabato’s Crystal Ball. His latest book, The Great Alignment: Race, Party Transformation, and the Rise of Donald Trump, was released in 2018 by Yale University Press. Alan I. Abramowitz is the Alben W. Barkley Professor of Political Science at Emory University and a senior columnist with Sabato’s Crystal Ball. His latest book, The Great Alignment: Race, Party Transformation, and the Rise of Donald Trump, was released in 2018 by Yale University Press. |