| Dear Readers: This is the eighth part of our multi-part series on congressional redistricting. Part One provided a national overview, Part Two covered several small-to-medium-sized states in the Greater South, Part Three looked at four larger states in the South, Part Four considered the West Coast and the Southwest, Part Five swept through a sampling of Great Plains and Heartland states, Part Six surveyed the electorally-critical Great Lakes region, and Part Seven finished the national tour in the Northeast. This week, we’ll conclude with some broader thoughts, though with several states already releasing draft maps, look for more redistricting-related content in the coming months.
— The Editors |
KEY POINTS FROM THIS ARTICLE
— Over the past several weeks, we’ve analyzed redistricting all over the country.
— Overall, our House outlook remains unchanged after this analysis: There are a lot of reasons to like the Republicans’ chances of winning a majority next year.
— All of our 44 full redistricting previews for each state are reprinted below.
Wrapping up our redistricting series
Analyzing redistricting is a time-consuming and detail-oriented endeavor. As we were wrapping up our eight-part series looking at all 44 states that have more than one congressional district, and thus must draw new districts in advance of the 2022 election, we decided to count up all the words we wrote as part of this series. The total was close to 45,000 words, which is the length of a fairly short book. So we salute all of you who read or even skimmed everything we wrote.
As a way of wrapping up our preview, we thought we’d try a minimalist approach after using a maximalist one for the bulk of this series. Below, we’ve tried to sum up the redistricting state of play in every state… in a single sentence.
For those who may have missed part of the series, we also have reproduced all 44 state entries below. In the coming weeks and months, we’ll be analyzing the actual maps and also issuing race ratings for completed states.
There are six states — Alaska, Delaware, North Dakota, South Dakota, Vermont, and Wyoming — that have only one member of the House, and thus won’t need to redistrict. These states are all safe for the incumbent party for the foreseeable future, with the possible exception of Alaska, where Rep. Don Young (R, AK-AL), the Dean of the House, has had some close-ish races in recent years. And while Wyoming is arguably the most Republican state in the country, Rep. Liz Cheney (R, WY-AL) will clearly have spirited primary opposition given her criticism of Donald Trump, assuming she runs for reelection. Our initial 2022 ratings for these single-district states are Safe Democratic in Delaware and Vermont, Safe Republican in North Dakota, South Dakota, and Wyoming, and Likely Republican in Alaska.
With that, let’s quickly summarize our outlook for the other states, and then we’ll offer a few concluding words.
Alabama: (6-1 R currently, no change in number of seats): Barring judicial intervention, Alabama should continue to elect six Republicans and one Democrat to the House.
Arizona (5-4 D, no change): Republicans are happier with the composition of the state’s independent redistricting commission than they were a decade ago, but it’s unclear how the maps will change in this growing state.
Arkansas (4-0 R, no change): Republicans rule the roost here and should continue to enjoy a monopoly in the delegation.
California (42-11 D, losing a seat): The state’s independent redistricting commission needs to eliminate a district, and Democratic-heavy Los Angeles County is the likeliest location of the eliminated district.
Colorado (4-3 D, adding a seat): A new independent commission has already released draft maps, which likely will help Democrats add the state’s new seat.
Connecticut (5-0 D, no change): Don’t expect many big changes.
Florida (16-11 R, adding a seat): Despite state constitutional prohibitions on gerrymandering, Florida Republicans likely will attempt an aggressive gerrymander anyway, and a conservative state Supreme Court may not intervene to stop them.
Georgia (8-6 R, no change): Republicans likely will be able to flip at least one seat through redistricting, though they also must be mindful of rapid demographic change in metro Atlanta that could eventually unwind their pending 2022 gerrymander.
Hawaii (2-0 D, no change): Yawn.
Idaho (2-0 R, no change): Also yawn.
Illinois (13-5 D, losing a seat): Democrats likely will attempt an aggressive gerrymander, with the goal of a durable 14-3 majority in the delegation.
Indiana (7-2 R, no change): Republicans will want to shore up Rep. Victoria Spartz (R, IN-5) in the northern Indianapolis suburbs.
Iowa (3-1 R, no change): The state is known for having a nonpartisan process, but Republicans have the power to pass a plan that would, at minimum, favor their three incumbents.
Kansas (3-1 R, no change): The main focus is on whether Republicans will imperil the delegation’s lone Democrat, Rep. Sharice Davids of KS-3 in the Kansas City area.
Kentucky (5-1 R, no change): Republicans could try to target Rep. John Yarmuth (D, KY-3), but many top Republicans don’t seem to have the desire to do that.
Louisiana (5-1 R, no change): Minimal changes seem likely, though Democrats may pressure Gov. John Bel Edwards (D) to fight for a second Black-majority seat — if he does, he may have to make his case in court.
Maine (2-0 D, no change): The rural 2nd District should get slightly bluer, but it seems poised to host a competitive race next year, regardless.
Maryland (7-1 D, no change): National Democrats would love an 8-0 plan, but state Democrats also could opt to just clean up the contorted lines on the current 7-1 map.
Massachusetts (9-0 D, no change): With all nine seats solidly blue, incumbent preferences will likely inform the changes.
Michigan (7-7 tie, losing a seat): A new independent commission makes the state hard to handicap: Both parties probably will retain at least three or four firm seats, but the commission’s choices in populous Oakland County will be key.
Minnesota (4-4 tie, no changes): As is usually the case in redistricting years, Minnesota has divided government, meaning the process could fall to courts.
Mississippi (3-1 R, no change): Look for Mississippi to retain three solidly GOP seats, as well as a single Black-majority Democratic seat.
Missouri (6-2 R, no change): The overriding objective of Republicans, who control the process, will be to strengthen Rep. Ann Wagner (R, MO-2), though they may also consider going after Rep. Emanuel Cleaver (D, MO-5).
Montana (1-0 R, gaining a seat): Democrats may be competitive in a light red western Montana-based seat, but the state should end up with two Trump-won districts.
Nebraska (3-0 R, no change): If a minimal change map is passed, Rep. Don Bacon (R, NE-2) should retain a Joe Biden-won seat, but he has considerable crossover appeal.
Nevada (3-1 D, no change): Democrats will want to bolster their somewhat shaky 3-1 edge in the delegation — they could unpack the Las Vegas-area NV-1 while leaving NV-2 as the sole red seat.
New Hampshire (2-0 D, no change): While it is hard to draw a Trump-won seat in the Granite State, Rep. Chris Pappas (D, NH-1) seems likely to get a lighter blue seat as a result of the Republican-controlled redistricting process.
New Jersey (10-2 D, no change): Democrats got their preferred tiebreaking member on the bipartisan commission that will draw the lines, but Republicans should still have some credible pickup targets when the dust settles.
New Mexico (2-1 D, no change): While the state recently passed an advisory commission, Democrats could ignore its recommendations to pass a 3-0 plan — but satisfying their incumbents may be tricky.
New York (19-8 D, losing a seat): The Empire State has a new commission system, but Democrats have the power to circumvent it and aim for a gerrymander that could give them as large as a 23-3 edge statewide.
North Carolina (8-5 R, adding a seat): The new NC-14 could be drawn as a red-leaning seat, while the GOP could try to reclaim one — or both — of the seats they coughed up in a court-ordered redistricting last cycle.
Ohio (12-4 R, losing a seat): The state’s new, less partisan redistricting system may — or may not — constrain Republican gerrymandering power.
Oklahoma (5-0 R, no change): With four solid seats, Republicans will want to ensure that Oklahoma City’s OK-5 — which Democrats won in 2018 but lost last year to now-Rep Stephanie Bice (R) — is less prone to flipping in the future.
Oregon (4-1 D, adding a seat): With Republicans having a seat at the table, it is possible that the state will add a GOP-leaning but still competitive seat.
Pennsylvania (9-9 tie, losing a seat): With divided government, the state Supreme Court could be drawing another map, which could eliminate a Republican seat but make one or more Democratic seats more Republican in the process.
Rhode Island (2-0 D, no change): The state somewhat surprisingly kept its second seat in reapportionment, which means Democrats were prevented from losing one of the state’s two safe Democratic seats.
South Carolina (6-1 R, no change): Palmetto State Republicans will focus on shoring up first-term Rep. Nancy Mace (R, SC-1), and they will be aided in doing so by population growth patterns.
Tennessee (7-2 R, no change): Rep. Jim Cooper (D, TN-5) is in major danger of seeing his Nashville-based district dismantled, which wuld allow Republicans to win an 8-1 edge in the delegation.
Texas (23-13 R, adding two seats): At a minimum, Texas Republicans will try to grab the state’s two new seats through gerrymandering, and they very well could do even better than that.
Utah (4-0 R, no change): A new commission does not take the power from the state’s dominant Republicans, who likely will try to shore up first-term Rep. Burgess Owens (R, UT-4) in the state’s only truly competitive district.
Virginia (7-4 D, no change): Democrats are lamenting the creation of a new commission system, which could prevent the shoring up of swing-district Reps. Elaine Luria (D, VA-2) and Abigail Spanberger (D, VA-7) and might even make them more vulnerable to Republican challengers.
Washington (7-3 D, no change): A commission system that has developed a reputation for protecting incumbents will draw the lines.
West Virginia (3-0 R, losing a seat): One of the state’s three Republicans will not be returning to the House in 2023 because of the state’s loss of a seat.
Wisconsin (5-3 R, no change): Divided government could throw redistricting to the state Supreme Court, and without major changes the now-open WI-3 will remain one of the top GOP pickup opportunities in the nation.
Conclusion
So what does this all mean? Well, we don’t feel comfortable making hard-and-fast projections based on maps that have not yet been drawn, and while the redistricting process is important, the maps don’t always determine the winners in the most competitive districts. Also, even if we have guesses as to how states might re-draw the lines, those guesses can feature a combination of direct and indirect redistricting casualties. For instance, the Pennsylvania Supreme Court may draw the Pennsylvania map, which is currently split 9-9 between the two parties. The court might eliminate an underpopulated Republican-held district while also weakening Democrats in a couple of other districts, which could mean Republicans might come out of the state with an edge in the delegation even if two of their members are placed in the same, sprawling rural district.
Still, there is an overall, general assessment we can offer.
We’ve said before that the Republicans were favored to win the House majority next year, both because of redistricting and also because of the usual midterm trend that breaks against the party in the White House, among other factors. Following the completion of this redistricting preview, we have not changed our view on that.
We did our own back-of-the-envelope projections of the House and anticipated some aggressive (but not maximally aggressive) gerrymandering by both Republicans and Democrats, where applicable. We also assumed a somewhat neutral political environment, which very well may not end up being the case – in all likelihood, Joe Biden’s currently net-negative approval rating needs to rebound for there to be even a neutral environment next year as opposed to a Republican-leaning one.
Anyway, we got a GOP net gain of roughly a dozen seats, more than the five-seat improvement they need from the 2020 results to win the House majority. This is a deliberately modest outlook, and Republicans could easily blow past it next year, while there are also scenarios under which Democrats are able to minimize those GOP gains and perhaps even save their majority. But our default expectation has been, and remains, a Republican House takeover next year.
So now we’ll wait and see what the actual maps look like, which will inspire many more words (and maps and tables) to come.
Reprinted below are all 44 full state analyses.
ALABAMA
Number of seats: 7 (no change from 2010s)
Party breakdown in 2012: 6-1 R
Current party breakdown: 6-1 R
Most overpopulated district: AL-5 (Huntsville, Northern Alabama)
Most underpopulated district: AL-7 (Black Belt, Birmingham-Montgomery-Tuscaloosa)
Who controls redistricting: Republicans
2012 control: Republicans
The 2012 Alabama map was perhaps one of the nation’s most understatedly durable gerrymanders. Going into the redistricting process, the Republicans — who had just won control of the state legislature for the first time since Reconstruction — aimed to lock in their gains from 2010. Though the Democrats were down to holding just one of the state’s seven seats, they had held — or made serious attempts at — three other districts during the last decade. Two Republican freshmen were strengthened: then-Rep. Martha Roby (R, AL-2), who had narrowly ousted a Democrat in 2010, saw several Black precincts in Montgomery removed from her Wiregrass-area district, while Rep. Mo Brooks (R, AL-5), up in northern Alabama, lost a few historically Yellow Dog counties (Lawrence and Colbert), and took in more reliably GOP Morgan County. Finally, Rep. Mike Rogers (R, AL-3), who was held to just a 7% win in 2008, relinquished most of his holdings in Montgomery County in favor of picking up heavily GOP St. Clair County.
As a result of the Republican map, and the state’s overall trends, 139 of the 140 congressional races that Alabama saw over the course of the decade ended up as double-digit blowouts, with the one exception being an odd case: in 2016, a Republican write-in candidate took 9% of the vote in AL-2, holding Roby to a 49%-41% win. In the one instance where the state did see a competitive statewide race, the districts behaved just as the GOP mappers would have liked: in the 2017 Senate special election, when now-former Sen. Doug Jones (D-AL) beat Republican Roy Moore, a horribly damaged candidate, Jones took nearly 80% in the Black-majority AL-7, but came up short in every other district — had the previous decade’s map been in place, Jones would have claimed two additional seats.
One dynamic that helped Republicans in 2012, which will probably aid them again, is that the state’s most underpopulated district is the heavily Democratic AL-7. While about three-quarters of the district’s population comes from a trio of urban counties (Jefferson, which contains the city of Birmingham, as well as Montgomery and Tuscaloosa), it includes much of the state’s portion of the Black Belt — and the rural counties there are losing population. So, to pick up population, it seems likely AL-7 will have to expand further into the Birmingham and Montgomery areas, which should help insulate Republicans in adjacent districts.
The state’s quickest-growing district is the northern AL-5, which is now open, as Brooks is running for Senate. Huntsville, the anchor of the district, may actually now be the largest city in the state — its government facilities, specifically the Redstone Arsenal, have drawn high-tech jobs to the area. A quick fix that Republicans may like would be transferring some Democratic precincts in Florence to the neighboring AL-4 — the 4th is now the reddest district in the country based on the 2020 presidential results, and can easily afford to take in bluer turf. Democrats would love for a court to force the drawing of a second majority-Black or Black-voter-influence district, but that does not strike us as particularly likely. Some projections prior to the release of the 2020 census reapportionment numbers suggested that Alabama was likelier than not going to lose a seat, but that did not come to pass; had that happened, Republicans would likely have lost a seat because the Voting Rights Act would have protected Democrats in AL-7.
So this is all to say that, given the population and partisan trends in Alabama, Republicans should have little trouble drawing a similar 6-1 map for the next decade.
ARIZONA
Number of seats: 9 (no change from 2010s)
Party breakdown in 2012: 5-4 D
Current party breakdown: 5-4 D
Most overpopulated district: AZ-5 (Chandler/Gilbert/Mesa)
Most underpopulated district: AZ-2 (Tucson)
Who controls redistricting: Commission
2012 control: Commission
Arizona not gaining a 10th seat was one of the biggest surprises of the 2020 congressional reapportionment. In fact, 2020 marked the first census since the 1950 round that Arizona did not gain at least one seat in Congress — the state’s growth in recent decades has been especially robust, as its population has doubled in the last 30 years, going from 3.7 million residents in 1990 up to about 7.3 million today.
Even with that type of growth, the Arizona map will continue to feature nine congressional districts. While some states have adopted redistricting commissions fairly recently, Arizona’s was established to draw maps immediately after the 2000 census, as voters approved the creation of a commission via a referendum that year. But last decade, the legitimacy of the commission was tested. In 2012, Arizona Republicans were frustrated after the commission-drawn map elected a 5-4 Democratic congressional delegation, even as then-President Obama lost the state by nine points in his reelection bid. Legislative Republicans charged that the commission’s authority was unconstitutional, and took their case to the Supreme Court. But the high court ruled that voters could transfer jurisdiction over redistricting away from legislatures, so the Arizona commission was upheld. Republicans believed that last decade’s tiebreaking member overly helped the Democrats and unsuccessfully tried to have her removed from the commission. This time, the GOP seems happier with the tiebreaker.
Nestled in the southeastern corner of the state, AZ-2 is the only district that currently does not contain any of Maricopa County (home to Phoenix, as well as over 60% of the state’s residents) — it is also the most underpopulated district, and it will need to pick up about 75,000 residents. It seems likely that the district will simply pick up some communities near Tucson, or perhaps expand its holdings in the city itself. Assuming its configuration stays similar, longer-term trends suggest the district will stay Democratic: after Mitt Romney carried it by nearly three percentage points in 2012, President Biden did so by about 11 points.
After last decade’s remap was finalized, many Republican complaints centered on the redrawn AZ-1. This vast rural district includes both the Hopi and the Navajo nations, in the northeastern corner of the state, but for 2012, it dropped much of heavily GOP Yavapai County. Democrats captured the seat in 2008 with then-state Rep. Ann Kirkpatrick. Two years later, Kirkpatrick lost to Republican Paul Gosar by 13,583 votes — Gosar carried Yavapai County by just over 20,000 votes.
As an aside, Kirkpatrick has one of the most interesting career arcs of any current member. For 2012, Gosar moved over to the redrawn AZ-4 (now the most heavily GOP seat in the state), while Kirkpatrick reclaimed the swingier AZ-1. Kirkpatrick, impressively, held on in 2014, then ran unsuccessfully for Senate in 2016 against the late Sen. John McCain (R-AZ). She then moved to a new district herself, winning AZ-2 in 2018 and 2020. She is retiring this cycle.
Though AZ-1 narrowly supported the GOP presidential nominees in 2012 and 2016, Rep. Tom O’Halleran (D, AZ-1) has represented the district since Kirkpatrick vacated it, in 2016. Ironically, last year, as the district finally voted blue at the presidential level, O’Halleran had the closest race of his career — he was held to a three-point win. It would not be hard for the commission to make AZ-1 more Republican-leaning: it could simply take in more of Yavapai County, or reach further into Pinal County, a fast-growing county that has seen sprawl from the Phoenix area.
It seems unlikely that the commission will alter AZ-3, a Hispanic-majority seat held by Rep. Raúl Grijalva (D, AZ-3). The 3rd District forms a triangle, running from Tucson to Yuma, then up to Phoenix. Similarly, it’s hard to see major changes to Democratic Rep. Ruben Gallego’s AZ-7 — it is also heavily Hispanic by composition, but it is a much more compact seat centering on downtown Phoenix.
Elsewhere in Maricopa County, it is hard to game out exactly what the commission will do in the suburban Phoenix seats. Since the state isn’t adding or losing any seats, the commission could take a minimal change approach. In 2020, Democrats targeted Rep. Dave Schweikert (R) in AZ-6, a district that includes much of Scottsdale — he held on 52%-48%, so any similar seat could be swingy. On either side of AZ-6, Reps. Andy Biggs (R, AZ-5) and Debbie Lesko (R, AZ-8) both won by close to 20 points last year, and each would be favored under similar lines (Biggs has been mentioned as a potential statewide candidate in 2022, but any competent Republican could hold his seat).
If the commission prioritizes creating competitive seats, it may unpack AZ-9, giving its Democratic voters to adjacent districts. AZ-9, which sits east of Phoenix and includes communities like Tempe and Mesa, was created for 2012. Initially, it was a true bellwether seat, as it basically matched the national popular vote that year — but in 2020, Biden cleared 60% in the district. Now-Sen. Kyrsten Sinema (D-AZ) was the 9th District’s first representative — when she vacated it to run for Senate in 2018, then-Phoenix Mayor Greg Stanton ran as a Democrat and held the seat by a 61%-39% margin. In fact, the only Republican to ever carry AZ-9 in a statewide race was the late Sen. McCain in his 2016 race against Kirkpatrick.
Map 1 shows an Arizona map with minimal changes, although the marginal AZ-1 flips from a narrow Biden-won seat to a narrow Trump-won seat, while AZ-6 takes in all of Scottsdale and gets slightly more competitive (but is still a Trump-won seat).
Map 1: Hypothetical Arizona map with minimal changes
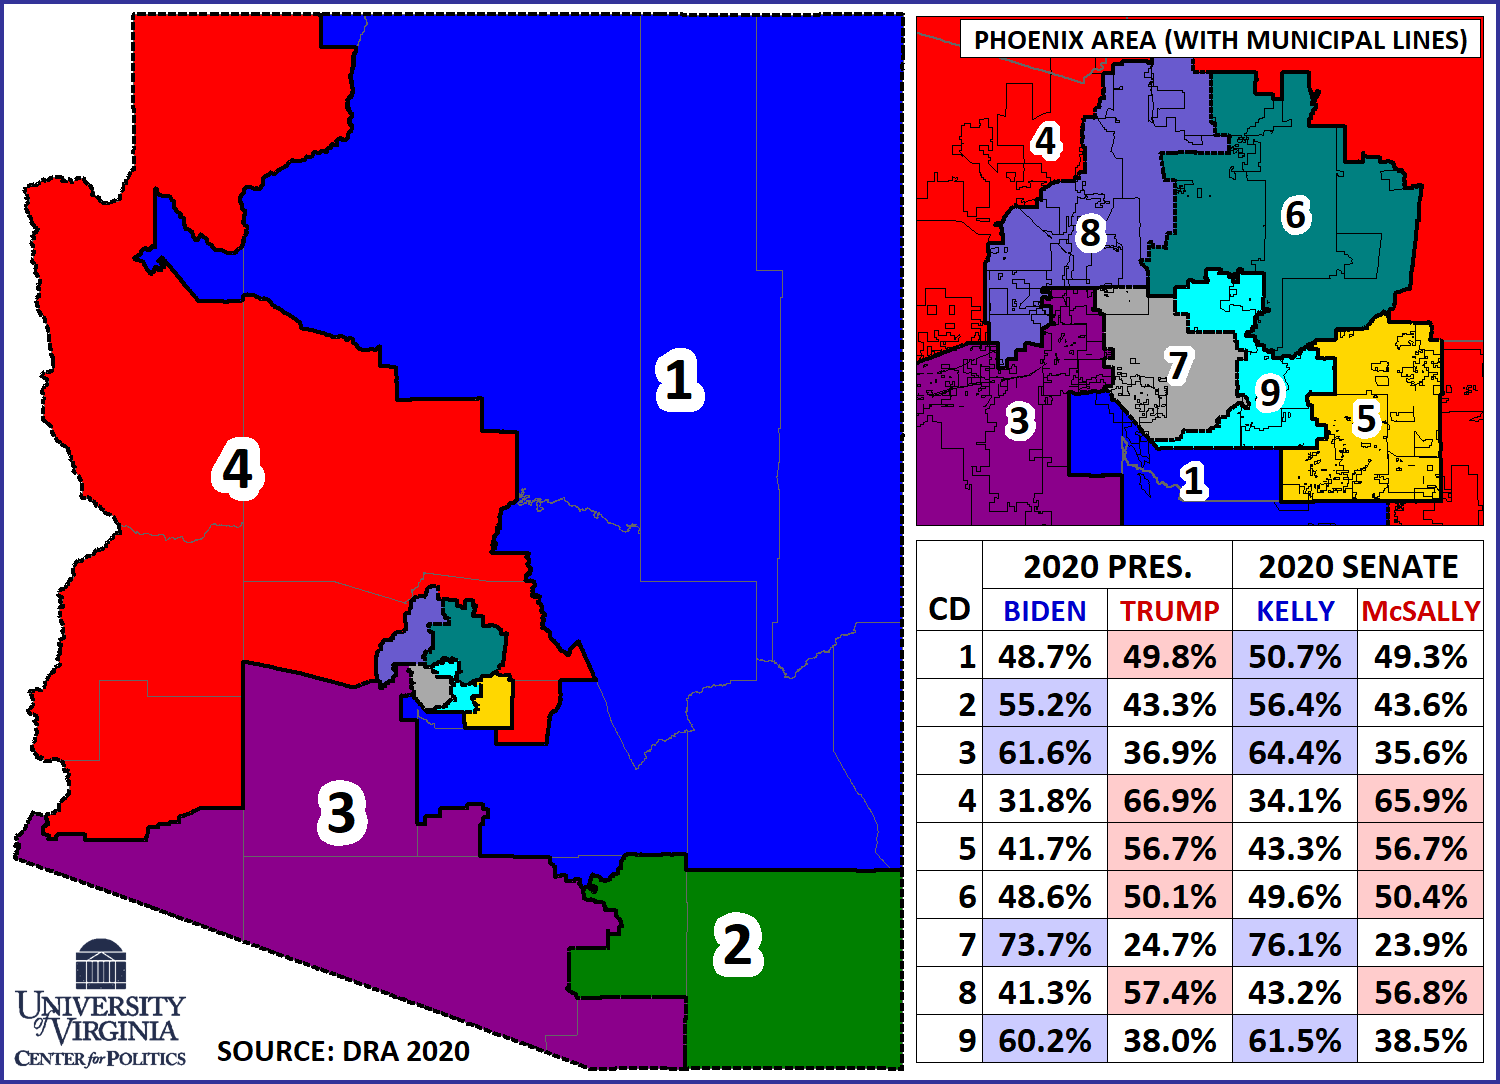
Realistically, Arizona’s next congressional map could lead to anything from a Democratic gain of one seat to a GOP gain of two seats.
ARKANSAS
Number of seats: 4 (no change from 2010s)
Party breakdown in 2012: 4-0 R
Current party breakdown: 4-0 R
Most overpopulated district: AR-3 (Northwest Arkansas)
Most underpopulated district: AR-4 (Southern Arkansas)
Who controls redistricting: Republicans
2012 control: Democrats
Of all the current congressional maps in place, Arkansas’ is probably the closest thing we have to a dummymander. For the first decade of the 2000s, Democrats held three of Arkansas’ four House seats, with the sole Republican, now-Sen. John Boozman (R-AR), representing the ancestrally GOP northwestern corner of the state. Then, ahead of the 2010 election cycle, two entrenched Democrats announced their retirement — in what turned out to be banner GOP year, those seats went on to flip. The good news for Democrats that year was that their third member, then-Rep. Mike Ross (D, AR-4) was not a top GOP target, and, helped by then-Gov. Mike Beebe’s (D-AR) popularity, they kept the legislative trifecta.
As legislative Democrats unveiled drafts of congressional plans in 2011, it was clear that they intended to preserve the basic contours of the existing map, with the goal of winning back a 3-1 advantage in the delegation. The problem, though, was that by then, a pro-Republican trend was obvious, so such a split would likely be unsustainable: in 2008, John McCain improved 10% over George W. Bush’s 2004 showing in Arkansas, with many rural counties shifting 20% or more to McCain. Democrats could have linked Little Rock to some heavily Black counties on the Mississippi Delta, which would have given them one reasonably firm district — with Black residents making up just 16% of the state population, a majority-minority seat is not required in Arkansas. When redrawing AR-4, Democrats deferred to the wishes of Ross, but, in something of an about-face, Ross ended up announcing his retirement.
Democrats ended up passing a plan where all four districts would have still given McCain easy majorities. If the political fault lines of the early 2000s still shaped voting habits, Arkansas would likely still have three Blue Dogs and one Republican in Congress. Instead, the state continued its rightward trek in 2012: The three incumbent Republicans were reelected, and, without Ross’ incumbency, AR-4 flipped red. Republicans also gained control of the state legislature that year, and have since increased their majorities. So now, holding the pen themselves, Arkansas Republicans are in a curious position: given their monopoly on the delegation, preserving something like the current Democratic-drawn map would probably suit them just fine.
The state’s fastest-growing district is AR-3 (where Wal-Mart is headquartered), while Little Rock’s AR-2 also saw growth over the past decade. The two primarily rural districts, AR-1 and AR-4, will have to expand. The shifting border between districts 3 and 4 sums up the state’s population trends well: in 1970, AR-3 stopped just short of the Louisiana border to the south — as the slow-growing 4th has expanded over the past decades, it now comes north, close to the Missouri line.
National Democrats were not the only group frustrated by Arkansas redistricting in 2011 — to the chagrin of political analysts, the legislature departed from tradition in that they split several counties between districts (election breakdowns for whole-county districts are easier to tabulate). Iowa and West Virginia are now the only two states with more than one district to feature whole county districts.
CALIFORNIA
Number of seats: 52 (down 1 from 2010s)
Party breakdown in 2012: 38-15 D
Current party breakdown: 42-11 D
Most overpopulated district: CA-45 (Orange County)
Most underpopulated district: CA-40 (East Los Angeles area)
Who controls redistricting: Commission
2012 control: Commission
The U.S. House of Representatives reached its current-sized voting membership of 435 after the 1910 census, and it has had the same-sized membership ever since, with the exception of a temporary expansion to 437 to account for Alaska and Hawaii becoming states in the late 1950s.
In that initial 435-seat apportionment for the 1910s, California had 11 House members — tied with Iowa, Kentucky, and Wisconsin. The Golden State now has nearly five times that number of members (53), although the state’s explosive growth has slowed in recent years. The state did not add any seats in the 2010 reapportionment round, which was the first time it failed to add a seat following a decennial census.
This most recent reapportionment represented a new, dubious first for California — the state is actually losing a seat, going from 53 to 52, though it still has by far the biggest House delegation (Texas will be second at 38 seats).
The loss of a seat will force California’s independent redistricting commission to chop a district. Beyond that, it’s unclear how much the commission, which is in charge for the second time after voters created it in 2010, will tweak the lines.
The commission, which by law cannot take partisan data or incumbent residence into account, dramatically changed the state’s map a decade ago. That new map put 27 incumbents into 13 districts and created 14 with no incumbent; seven incumbents retired, and another seven lost either to members of their own party or members of the other party (California uses a top-two election system, in which the top two finishers in an all-party first round of voting advance to the November general election). The commission injected some competitiveness into a state that had hardly any of it under a Democratic-drawn incumbent protection map in place for the 2000s: Just a single seat switched hands that entire decade, as Democrats started the decade with a 33-20 edge that became a 34-19 advantage. Democrats immediately netted four seats in the 2012 election, and they were up to a lopsided 46-7 edge by the 2018 election. Republicans recovered some of those seats in 2020, clawing back four Biden-carried districts. Four of the nine Biden-won seats held by Republicans are in California, including the only three that Biden won by double-digits: Reps. Mike Garcia (R, CA-25), Young Kim (R, CA-39), and David Valadao (R, CA-21) all hold districts that Biden carried by about 10 points apiece. The fourth Biden-district California Republican, Rep. Michelle Steel (R, CA-48), holds a much more marginal seat (Biden won it by just 1.5 points). So one of the big questions about the commission is whether the commission will merely tweak the last decade’s map, given that it was already drawn by a commission as opposed to legislators, or whether the members will take a wrecking ball to the existing map, much like the commission did a decade ago. This question is unanswerable at this point (at least from our perspective).
California was once known for hard-edged gerrymanders. Congressional scholar David Mayhew has noted that a California Republican gerrymander in advance of the 1952 election (along with one in New York) contributed greatly to the Republicans winning a slim House majority in that election, which was one of only two House majorities the Republicans won in a more than six-decade stretch from the early 1930s to early 1990s (the other came in 1946). More recently, California Democratic power broker Rep. Phil Burton crafted a strong gerrymander after the 1980 census, pushing a 22-21 Democratic delegation to a 28-17 edge. Voters threw out the map in a 1982 statewide ballot issue, but Burton crafted another, similar gerrymander that outgoing Gov. Jerry Brown (D-CA) — then serving his first eight-year stint as governor — signed right before leaving office. If Democrats still retained gerrymandering power in California — and they would have it even if Gov. Gavin Newsom (D-CA) is ousted in a recall next month because Democrats hold veto-proof state legislative majorities — they likely could squeeze several more seats out of the state by hurting some or all of the Biden-district Republicans and also potentially going after at least one of two prominent Central Valley Republicans: House Minority Leader Kevin McCarthy (R, CA-23) and Rep. Devin Nunes (R, CA-22), the former chairman of the Intelligence Committee.
But Democrats do not have that power. Rather, the commission will be drawing the lines.
Now, it is fair to wonder whether Democrats will end up with something of a de facto edge on the commission. A decade ago, Democrats gained advantages in the process through out-organizing Republicans, as ProPublica noted at the time. Additionally, California is an overwhelmingly Democratic state, so even on a commission with five Democrats, five Republicans, and four members not affiliated with either party, one might expect the commission to lean Democratic to some extent, argues independent California pollster Adam Probolsky: “We have a progressive state. So even though the commission is mandated to have No Party Preference voters, remember, independent voters look and think just like their neighbors — they just don’t have loyalty to a party. So those independents are going to lean progressive.”
All that said, it would also be unfair to describe the last decade’s map as a Democratic gerrymander. Rather, it was a map that created a number of competitive seats that Democrats were able to capture, and it also created a number of safe Republican suburban seats in Southern California that became much less Republican over the course of the decade, to the point where Democrats were able to win several of them. For instance, Joe Biden did 15 points better than Barack Obama did in 2012 in both San Diego and Orange counties, which are the second and third-largest sources of votes in the state and where Democrats flipped several House seats last decade. A lot of that is realignment, not gerrymandering.
One thing that does stand out in the state’s demographics is that many districts in the Los Angeles area are underpopulated. Scott Lay, who produces The Nooner newsletter on California state politics, suggests that one possibility is that an East Los Angeles district may be eliminated, with the districts held by Reps. Grace Napolitano (D, CA-32) and Lucille Roybal-Allard (D, CA-40) as possibilities (both are in their 80s, so either or both could retire). One other possibility is that Rep. Karen Bass’ (D, CA-37) district west of downtown could be eliminated if she decides to run for mayor of Los Angeles, as has been recently rumored — that would be a way to effectively protect all the other incumbents (readers will remember that Bass was one of Joe Biden’s reported vice presidential options). Darry Sragow, publisher of the California Target Book, recently noted that LA County contains all or part of 14 congressional districts, and that the ideal population size for California districts this decade will be about 760,000 people. Combined, the 14 LA County districts are currently about 575,000 people short of that target, meaning that “It is almost certain that the one seat California must give up will come from there.” (Although, remember, we’re working off census estimates, not the actual census numbers, which are coming out later today.)
Democrats would surely prefer the eliminated district come from elsewhere in the state, with the Central Valley as a candidate.
Assuming a Democratic LA County seat is cut, perhaps Democrats can make up for that by beating one or more of the Biden-district Republicans — Garcia seems the most vulnerable to us, in part because of a conservative voting record (he backed both objections to the Electoral College certification in January) — or by getting positive district alterations elsewhere. That said, the commission is difficult to handicap, so we’re just going to have to wait and see.
COLORADO
Number of seats: 8 (+1 from 2010s)
Party breakdown in 2012: 4-3 R
Current party breakdown: 4-3 D
Most overpopulated district: CO-4 (Eastern Colorado)
Most underpopulated district: CO-3 (Western Slope/Pueblo)
Who controls redistricting: Commission
2012 control: Split
Colorado is one of the states where Democrats are kicking themselves for getting behind an independent/nonpartisan redistricting process last decade. Because Democrats now control state government, they could have gerrymandered the state, grabbing the state’s new, eighth seat and otherwise working to expand their current 4-3 edge in the delegation. But Colorado has a commission now, and it is really the only state so far where there’s already a working draft of the map. We analyzed this map in great detail when it was released, so for those who want to know more about the Colorado details, just look back at that piece. This map would, in most years, result in a 5-3 Democratic delegation. However, it will at the very least have to be tweaked slightly, because the map was drawn based on census estimates, not the actual census numbers. As political scientist Michael McDonald noted, the map draft likely has too much population deviation among districts to pass judicial muster.
We’ll continue to follow developments in Colorado, but let’s move on to other states that don’t have draft maps already.
CONNECTICUT
Number of seats: 5 (no change from 2010s)
Breakdown in 2012: 5-0 D
Current party breakdown: 5-0 D
Most overpopulated district: CT-4 (Southwest Connecticut)
Most underpopulated district: CT-2 (Eastern Connecticut)
Who controls redistricting: Split
2012 control: Split
Connecticut is one of several states across the nation that used to feature strong competition at the U.S. House level but didn’t have much action last decade. Democrats won all five seats in all five election years last decade, and that was on a congressional map that was not gerrymandered to produce such an outcome.
A big reason for Connecticut’s transition from congressional battleground to Democratic bastion has been the long erosion of Republican strength in Fairfield County, the affluent, highly-educated part of the state that is closest to New York City and is the largest source of votes in the state. In 1996, Fairfield voted Democratic for president for just the second time since World War II (1964 was the other exception, as it so often was for historically Republican places in the North). By 2020, Fairfield was up to a 27-point margin for Joe Biden, the biggest margin it had given any Democrat for president possibly ever, or at least since at least the early 1880s (that’s as far back as Dave Leip’s Atlas of U.S. Presidential Elections goes).
Former Rep. Chris Shays, the last Republican to win an election to the congressional district that covers Fairfield County, CT-4, is an exemplar of the moderate Republicanism that used to predominate in parts of the region. Elected in a 1987 special election, he first ran for reelection in 1988 — he claimed 72% while, up the ballot, George H. W. Bush took 57% in CT-4. Shays held on for three decades and was not seriously challenged until George W. Bush was in the White House. Finally, in 2008, as Barack Obama carried CT-4 by 20 points, Shays came up four points short against now-Rep. Jim Himes (D, CT-4).
A dozen years later, CT-4 was Biden’s best district in the state. Some of the Republican tradition in this part of the state still endures: Republicans recently won a special election for a state Senate seat that covers Greenwich and the New York border that voted heavily for Biden. However, state-level races in the district are typically much closer.
Some other parts of Connecticut flirted with Donald Trump in 2016 — he came within three points of winning Eastern Connecticut’s CT-2 and within about four of winning Northwest Connecticut’s CT-5, which was the state’s most competitive district at the U.S. House level in the 2010s. But, as it was in nearly every other congressional district in New England in 2020, Biden did better than Hillary Clinton, and he carried all five congressional districts in Connecticut by double digits. As Map 2 shows, in addition to holding all five congressional districts, Biden picked up almost three dozen towns that supported Donald Trump in 2016.
Map 2: Connecticut town loyalty, 2016-2020
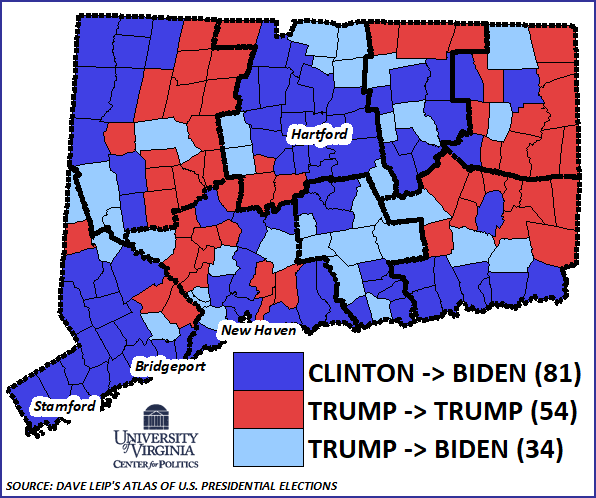
The Nutmeg State has what amounts to a bipartisan redistricting process because Democrats lack the two-thirds state legislative majorities they need to draw the maps on their own. The two western seats, CT-4 and CT-5, are overpopulated to some degree, while the other three are underpopulated, though only CT-2 is significantly so. Courts could end up getting involved, as they did a decade ago when minimal changes were made to the map.
The bottom line in Connecticut is that under optimal circumstances, Republicans might be able to compete for one or more of its districts this decade. But if they do, redistricting likely will not have been a major contributor to that happening.
FLORIDA
Number of seats: 28 (up 1 from 2010s)
Party breakdown in 2012: 17-10 R
Current party breakdown: 16-11 R
Most overpopulated district: FL-9 (Central Florida)
Most underpopulated district: FL-13 (Pinellas County)
Who controls redistricting: Republicans
2012 control: Republicans
In Florida, the coming redistricting process should bring no shortage of heartache for Democrats, but one of their most critical letdowns occurred almost three years ago: the winner of the 2018 gubernatorial race would get the opportunity to fill three seats on the state Supreme Court, as three Democratic-appointed justices were set to retire (judges on that court face a mandatory retirement age). In 2015, the state Supreme Court forced changes to the state’s Republican-drawn congressional map. The new map precipitated several Democrats pick-ups in the 2016 and 2018 cycles.
Despite trailing in most polls, and running in an unfavorable national environment, then-Rep. Ron DeSantis (R, FL-6) upset then-Tallahassee Mayor Andrew Gillum (D) to keep the governor’s mansion in Republican hands. DeSantis filled the three positions, and the Florida Supreme Court is now one of the most conservative state courts in the country. With a new jurisprudence dominating the court, Democrats will find a less sympathetic audience for any redistricting challenges, though Republican legislators may not want to get too creative for their own good. Republican mappers may also be limited by the Fair Districts Amendment, a ballot measure that passed in 2010 and was meant to encourage compact and fair districts (but which Democrats are fearful that this court effectively will not enforce after the more liberal version of the court used it against GOP gerrymanders last decade).
With all this out of the way, let’s consider where things stand now, and what’s likely to change.
After the 2014 election, Republicans retained a 17-10 edge in the state’s delegation. But by the end of 2018, with a new map and a favorable midterm environment, Democrats had clawed within one seat of majority in the delegation, which became 14-13 Republican. Then, in 2020, as former President Donald Trump carried Florida by more than three percentage points — a comfortable margin, by state standards — he helped Republicans regain two seats in the Miami area, bringing their advantage back up to 16-11. The delegation will grow by one member at the start of the next Congress, although most observers expected it to gain two — Florida has added members since the 1940 census, when it was the least populous state in the South. It is now the nation’s third most populous state, trailing only California and Texas.
The most underpopulated district in the state in the panhandle-based FL-2, held by Republican Rep. Neal Dunn. The 2nd District, which is now mostly rural, traditionally included the city of Tallahassee. But with the 2015 remap, most of the 2nd’s holdings in the city were given to the newly drawn FL-5, which was intended to be a majority-nonwhite seat. While Rep. Al Lawson (D, FL-5) hails from the state’s capital area and represented in the legislature for years before his 2016 election to congress, a greater portion of the district actually comes from Jacksonville (it includes most of the city’s Black precincts). While some Republicans have maintained that the current iteration of FL-5 is not protected by the Voting Rights Act — by composition, it is less than 50% Black — Nicholas Warren of the Florida ACLU, argues that major changes won’t be in store for the district. We will just have to wait and see how Republicans deal with this district, and what legal fallout may ensue.
Moving south to the Orlando area, Democrats hold three seats, but seem likely to come out of redistricting with only two. FL-10, which is split roughly evenly among whites, Blacks, and Hispanics, was a seat created for 2015, and seems unlikely to change — as it usually gives Democrats over 60% of the vote, it acts as a vote sink in the area. Just to the south, the most populous district in the state is Rep. Darren Soto’s (D) FL-9, which needs to drop a whopping 165,000 residents. Whites and Hispanics each account for roughly 40% of the 9th’s population, though the latter group’s growth has been especially rapid. Given its minority population, Republicans may also steer clear of drastically reshaping FL-9 — it currently has a mild Democratic lean, but its redder holdings could be transferred out to shore up adjacent GOP seats.
North of Orlando, Republicans will likely target Rep. Stephanie Murphy’s (D, FL-7) district — though it contains some of Orlando proper, suburban Seminole County makes up the majority of FL-7. Unlike districts 9 and 10, the 7th has a white majority. Though the trends for Republicans in Seminole County have not been good (it was a Trump-to-Biden county), legislators could make it redder by giving it parts of working-class Volusia County, or rural precincts of Lake County. If FL-7 is heavily altered, Murphy, who is a leader in the moderate Blue Dog Coalition, may be able to run in a new version of FL-10, as Rep. Val Demings (D, FL-10) is running for Senate (though other credible Democratic candidates have already announced bids for the open seat).
Over in the Tampa Bay area, FL-13, which takes up three-quarters of Pinellas County, is another Blue Dog district that Republicans will have their eye on. Former Gov. Charlie Crist — who has, under three partisan labels, been a fixture in state politics for the last quarter-century — won this seat in 2016, but is now running for his old job. Before 2016, the legislature grouped most of the heavily Black precincts in St. Petersburg, Crist’s hometown, into Rep. Kathy Castor’s safely blue FL-14, which was focused on downtown Tampa (both parts of the district touched Tampa Bay, so the seat was contiguous). When the entirety of St. Petersburg was put back into FL-13, Crist ran and beat then-Rep. David Jolly (R) 52%-48% — those precincts were decisive.
With a friendly court, Republicans may try to put parts of St. Petersburg back into FL-14, though Democrats would probably cite the Fair Districts Amendment and sue. If Republicans wanted to go a less risky route, FL-13 is one of the few districts in the state that needs to gain population — they could simply add some redder Pinellas County precincts that are currently in FL-12. This district is competitive enough already that a Republican might be able to win it as its currently drawn, and Republicans may very well attempt to make it redder.
Finally, in south Florida, Republicans will probably be more interested in shoring up their current members than targeting Democrats. In 2020, three Cuban-American Republicans were elected to represent the Miami area: veteran Rep. Mario Diaz-Balart (R, FL-25) was unopposed for a 10th term, while now-Reps. Carlos Gimenez (R, FL-26) and Maria Elvira Salazar (R, FL-27) ousted Democratic incumbents who were first elected in 2018. Salazar is the only one of the trio who holds a Biden seat, though the president’s three-point margin in her district was down considerably from Hillary Clinton’s 20% margin from 2016. Republicans may remove parts of Miami Beach, which has a sizeable white liberal bloc, and give Salazar more ethnically Cuban precincts that are currently in Diaz-Balart’s seat. Gimenez may also want some help — though Trump carried his FL-26 by six points, it gave Clinton 57%.
If Trump’s numbers with Cubans represent a new normal, the GOP’s Miami-area incumbents should have little to fear. But Republican legislators would be wise to draw the lines with the understanding that this may not be the case.
Ultimately, Florida, like the other states mentioned here, is a state where Republicans likely will go as far as courts let them — or as far as they think courts will let them.
GEORGIA
Number of seats: 14 (no change from 2010s)
Party breakdown in 2012: 9-5 R
Current party breakdown: 8-6 R
Most overpopulated district: GA-7 (Greater Atlanta)
Most underpopulated district: GA-2 (Southwest Georgia)
Who controls redistricting: Republicans
2012 control: Republicans
Georgia has been at the forefront of national politics over the last year. After hosting a razor-thin presidential contest and two blockbuster Senate runoff elections, the Peach State will once again find itself in the national spotlight when maps are redrawn later this year.
Though Democrats have found success in recent statewide elections, Republicans will be overseeing the mapmaking process because they still have majorities in both chambers of the state legislature and hold the governorship. With that trifecta, Republicans will face a tough balancing act: they will want to stymie Democratic gains in the Atlanta area but also protect their own incumbents — all while keeping the Voting Rights Act in mind.
To understand the daunting task that Georgia Republicans face, we must take a trip back in time to the early 2000s. Back then, Democrats had dominated state government since Reconstruction, but they faced an increasingly competitive GOP. Republicans were beginning to post impressive numbers in the state’s rural areas and cut into the Democrats’ state legislative majorities.
Democrats, seeing the writing on the wall, concocted egregious congressional and state legislative gerrymanders to preserve their dwindling grip on power.
The congressional map was certainly not easy on the eyes. The 2002 Almanac of American Politics noted that the map must be “admired for its creativity.” The state was awarded two new seats in the 2000 census, and, not coincidentally, both were drawn to favor Democrats. Still, the Almanac authors warned that the map may not last the entire decade, citing not only Republicans’ rise to power but several federal lawsuits challenging the legality of the maps. “This work of art may not endure,” the Almanac noted.
Sure enough, they were right. Courts threw out the Democrats’ state legislative maps, paving the way for Republicans to grab control of state government for the first time since Reconstruction. One of their first orders of business was redrawing the congressional map in a rare mid-decade redistricting session. The new map was much more compact and split fewer counties than its predecessor. Republicans also attempted to make more life more difficult for then-Reps. John Barrow (D, GA-12) and Jim Marshall (D, GA-8), two white Democrats with moderate voting records. Despite facing tougher constituencies, both Democrats were narrowly reelected in 2006’s broader Democratic wave.
In 2010, Rep. Sanford Bishop (D, GA-2), in the southwest, faced a surprisingly close race — so close that some news networks called it for his Republican opponent on Election Night. Elsewhere, Marshall lost reelection to now-Rep. Austin Scott (R, GA-8), but Barrow was comfortably reelected.
In the 2011 redistricting session, Republicans decided to make a tradeoff in order to protect Scott: Bibb County, which includes Macon, was the anchor of Scott’s district. GOP mapmakers decided to cede Bibb to Bishop in exchange for adding more rural counties to the 8th — importantly, as we’ll see later, this pushed the Black population share in GA-2 to over 50%. They also had their sights set on Barrow once again: they removed Savannah from his district and added more rural counties such as Coffee and Jeff Davis. When Barrow lost in 2014, he was the only remaining white Democrat in the Deep South — with his loss, the map produced its intended 10-4 Republican split.
This brings us to the upcoming redistricting process. Recent Democratic gains in the metro Atlanta suburbs have shifted the delegation from 10-4 to 8-6 Republican. In the 6th District, Rep. Lucy McBath (D) pulled off one of the biggest upsets of the 2018 midterms when she ousted Rep. Karen Handel (R), who had just won a high-dollar special election for this suburban district the previous year. The 6th also saw one of the largest swings from Barack Obama in 2012 to Joe Biden in 2020 of any district in the nation, going from Obama -23 to Biden+11. Handel waged a rematch in 2020, which McBath won comfortably.
In the 7th District, which includes most of rapidly diversifying Gwinnett County, now-Rep. Carolyn Bourdeaux (D) came within 500 votes of ousting Rep. Rob Woodall (R) in what was the single closest House race of the entire 2018 campaign. Woodall decided against running for reelection in 2020, and Bourdeaux narrowly defeated emergency room physician Rich McCormick (R) in the general election, making her the only Democrat to flip a competitive Republican-held district in 2020.
Republicans are going to have to address their recent decline across the metro Atlanta suburbs, where they still have plenty of room to fall. No one knows what the map will end up looking like, but the general consensus seems to be that Republicans will attempt to combine the bluest parts of the 6th and 7th districts into one safely Democratic vote sink, in exchange for creating a new solidly Republican seat in rural and exurban northeast Georgia.
On Map 3, GA-7, a checkmark-shaped district arching across the Atlanta metro, would have given Biden a 30-point margin, while the much redder 6th District is stretched up to the northern border.
Map 3: Hypothetical 9-5 Republican Georgia gerrymander
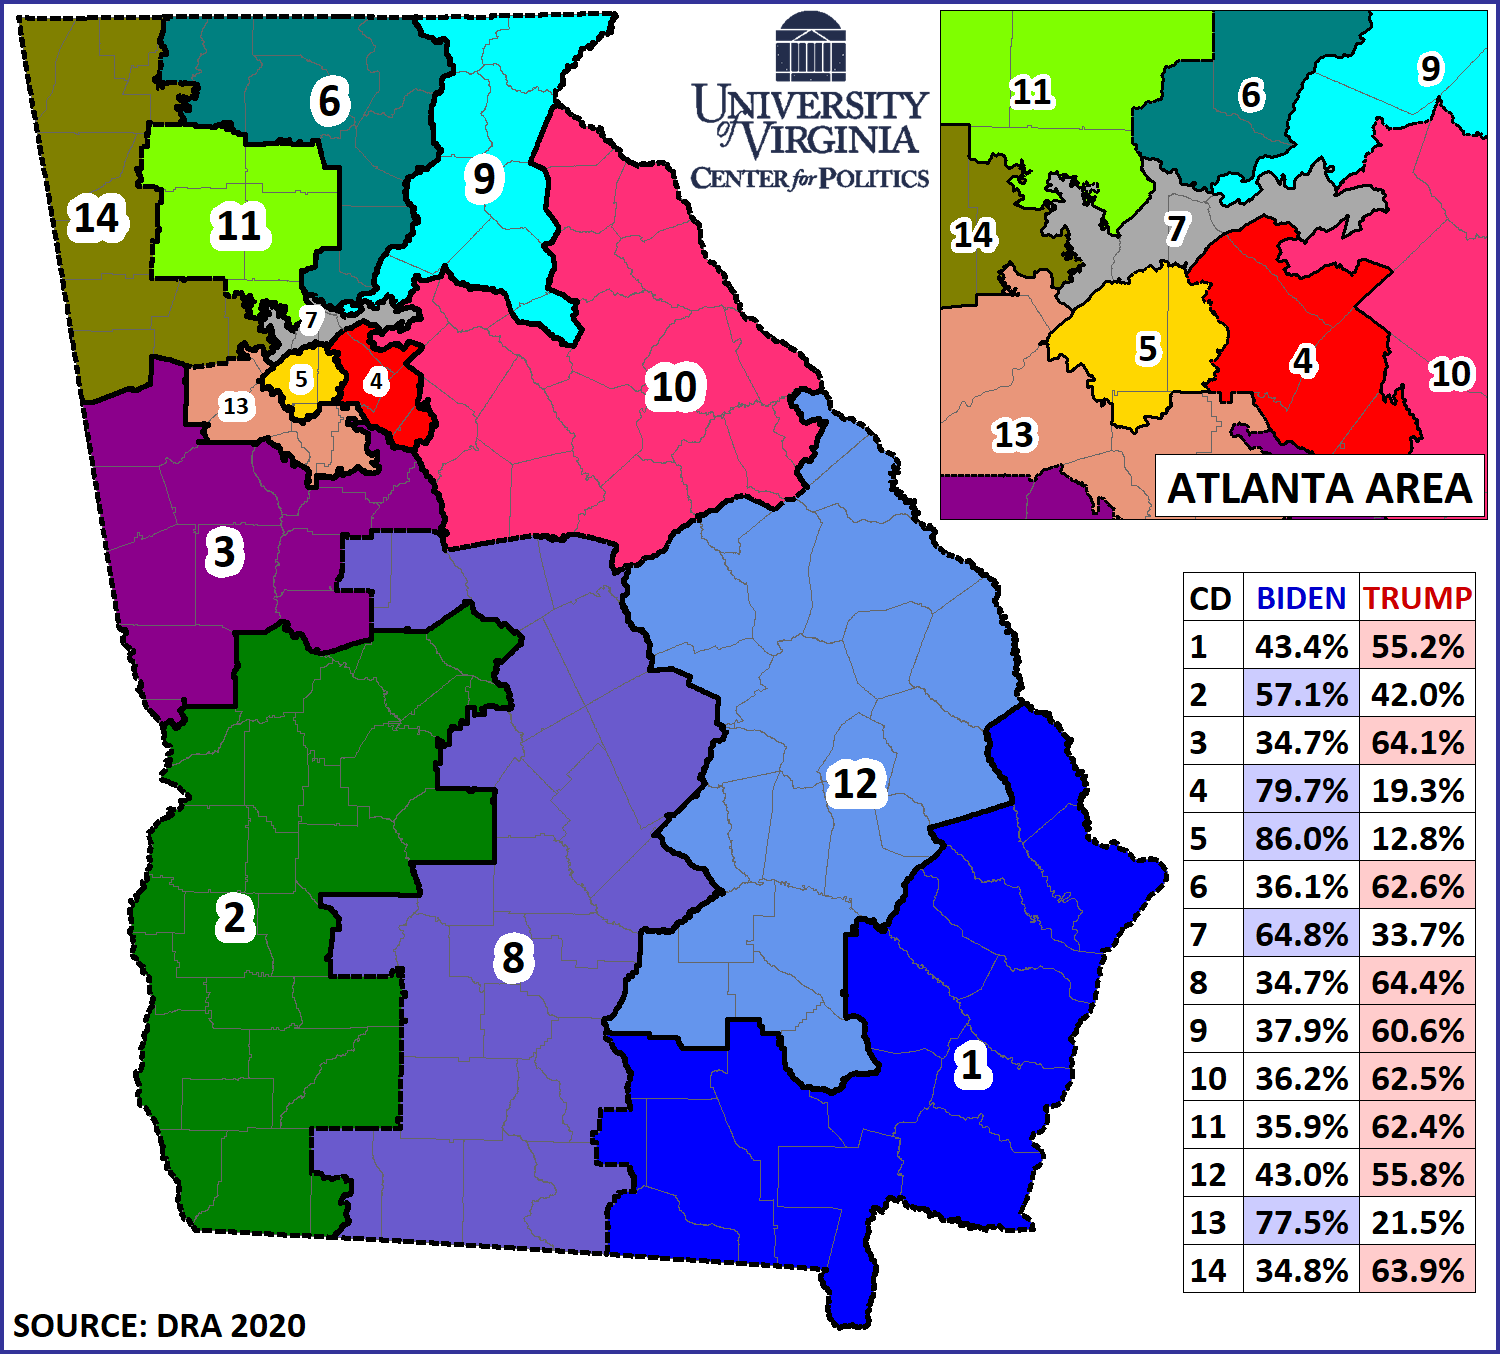
The result of Map 3 would very likely be a Georgia delegation with nine Republicans and five Democrats. If GOP legislators try to redraw a Democratic-held seat to elect a Republican (GA-6, in this case), some of their own members, especially Reps. Andrew Clyde (R, GA-9) and Marjorie Taylor Greene (R, GA-14), would have to be team players: currently, both of their seats gave Trump about 75% of the vote, but are knocked down to under 65% Trump in Map 3. At the same time, Republicans would want to strengthen Rep. Barry Loudermilk (R, GA-11) — over the last decade, his district has crept down from 67% Romney in 2012 to 57% for Trump. On Map 3, GA-11 drops some of its closer-in parts of the Atlanta metro, and Trump’s share climbs back to 63%.
So if Republicans spread themselves out efficiently, most of their districts would end up being between 60% and 65% Trump — this is the case for seven of their nine seats on Map 3. Districts 1 and 12 are each closer to 55% Trump, but both are racially polarized and outside of their urban centers (Savannah and Augusta, respectively), Democratic support drops off steeply.
GA-7’s unique demographic trajectory may be one reason why Republicans may preserve it as a Democratic-leaning seat: it was originally drawn to be about 50% white but is now firmly a majority-nonwhite seat, so big changes could be seen as a violation of the Voting Rights Act by Democratic redistricting lawyers. Still, a judge may also note that Section 2 of the VRA mandates that some districts be drawn so that certain minority groups can elect candidates of their choice. Though the 7th District is now majority-minority, Bourdeaux herself is white, and the district also includes a mix of different types of voters of color (the district is roughly two-fifths white, a fifth Black, a fifth Hispanic, and a sixth Asian). We asked Charles Bullock, a redistricting expert at the University of Georgia who recently released a second edition of his excellent book, Redistricting: The Most Political Activity in America, about the 7th District. He noted that plaintiffs in a lawsuit based on the VRA’s Section 2 would face the challenge of showing that members of the three non-Hispanic white ethnic groups vote alike.
Some Republicans have also suggested that Bishop’s GA-2 might be at risk — the version on Map 3 gave Biden a not-overwhelming 57%, and it could easily be made more Republican. Carving out a redder district in southwest Georgia may seem enticing for the GOP, but a move like this could be seen as a violation of the Voting Rights Act. Unlike the 7th, the 2nd was intended to be a majority-minority district (remember, Republicans did this on purpose a decade ago in order to shore up the then-newly-elected Scott next door in GA-8). Black voters in the 2nd may feel disenfranchised if they are unable to have appropriate representation in Congress. Plus, it’s not guaranteed that a more competitive district in Southwest Georgia would be completely unwinnable for Bishop. His moderate stances on abortion and gun rights have played well with rural white voters over the years. And while we may live in era where down-ticket races are becoming increasingly tied to presidential races, Bishop maintains a respectable amount of crossover support. Bullock agreed that the district might be redrawn in such a way that Bishop could hold it, but perhaps not another Democrat if Bishop retired at some point this decade (Bishop is 74).
To make a long story short, Republicans are now facing the same predicament that Democrats faced two decades ago. Their majorities in the state legislature are getting smaller, the minority party has been surprisingly successful in recent statewide elections, and they are facing a grim outlook in areas of the state where they once dominated. Republicans are aware that redistricting could be their last chance to forestall new Democratic gains in state government.
HAWAII
Number of seats: 2 (no change from 2010s)
Party breakdown in 2012: 2-0 D
Current party breakdown: 2-0 D
Most overpopulated district: HI-1 (Honolulu)
Most underpopulated district: HI-2 (Half of Oahu/remainder of islands in state)
Who controls redistricting: Commission
2012 control: Commission
One could make a case that Hawaii is trending Republican: Barack Obama won the state of his birth by 45 points in 2008, and Joe Biden won it by just 29 in 2020. But it would not be a very good case, particularly because if you started in 2004, when George W. Bush came within nine points of carrying the Aloha State, you could argue the opposite.
Only two Republicans have ever won House elections in Hawaii: Pat Saiki won two terms in the late 1980s, and Charles Djou won a flukish, all-party special election in 2010, but lost the regular election later that year.
The state’s bipartisan redistricting commission will have to make some slight adjustments to account for population (the Honolulu-based 1st District will have to shed a little population to HI-2, which covers the rest of the state), but we otherwise wouldn’t expect much to happen here. Biden won each district by almost identical margins (a shade under 30 points apiece), so they are politically similar. Democrats are so dominant in Hawaii at the state level that Republicans only hold one seat in the 25-member state Senate.
IDAHO
Number of seats: 2 (no change from 2010s)
Party breakdown in 2012: 2-0 R
Current party breakdown: 2-0 R
Most overpopulated district: ID-1 (Western Idaho)
Most underpopulated district: ID-2 (Eastern Idaho)
Who controls redistricting: Commission
2012 control: Commission
Even though Idaho is one of the most Republican states in the Union, Democrats will have a seat at the table in redistricting thanks to the state’s commission system. The commission consists of three Republicans and three Democrats.
The commissioners will have to shift population from the growing 1st District, which contains the state’s distinctive northern panhandle, to the slower-growing 2nd District. The current plan splits Ada County, home to a bit more than a quarter of the state’s population and the state’s capital, Boise. Joe Biden came within four points of carrying the county — the closest any Democrat has come since World War II. But even a radically-remade Idaho congressional map that united Ada County still would need to add considerably more population, and the county is surrounded by considerably redder counties. In any event, we wouldn’t expect the lines to change much, and both districts are heavily Republican: ID-1 voted for Donald Trump by 37 points, and ID-2 voted for him by 24 points. So even as ID-2 seems likelier to take on more of the Boise area to balance out the population of the two districts, it should still be a Safe Republican seat. Trump won Idaho overall by 31 points, his fifth-best state (neighboring Wyoming was his best).
Idaho is the nation’s second-fastest-growing state, and it’s not out of the realm of possibility that it could add a third seat in the 2030 reapportionment. Randy Stapilus, a former Idaho newspaper reporter, speculated in a May column about what a three-district Idaho map might look like. One possibility would be to combine Ada with neighboring Canyon County, both fast-growing counties that together could have roughly the proper population size if the state had three districts. But Trump would have carried that hypothetical district by 13 points, which is a good illustration of the GOP strength in Idaho even in its most populated area.
ILLINOIS
Number of seats: 17 (-1 from 2010s)
Breakdown in 2012: 12-6 D
Current party breakdown: 13-5 D
Most overpopulated district: IL-7 (Downtown/West Side Chicago)
Most underpopulated district: IL-17 (Northwest Illinois)
Who controls redistricting: Democrats
2012 control: Democrats
With a 13-5 edge in the Illinois U.S. House delegation already, Democrats are not going to be able to squeeze a ton more out of the Land of Lincoln. But they should be able to do better than they are doing now and, just as importantly, they should be able to better protect some of the competitive districts they already hold.
As they draw the maps in Illinois, Democrats will be building off their gerrymander from a decade ago — one that worked out great for them in the long run of the decade, though not really as intended.
Republicans won 11 of Illinois’s 19 House seats in 2010, but Democratic control of the state legislature paired with then-Gov. Pat Quinn’s (D) narrow victory allowed Democrats to draw the state’s map. They designed a map that they hoped would elect 13 Democrats and five Republicans. Democrats came up one seat short in 2012, as now-Rep. Rodney Davis (R, IL-13) narrowly held a central Illinois seat that covers the state capital, Springfield, as well as Champaign-Urbana, home of the flagship University of Illinois campus. Davis was pushed hard again in 2018, but he remains in office. Republicans struck back in 2014, winning the affluent and highly educated northern Chicago suburban district IL-10 as well as the ancestrally Democratic but Republican-trending IL-12 in southwest Illinois. Democrats won IL-10 back in 2016, and now-Reps. Sean Casten (D, IL-6) and Lauren Underwood (D, IL-14) flipped two of the five seats “reserved” for Republicans at the start of the decade by the Democratic gerrymander. Democrats held all 13 of their seats in 2020, although Underwood only won by a little over a point. Meanwhile, Rep. Cheri Bustos (D, IL-17) won her gerrymandered district consistently throughout the decade, but she only won by four points last year in the Obama-to-Trump district. She is retiring, complicating Democratic efforts to hold her seat.
Illinois, one of the few states that actually lost population from 2010-2020, is once again losing a House seat. Two-thirds of Illinois’s population lives in either Chicago’s Cook County or one of its five surrounding “collar counties” (DuPage, Kane, Lake, McHenry, and Will). Democrats hold all 13 districts that cover these six counties with the exception of Rep. Adam Kinzinger’s (R) IL-16, which takes in a bit of the Chicago collar. Meanwhile, Republicans hold four of the five outstate districts, with IL-17 as the only exception.
So Democrats have several obvious goals in gerrymandering:
— Make sure that the eliminated district is one of the five current Republican seats.
— Protect Underwood in her exurban Chicago seat and, less pressingly, Casten, without endangering any of the other Democratic Chicagoland seats.
— Reconfigure the downstate districts to go after Davis in IL-13. This likely will be done in part by removing East St. Louis, a Democratic downstate bastion, from IL-12 and putting it in IL-13. This was once a Democratic vote center in IL-12, which Democrats held at the start of the decade, but now that Rep. Mike Bost (R, IL-12) has grabbed a strong hold on the district, there’s no sense, from a Democratic perspective, of “wasting” those Democratic votes in his district.
— Keep IL-17 blue.
Accomplishing all of these goals would result in a 14-3 Democratic map, an improvement on the current 13-5 advantage. Twitter mapmaker @UMichVoter showed how this could be done recently: IL-13 becomes a Biden +12 district by extending down to East St. Louis and continuing in a thin strip that takes in Springfield and Champaign. Chicagoland is reconfigured in such a way to put Underwood in a double-digit Biden seat, and IL-17 is changed into a Biden +9 seat. Democrats would be favored in those kinds of seats, although they could lose them under the right circumstances. Assuming the map worked as Democrats would want, they would confine Republicans to just three districts and quite possibly push out Kinzinger, a Trump critic who likely would have a hard time in a primary. Another Twitter mapmaker, Ryan Brune, suggests a more modest, 13-4 Democratic gerrymander.
The bottom line in Illinois is that Democrats are likely to come out of the state with at least a slightly bigger edge in the state than they hold now — indeed, they almost certainly have to if they are to retain the House, given their redistricting problems elsewhere.
One side note: Illinois Republicans may have been hoping to use the state courts to combat Democratic gerrymandering much as Democrats have used Democratic state courts in states such as North Carolina and Pennsylvania to combat Republican gerrymandering in those states. And they appeared to have an opening: One of the Democratic justices lost a retention election last November, setting up an open-seat election in 2022. The court is 4-3 Democratic, so winning that seat without any other changes would flip the court to Republicans. In response, Democrats re-drew the judicial districts, ostensibly to update the maps to better account for current population — they had been last drawn in 1964, although judicial districts are not subjected to the same equal population requirements as legislative districts — but also to improve their chances of maintaining control of the court.
INDIANA
Number of seats: 9 (no change from 2010s)
Breakdown in 2012: 7-2 R
Current party breakdown: 7-2 R
Most overpopulated district: IN-5 (Northern Indianapolis suburbs/exurbs)
Most underpopulated district: IN-8 (Southwest Indiana)
Who controls redistricting: Republicans
2012 control: Republicans
Despite being for decades the most clearly Republican state among the seven discussed here, Indiana once had a reputation for competitive House races. Democrats overcame a Republican gerrymander in the 1980s and ended up holding eight of the state’s 10 seats by the end of that decade. More recently, in the 2000s, Indiana featured perhaps the decade’s most intense congressional rivalry, as Mike Sodrel (R) and Baron Hill (D) battled for four straight elections over southern Indiana’s 9th District: the incumbent Hill fought off Sodrel in 2002 but then lost to him in 2004. Hill came back and beat Sodrel in 2006 and then beat him again in 2008.
But in 2010, Hill lost to Todd Young (R), who is now in the U.S. Senate. And Indiana’s famously competitive House elections became much less so. Part of that was because of Republican-controlled redistricting, but also because of political trends in the state, as traditional Democratic strength withered outside of the Indianapolis metro area. In 2012, Democrats only narrowly lost northern Indiana’s IN-2, which Joe Donnelly (D) left behind to successfully run for Senate after Republicans redrew the district, but Rep. Jackie Walorski (R, IN-2) has easily held the district since. Democrats also competed for IN-5, a highly-educated suburban/exurban district that runs north of Indianapolis, in 2020, but now-Rep. Victoria Spartz (R) held it in an open-seat race. That about sums up all of the major House-level competition in Indiana over the past decade, where Republicans have won a 7-2 edge in each election.
In redistricting, Republicans have a liability to address, and an opportunity to consider.
The liability is the aforementioned IN-5, where Mitt Romney’s 17-point edge in 2012 contracted to just a two-point margin for Donald Trump last year. Shoring up the fast-growing district likely will be a priority.
The opportunity is in northwest Indiana, where Democratic performance has softened in IN-1, held by first-term Rep. Frank Mrvan (D). Obama’s 2012 margin of 24 points fell to just nine for Biden in 2020. If Republicans got aggressive, they could try to slice up the district, although they may also just keep it intact with the hope that trends in the Gary/Hammond-based Chicago-area district continue to push it toward Republicans over the course of the decade — given its heavily blue collar character, this is a real possibility. So even without aggressive redistricting, Republicans could win an 8-1 edge in the state sometime this decade, although they have to be careful to stay ahead of Democratic trends in Greater Indianapolis.
IOWA
Number of seats: 4 (no change from 2010s)
Party breakdown in 2012: 2-2 split
Current party breakdown: 3-1 R
Most overpopulated district: IA-3 (Des Moines, Southwest Iowa)
Most underpopulated district: IA-4 (Northwest Iowa)
Who controls redistricting: Republicans
2012 control: Split
Iowa typically has one of the cleanest redistricting processes in the country. The state’s nonpartisan Legislative Services Agency drafts the maps, and the state legislature can either accept them as drawn or ask for a second draft. The legislature then decides on the second draft from the LSA, which it can accept or reject but not modify. Only if the legislature rejects a third draft can legislators modify the maps themselves.
This process has been in place since the 1980 census, but Republicans control state government and hypothetically could gerrymander — there is a strong norm in Iowa toward nonpartisan redistricting, but norms are not legally binding. The LSA should have the first map drafts in place by Sept. 16, which means the state appears as though it will miss a state constitutional deadline for finalizing the maps. However, there are indications that the Iowa Supreme Court, which is tasked with drawing the maps if the state misses the deadline, will allow the usual process to unfold. Iowa law also requires the state’s maps to be compact, to the extent possible, and the state preserves whole counties in congressional redistricting (Iowa, along with West Virginia, is the only state with more than one House district that does not have any split counties among its districts).
The current map has featured consistent competition. Three of the state’s four districts (IA-1, IA-2, and IA-3) changed hands at least once last decade, and even the fourth, IA-4, which is markedly more Republican than the others, has been competitive, thanks in part to the weakness of controversial former Rep. Steve King (R), who lost a primary in 2020. Democrats won three of the four districts in 2018. Republicans won two back last year, boosted by another strong performance by Donald Trump in Iowa. One of those two victories was by just six votes in IA-2.
Trump carried IA-4 by 27 points, but the other three districts are marginal: Trump’s margins in IA-1 and 2 were 3.5 and 4 points, respectively, and only a couple tenths of a percentage point in IA-3, held by Rep. Cindy Axne (D), the lone Democrat in the state’s congressional delegation.
IA-3 is the only one of the state’s four congressional districts that is overpopulated (by roughly 60,000 people). The most underpopulated district is IA-4, which covers the northwestern part of the state and is the state’s most Republican district. It needs to add about 30,000 people, and the two eastern districts, IA-1 and IA-2, each need to add roughly 17,000 and 12,000 people, respectively. Des Moines (Polk County) and its most populous surrounding county, Dallas (a growing, Republican-but-Democratic-trending part of the Des Moines area), form the core of IA-3. They have, combined, close to 600,000 residents, about three-quarters of the roughly 800,000 needed for one of the four Iowa congressional districts.
So one possible outcome is that IA-3 sheds some of its sparsely-populated and Republican rural counties. It would still be a swing district, but it wouldn’t take much to turn it into a Biden-won seat. Democrats probably would be happy if two neighboring eastern Iowa Democratic counties, Linn (Cedar Rapids) and Johnson (Iowa City/University of Iowa), were united in the same district (they are currently split between IA-1 and IA-2). Republicans, meanwhile, should reasonably believe they would have a good chance of a 4-0 delegation, at least in 2022, if the maps don’t change all that much. IA-4 is solid with new incumbent Rep. Randy Feenstra replacing the outrageously offensive King, first-term Reps. Ashley Hinson (R, IA-1) and Mariannette Miller-Meeks (R, IA-2) have a decent chance to hold Trump-won seats in a midterm environment with a Democrat in the White House (although Hinson has drawn a credible challenger), and IA-3 should be among the most vulnerable Democratic districts next year absent a significant assist from redistricting.
If Republicans end up drawing the maps, they could try to improve their chances of winning a 4-0 edge or, if they wanted to be conservative, could try to lock in a durable 3-1 delegation by creating something of a Democratic vote sink, perhaps connecting Des Moines to Iowa City while strengthening the new Republican incumbents in the eastern districts.
KANSAS
Number of seats: 4 (no change from 2010s)
Party breakdown in 2012: 4-0 R
Current party breakdown: 3-1 R
Most overpopulated district: KS-3 (Kansas City suburbs)
Most underpopulated district: KS-1 (Rural west)
Who controls redistricting? Republicans
2012 control: Republicans
When it comes to congressional redistricting, Kansas may be to Republicans what New Mexico is to Democrats. In these small states, the party that controls redistricting may go after the delegation’s lone minority party member — but doing so can be risky, and an aggressive plan may have some cumbersome logistical hurdles.
During the first decade of the 2000s, Democrats held KS-3, in the Kansas City suburbs, with veteran Blue Dog Dennis Moore (D, KS-3) and, for a term, rented the adjacent KS-2. In 2006, Rep. Jim Ryun (R, KS-2) seemed blindsided by the anti-Republican tenor of the cycle, as Democrat Nancy Boyda beat him 51%-47% to represent a seat that contained wide swaths of eastern Kansas. The next cycle, Republicans made the race a priority; in a reversal of 2006, state Treasurer Lynn Jenkins ran against Boyda and won 51%-46% — this was one of House Republicans’ few pickups in an otherwise grim cycle. Republicans have held KS-2 since then, and in 2010, as Moore retired, his KS-3 fell into Republican hands.
Though some conservative Republicans pushed for an aggressive map, they ran into resistance from some in their own party, as well as Democrats — over the last decade, warring between moderates and conservatives has defined Kansas Republican politics. When the situation ended up in the courts, a map that avoided large-scale changes was enacted (though they redrew KS-3, which favored Barack Obama 51%-48% in 2008, into a seat that gave John McCain a slight edge).
While the ultimate map was tamer than what some conservative partisans had pushed for, during the first three cycles of the decade, it still worked out fine for Republicans. Between 2012, 2014, and 2016, all GOP congressional nominees won by double-digits each cycle. In fact, some of the most-watched congressional races in Kansas were internecine. In 2014, Rep. Mike Pompeo (R, KS-4) easily beat back a primary challenge from his predecessor, Todd Tiahrt. Then, in 2016, and with help from the Farm Bureau, first-time candidate Roger Marshall primaried then-Rep. Tim Huelskamp (R, KS-1), a Tea Party bomb thrower who was an irritant to GOP leadership. (Marshall just won election to the Senate last year.)
After the 2016 election, Pompeo was tapped to serve in the Trump Administration. In a nationally watched April 2017 special election, then-state Treasurer Ron Estes held Pompeo’s Wichita-area seat by only a 52%-46% margin — that result was down markedly from the 27-point spread Trump posted in the district, and, with the midterms on the horizon, was seen as a harbinger of Democratic enthusiasm.
Ironically, Estes ended up being fine in the 2018 regular election, but Democratic gains materialized elsewhere in the state. As the suburbs soured on Trump, Democrats regained KS-3: Democrat Sharice Davids ousted then-Rep. Kevin Yoder (R, KS-3) by nearly 10 points. Democrats also only narrowly missed out on KS-2 — though the district contains the blue cities of Lawrence and Topeka, it has about two-dozen counties that are considerably redder. In 2020, no seats changed hands.
On paper, Republicans hold veto-proof majorities in the state legislature, and some of their members have entertained the idea of a 4-0 GOP map. Democrats have some leverage, though. Some Republicans may balk at a map that is too aggressive — in other words, a replay of last decade may be in the cards. There could be enough GOP defections to defeat a plan targeting Davids, or to sustain Gov. Laura Kelly’s (D-KS) veto of such a plan. Moreover, five of the seven justices on the state Supreme Court were appointed by Democratic governors, so Republicans may not find a sympathetic audience if their plans end up in court.
Given the demographic and electoral trends in KS-3, Republicans may be best served keeping the district as a Democratic sink, anyway. Since 1982, KS-3 has contained both Johnson and Wyandotte counties in their entirety — the former includes populous suburbs like Olathe and Overland Park, while the latter takes in a part of Kansas City proper. A decade ago, the pair was just 12,000 residents short of a full congressional district (so KS-3 picked up a few precincts in Miami County, to the south), and they went for McCain by a 49.7% to 49.0% margin in 2008. Today, the Johnson/Wyandotte pair is 45,000 residents *too large* for a single district, and together they supported Biden by nearly 12 points in 2020.
Map 4: Johnson and Wyandotte counties, KS
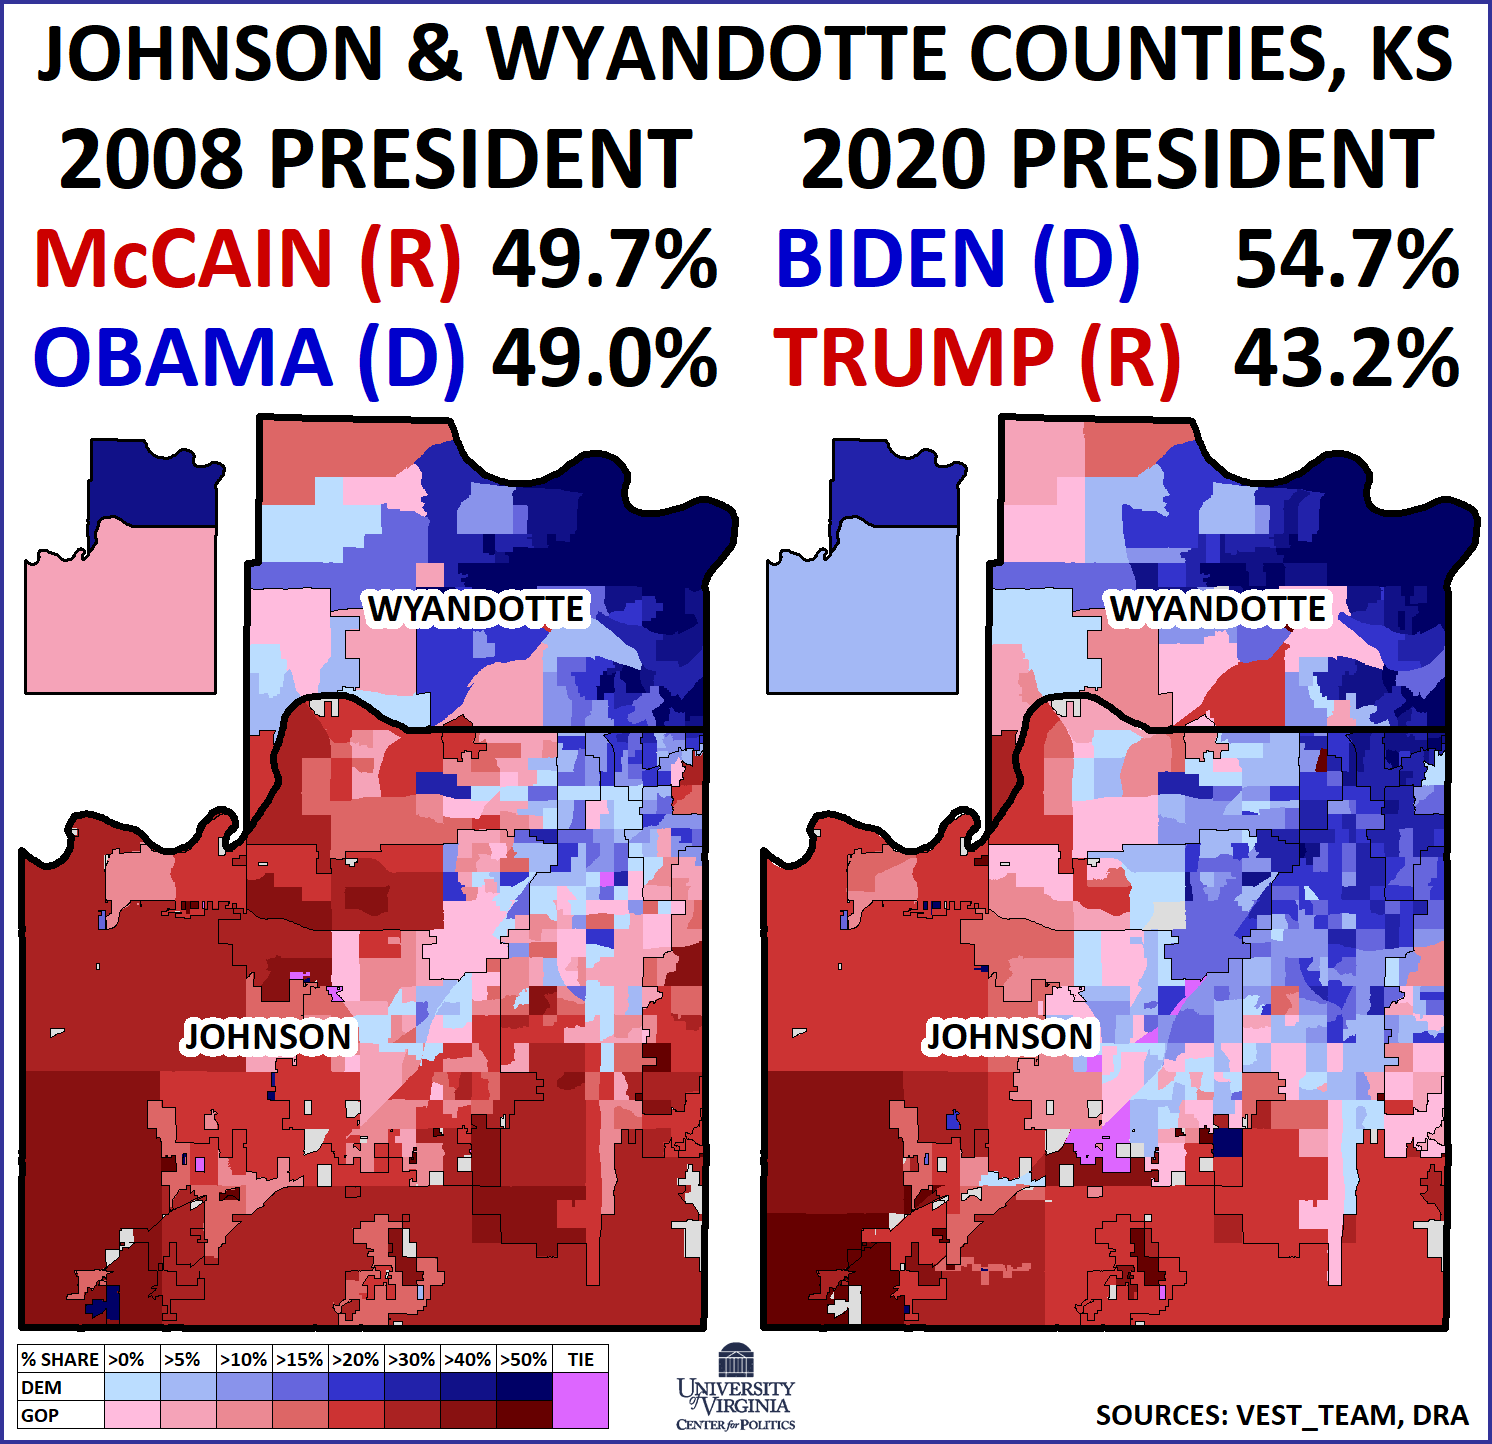
Whether Republicans target KS-3 or not, they could insulate their own incumbents by unpacking the “Big First.” Based out in western Kansas, KS-1 is the reddest district in the state. Seven of Kansas’ 10 most recent senators have come from within the borders of the existing KS-1, including its current pair and former Senate Majority Leader Bob Dole (R-KS). The Big First has been losing population for decades and will need to take in more territory regardless — in fact, many counties in western Kansas have fewer residents today than they did in 1920.
Southwestern Kansas (contained the Big First) is home to a growing Hispanic population, but this has not necessarily translated into Democratic gains. By composition, Grant County is now 52.5% Hispanic, up from 44% a decade ago — but two-thirds of registered voters there are white, and Trump claimed over three-quarters of the vote there each time he was on the general election ballot.
Republicans could give Topeka (Shawnee County) to KS-1, to boost first-term Rep. Jacob LaTurner (R, KS-2); in that case, both districts would give Trump over 60% of the vote. But even with Topeka, something like the current KS-2 would still have given Trump a share somewhere in the mid-50s — considering parts of southeastern Kansas have trended GOP anyway, LaTurner may not want to take on too much new territory.
Finally, under a 3-1 map, KS-4 will probably stay somewhere around Trump +20%. Sedgwick County (Wichita), which makes up about 70% of a district, gave Trump a 54%-43% margin, while its rural counties are even redder.
If Republicans wanted to push their luck, there are any number of ways the Kansas City area could be diluted among the other districts — but we’ll have to see if they actually take the plunge.
KENTUCKY
Number of seats: 6 (no change from 2010s)
Party breakdown in 2012: 5-1 R
Current party breakdown: 5-1 R
Most overpopulated district: KY-6 (Greater Lexington)
Most underpopulated district: KY-5 (Eastern Kentucky)
Who controls redistricting: Republicans
2012 control: Split
The emcee at the 2013 Kentucky Democratic Party’s Wendell Ford Dinner asked speakers to be brief. So Rep. John Yarmuth (D, KY-3) started his remarks thusly: “I can be really brief tonight and just say Mitch McConnell sucks.”
McConnell, the Senate minority leader who at one time served in a county-level office in Louisville’s Jefferson County, and Yarmuth, who represents Louisville in the House, are longtime antagonists. But McConnell, often the target of Yarmuth’s ire, may end up helping to prolong Yarmuth’s time in the House.
Yarmuth’s KY-3 is the only Democratic district in Kentucky. It’s not hard to imagine a hypothetical 6-0 Republican map in Kentucky that chops up Louisville. While Joe Biden carried KY-3 by 22 points, Donald Trump easily won the rest of the state. His smallest congressional district victory was by nine points in the Lexington-based KY-6, held by Rep. Andy Barr (R), who won by a bigger margin than Trump and held off a well-funded challenge from Amy McGrath (D) in 2018 (McGrath would go on to lose to McConnell in a 2020 rout). Trump won the remaining four districts by at least 30 points apiece, and his victory in eastern Kentucky’s KY-5, held by long-time Rep. Hal Rogers (R), was his second-best congressional district in the entire country, behind only the aforementioned AL-4 (based on numbers from Daily Kos Elections).
But “McConnell has made it known to mapmakers that he feels Yarmuth’s seat should remain intact, according to people familiar with those conversations,” Politico reported earlier this month. He is joined in this by other members of Kentucky’s congressional delegation, who probably don’t want to see their districts radically changed in order to crack Jefferson County and eliminate Yarmuth’s seat and/or are concerned about a court battle. McConnell may also not want to see his hometown sliced up in redistricting, even if failing to do so allows his rival, Yarmuth, to continue in office (Yarmuth does have a progressive primary challenger as well).
Ultimately, Republicans in the state legislature will decide, although the opinion of the congressional delegation likely will have some bearing on what they do. Even though Kentucky has a Democratic governor, Andy Beshear, the Republican-controlled legislature can override his vetoes with a simple majority vote, so this is a Republican-run state when it comes to redistricting.
It may be that not much changes on the Kentucky congressional map, which would be in keeping with what happened after 2000 and 2010 redistricting. Republicans could solidify their 5-1 hold on the map by strengthening GOP numbers in Barr’s district, although he may not necessarily need too much help given that he survived in 2018.
LOUISIANA
Number of seats: 6 (no change from 2010s)
Party breakdown in 2012: 5-1 R
Current party breakdown: 5-1 R
Most overpopulated district: LA-6 (Suburban Baton Rouge)
Most underpopulated district: LA-4 (Shreveport)
Who controls redistricting: Split
2012 control: Republicans
For Louisiana Republicans, the 2011 redistricting process was what the Washington Post described as a “cruel mistress.” In the early years of the 2000s, Louisiana was seeing stagnant population growth — then, in 2005, Hurricane Katrina flooded New Orleans, displacing thousands of residents. Though Louisiana may still have lost representation in the 2010 census anyway (the state has not seen truly robust population growth since the 1970s), the storm’s impact made downsizing an inevitability. In the state’s congressional delegation, Republicans, who could claim a state governmental trifecta in the state for the first time since Reconstruction, held all but one seat: the state’s Black-majority 2nd District, which was protected by the Voting Rights Act. As a result, a Republican-leaning seat would need to be cut.
Ultimately, then-freshman Rep. Jeff Landry (R, LA-3), a Tea Party conservative who is now the state’s attorney general, was thrown into a district that favored four-term Rep. Charles Boustany (R, LA-7), an ally of then-Speaker John Boehner (R, OH-8). Boustany ultimately won an intraparty runoff in the new seat by a 61%-39% margin.
One lesson of the Boustany/Landry showdown that will probably be relevant this cycle is that, though party loyalties matter, the first goal of most politicians is self-preservation. During redistricting negotiations, the Lafayette-based Boustany would not relinquish Calcasieu Parish (Lake Charles). This was, geographically, the parish farthest away from Landry’s LA-3, so as long as Boustany retained Calcasieu, any new version of his district would likely include much familiar turf. When it looked like some legislative Republicans had other ideas, Boustany threatened to help Democrats pass a plan, though his fellow partisans eventually appeased him.
This cycle, with the state retaining six districts, congressional downsizing won’t generate any redistricting-related drama. Instead, the main source of conflict may come from the governor’s chair: Louisiana is the only state in this group where a Democratic governor might be able to sustain a veto of a GOP-passed map. Though he could well end up signing off on what the legislature comes up with, many Democrats have urged Gov. John Bel Edwards (D-LA) to insist that a second Black-majority seat be drawn. As the state is roughly one-third Black, Democrats argue that two minority-influence seats would better reflect the state’s population. Republicans are just short of a supermajority in the legislature — if Edwards vetoes one of their maps, GOP legislators would need help from a few non-Republicans in the state House to override him. If Edwards and the Republicans can’t agree on a plan, the process will get kicked to the courts, where Edwards (and Democrats) could make the case for more favorable maps.
Map 5 shows a minimal change plan, and then a potential plan with two Black-majority districts.
Map 5: Hypothetical Louisiana redistricting maps
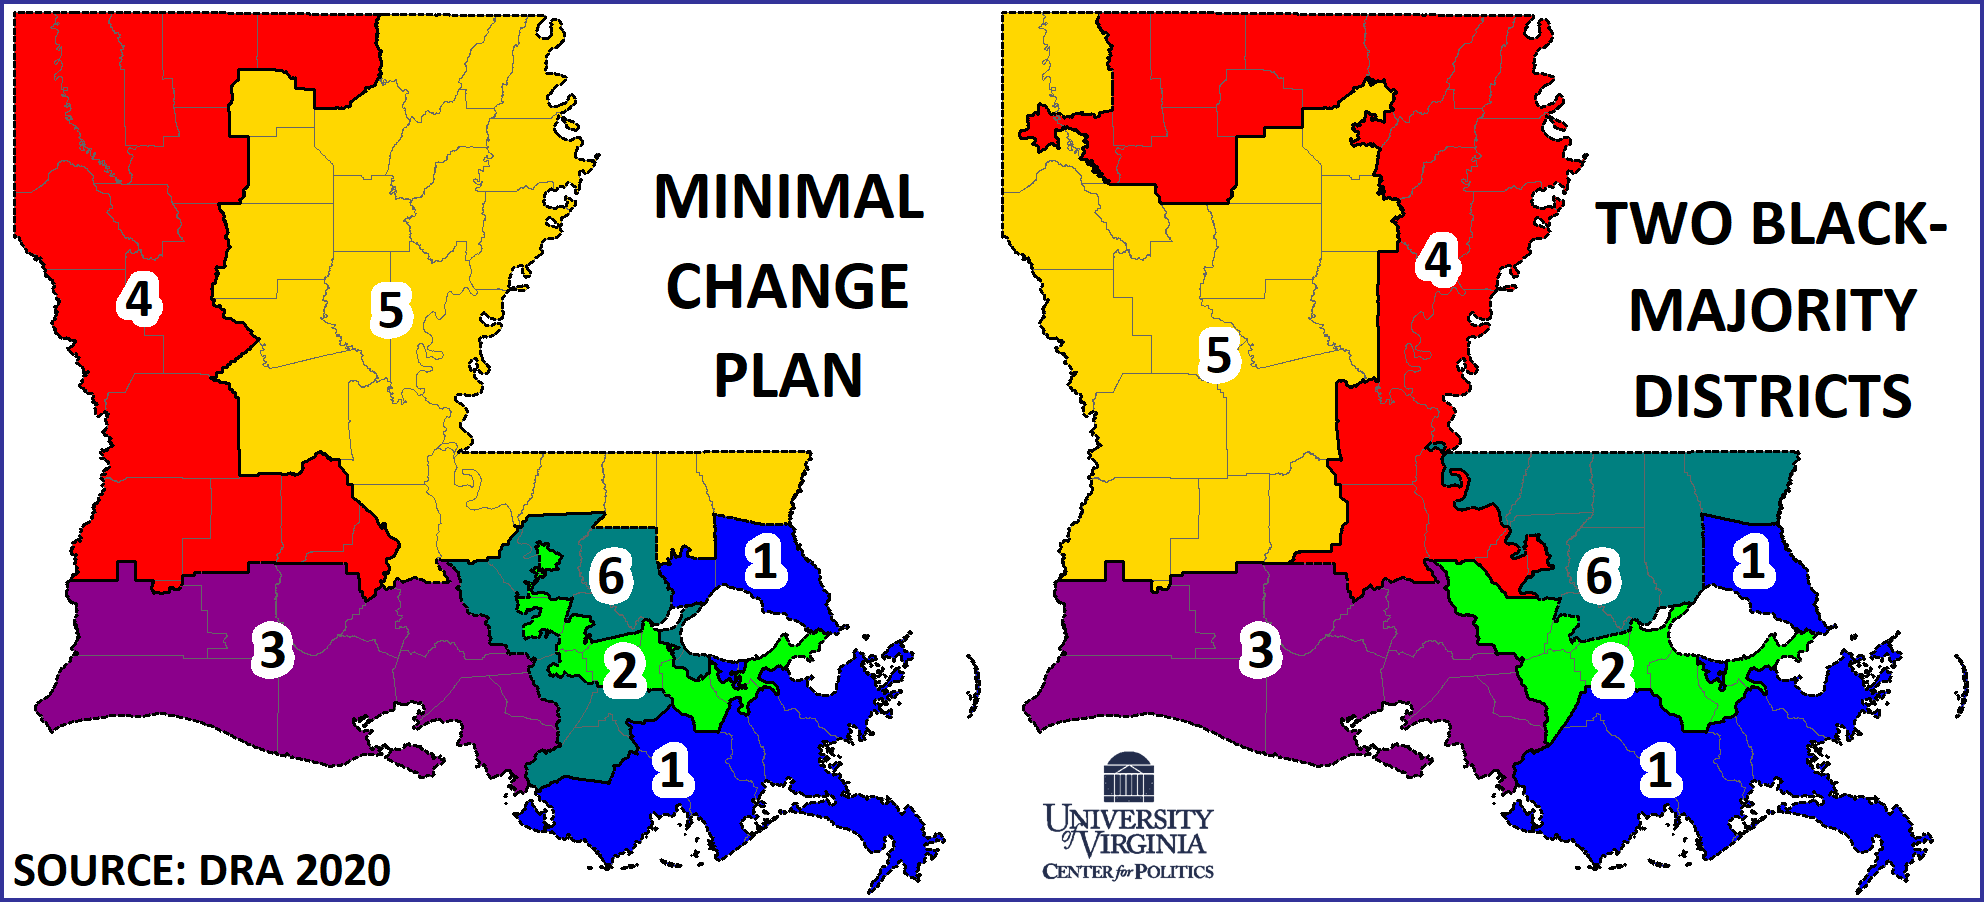
The image on the left is basically indistinguishable from the current plan. The delegation’s newest member, Republican Rep. Julia Letlow, has the slowest-growing district, so her LA-5 expands its holding in what is known as the state’s Florida Parishes, at the expense of LA-6, which retains its Baton Rouge-area orientation.
After the 2010 census, LA-2, which had long been a New Orleans-area seat, was the least populous district in the country — as many of its low-income neighborhoods bore the brunt of Hurricane Katrina’s flooding, its population was down to fewer than 500,000 residents by the end of the decade. To retain its Black-majority status, LA-2 followed the Mississippi River up to Baton Rouge, where it takes most of the state capital’s minority-heavy precincts. As New Orleans has repopulated since 2010, LA-2 sheds a few western precincts, but sees little change. House Minority Whip Steve Scalise’s LA-1 likewise loses a few peripheral precincts, but its focus is still the wealthy New Orleans suburbs, and it holds some swaths of coastal wetlands.
On the right image, a second Black-majority seat is added, running from Baton Rouge up to Shreveport. Though Louisiana had a district with a similar purpose in the early 1990s, the proposed new map is considerably more compact — in fact, this draft only splits seven parishes, down from the current plan’s 15. LA-2, which is knocked down to 53% Black (the existing district is just over 60% Black), would have still given President Biden 68% in 2020, as white New Orleans liberals often vote with minorities for Democrats. But the new LA-4, which has more of a rural component, would be a racially polarized seat: though it should usually lean Democratic, Biden received 55% in this 54% Black seat. In this scenario, Reps. Letlow and Mike Johnson (R, LA-4) would likely run in the new LA-5, or one may retire.
Though a minimum change map seems the more likely outcome, Republicans would, at worst, retain a 4-2 edge in the Louisiana delegation.
MAINE
Number of seats: 2 (no change from 2010s)
Breakdown in 2012: 2-0 D
Current party breakdown: 2-0 D
Most overpopulated district: ME-1 (Portland/Southwest Maine)
Most underpopulated district: ME-2 (Northern Maine)
Who controls redistricting: Split
2012 control: Split
The 2020 presidential election further strengthened the correlation between presidential and U.S. House results. According to Gary Jacobson, a leading U.S. House scholar, there was a .987 correlation between the presidential and House results in 2020 (on a zero-to-one scale), the highest such correlation since at least 1952. Just 16 districts produced a split result for president and for House. One of those handful of districts was in Maine, where Rep. Jared Golden (D, ME-2) won a second term. Golden won by six points against an overmatched opponent while Trump carried his district by almost 7.5 points. In 2022, Golden appears likely to once again face former Rep. Bruce Poliquin (R, ME-2), whom Golden narrowly defeated in 2018. The fate of ME-2 is what’s worth watching in Maine, as the state’s other district, held by Rep. Chellie Pingree (D, ME-1), is safely Democratic.
ME-1, which covers the state’s largest city, Portland, and some tourist-heavy areas along the state’s southern coast, has an above-average rate of four-year college attainment, an important predictor of Democratic trends in recent years. Meanwhile, ME-2 is below-average on college attainment and is more working-class. Due in large part to these demographic differences, Maine’s districts have taken divergent electoral paths.
Since the 1972 presidential election, Maine has allocated its electoral votes by congressional district — during that time, geographically, the two districts have changed little. Table 1 considers presidential elections in Maine since 1972. Into the 1990s, the two were never more than five percentage points apart. The gap widened with the new century, and in 2020, Maine’s two districts were over 30 percentage points apart.
Table 1: Maine elections by congressional district, 1972-2020
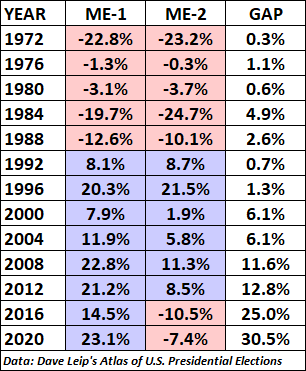
ME-1 casts more votes than ME-2, and it is also growing in population while ME-2 is not. As a result, the 2020 census found that ME-1 needs to give ME-2 roughly 23,000 additional residents. Democrats control state government in Augusta, but they lack the two-thirds majorities needed to control the redistricting process. So we’re not expecting major changes.
The most straightforward way to address the population imbalance between ME-1 and ME-2 could involve Augusta itself. Kennebec County, home of the quaint state capital, is currently the only county in the state divided between the two districts. It would make sense to just alter the lines within the county to balance the populations, perhaps by switching Augusta itself or the city of Waterville to ME-2. Doing so would reduce ME-2’s Trump percentage, but the changes would be measured more in terms of tenths of a percentage point as opposed to full points. In other words, Golden is still going to be defending a Trump-won district.
One positive thing for Golden is that voters in the district still differentiate among different parties in different races: While Golden was winning by six points last November, Sen. Susan Collins (R-ME) won the district by 24 points. But Golden should still be in for a significant test next year.
MARYLAND
Number of seats: 8 (no change from 2010s)
Breakdown in 2012: 7-1 D
Current party breakdown: 7-1 D
Most overpopulated district: MD-4 (Eastern Washington, D.C. suburbs)
Most underpopulated district: MD-7 (West Side Baltimore and suburbs)
Who controls redistricting: Democrats
2012 control: Democrats
Over the past decade, when Democrats complained about gerrymanders in states like North Carolina and Ohio, Republicans, almost without fail, would point to Maryland — and not without good reason. Maryland, with its wiggly lines and barely contiguous districts, has one of the ugliest congressional maps in the country. After 2010, Democrats held a 6-2 advantage in the state’s delegation. As Maryland was one of the few states Democrats had control over a decade ago, they aimed to expand that advantage. The result was a 7-1 map that was passed by the legislature and signed by then-Gov. Martin O’Malley (D-MD).
The enacted plan worked out as intended for the duration of the decade, although MD-6, the seat that Democrats gained in 2012, nearly reverted back to the GOP in 2014. Still, even partisan Democrats often cringe at the map’s odd shapes. MD-3, for example, was drawn for Rep. John Sarbanes — though it was long a Baltimore-area seat, it takes in a part of Montgomery County, in Washington D.C.’s suburbs, and then juts out to grab the state capital, Annapolis. Sarbanes, whose father was a senator, has been rumored to have statewide ambitions himself. By representing such an odd seat, he’s been able to establish himself in disparate corners of the state — something that would serve him well in a state campaign.
Though Gov. Larry Hogan (R-MD) remains popular and has worked to establish an independent commission aimed at drawing fair maps, the reality is that Democrats hold veto-proof majorities in the state legislature, thus giving them redistricting power. In a recent U.S. Supreme Court case, plaintiffs alleged that Maryland’s gerrymandered districts violated the First Amendment rights of its voters. The high court declined to intervene in 2019, ruling that federal courts could not constrain partisan gerrymandering. Maryland’s map was left untouched. Though Democratic mappers will have to draw plans that would satisfy the state Court of Appeals — the highest court in the state, where Republican-appointed judges hold a majority — they otherwise have broad latitude. Still, there is a possibility that the state’s high court could intervene on behalf of Republicans much as Democratic-majority state courts have intervened on behalf of Democrats on redistricting matters in North Carolina and Pennsylvania in recent years.
Democrats could try for an 8-0 monopoly in the delegation by targeting Rep. Andy Harris (R, MD-1), who was the sole Republican from the state elected last decade. A member of the Freedom Caucus, Harris is a strident conservative. Earlier this year, dozens of Democratic state legislators accused him of complicity in the Jan. 6 insurrection — though altering his seat may have already been on their minds, this could be a convenient justification for drawing him out. MD-1 has long been characterized as an Eastern Shore district, but it also includes some suburban counties closer to Baltimore — Harris is from Harford County, in the latter category. The suburban Baltimore component is actually the more Republican-leaning part of the district: Trump carried the Eastern Shore 57%-41% while he took over 60% in the rest of the district.
In any case, the Eastern Shore, with 456,000 residents, has enough population for just under 60% of a district. Mappers could take MD-1 across the Chesapeake Bay Bridge and bring it into Anne Arundel and Prince George’s counties — it could also feasibly take in some Democratic Baltimore-area precincts. So there are a few ways to draw a Democratic-leaning seat that includes the Eastern Shore. The remainder of the current MD-1 — areas like Harford County — could be split among the adjacent Democratic seats.
By composition, Maryland is about 30% Black, and two of its districts currently have Black majorities. Rep. Anthony Brown’s (D, MD-4) seat is based mainly in Prince George’s County, hugging Washington D.C. MD-4 is 53% Black, and will need to shed about 50,000 people. MD-7, which has a Baltimore focus, is the state’s slowest-growing seat and is just over 50% Black — Baltimore City lost population over the past decade. Rep. Kweisi Mfume (D, MD-7) is on his second congressional tour: He represented the seat from 1987 to 1996, then was replaced by the noteworthy Rep. Elijah Cummings. When Cummings died in 2019, Mfume defeated his successor’s widow to regain the seat. MD-7 will need to pick up about 50,000 residents — to sustain its slim Black majority, it could add some heavily minority precincts. This may make it harder for Democrats to shore up adjacent Reps. John Sarbanes and Dutch Ruppersberger, especially if Democrats also opt to make Harris’s seat bluer.
Though it is possible to draw a third Black-majority seat, MD-5 may soon elect a Black member anyway. MD-5, which pairs a significant chunk of Prince George’s County with southern Maryland, is just over 40% Black and is held by House Majority Leader Steny Hoyer (D, MD-5) — originally elected in 1981, Hoyer is one of the longest-serving members in state history. In the 2016 Democratic primary for Senate, then-Reps. Chris Van Hollen and Donna Edwards faced off. Though Van Hollen won the primary by 14 points, Edwards, a progressive Black woman, carried MD-5 by a 50%-41% margin. It probably helped that Edwards was from the adjacent MD-4, but it is not hard to see a Black candidate winning an open-seat primary in MD-5. At 82, it seems likely Hoyer will retire sometime over the next few cycles — in his 2020 primary, he received some opposition, though still won with over 60%.
In the Washington D.C. suburbs, Montgomery County, with a population of over a million people, is the state’s largest county. While Sarbanes’ MD-3 has a small part of it, the county is otherwise split between Democratic Reps. David Trone’s MD-6 and Jamie Raskin’s MD-8 — while both districts include some less populous counties, they are both comfortably blue most of the time, although Democrats may want to shore up MD-6, considering their close call in 2014.
Overall, drawing an 8-0 map is probably doable for Democrats, though getting enough incumbents on board, and ensuring that each district is adequately blue, may be tricky. If Democrats opt for another 7-1 plan, it seems likely they’ll simply clean up the current map.
MASSACHUSETTS
Number of seats: 9 (no change from 2010s)
Breakdown in 2012: 9-0 D
Current party breakdown: 9-0 D
Most overpopulated district: MA-7 (Boston)
Most underpopulated district: MA-1 (Western Massachusetts)
Who controls redistricting: Democrats
2012 control: Democrats
Heavily Democratic Massachusetts is the biggest state in which one of the two major parties is completely shut out of the U.S. House delegation. In fact, Republicans have not won a House election in the Bay State since 1994. Even more strikingly, none of the districts are even particularly close: The closest district based on the 2020 presidential results was the Cape Cod-based MA-9 held by Rep. Bill Keating (D), which Biden still won by nearly 18 points. And all nine districts each gave double-digit margins to the Democratic presidential nominee in 2012, 2016, and 2020. A Republican has not won one of the state’s 14 counties for president since 1988, which helps demonstrate the party’s weakness throughout the state. In 2012, Republicans did come close to beating then-Rep. John Tierney (D, MA-6), who was hurt by his family’s legal problems. But Tierney lost a primary to now-Rep. Seth Moulton (D, MA-6) in 2014, and Moulton has solidified Democratic control of the district.
While Massachusetts does have a Republican governor, Charlie Baker, Democrats hold veto-proof majorities in the state legislature. After having to eliminate a district a decade ago, the legislature’s job is easier this time. Its main job will be adding about 50,000 residents to Western Massachusetts’ MA-1, held by senior Democrat Richard Neal.
The bottom line is that if there is a very competitive House race in Massachusetts in November 2022, something will have gone terribly wrong for Democrats.
MICHIGAN
Number of seats: 13 (-1 from 2010s)
Breakdown in 2012: 9-5 R
Current party breakdown: 7-7 Split
Most overpopulated district: MI-11 (Detroit suburbs/exurbs)
Most underpopulated district: MI-5 (Bay City/Flint/Saginaw)
Who controls redistricting: Commission
2012 control: Republicans
In both the 2000 and 2010 round of redistricting, Michigan Republicans, who controlled the process, drew maps that Democrats decried as partisan gerrymanders. Though the current map worked as intended for Republicans during much of the past decade, Democrats gained two suburban seats in 2018 to produce a tied 7-7 delegation, and they held them last year.
Aside from altering the composition of the congressional delegation in 2018, Michigan voters made another critical change: in a 61%-39% vote, they approved a referendum that established an independent commission for redistricting. The 13-member commission is made up of four Democrats, four Republicans, and five independents — the final maps need seven votes to pass, with two members of each group supporting the plan. Commissioners began the drafting process last week, and have been instructed to keep criteria such as compactness and minority representation in mind.
Because of the nature of the commission, it’s hard to tell what the final map may end up looking like, though we can make a few inferences. Earlier this month, commissioners put out a plan that divided the state into 10 regions (Map 6).
Map 6: Michigan commission-defined regions
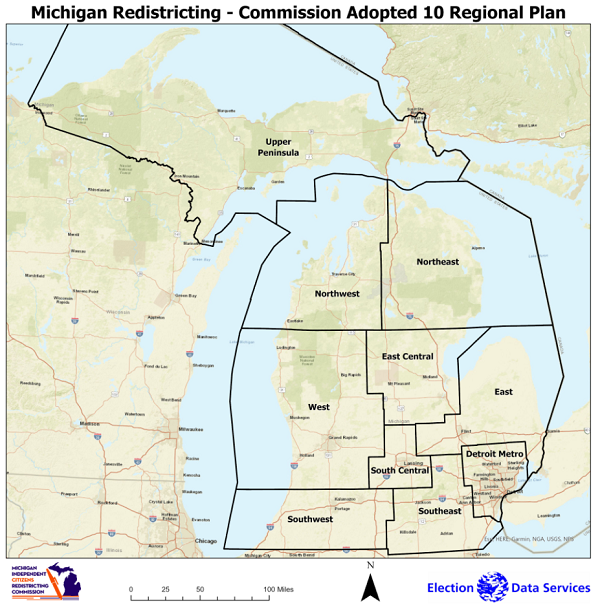
If the commission uses this plan to inform the congressional map — and this is a big if — it likely spells bad news for Rep. Dan Kildee (D, MI-5), as his Genesee County (Flint) home base is grouped with the heavily GOP thumb region: a Flint + Thumb district would have tracked closely with the state in 2008 and 2012, but would have supported Trump by double-digits twice. An ideal plan for Kildee would keep Flint with Bay City: such a district would lean Democratic, but not overwhelmingly. Conversely, two-term Rep. Elissa Slotkin (D, MI-8) may benefit if the commission sticks to its regional approach and separates heavily GOP Livingston County out from Ingham County (Lansing).
Elsewhere in the state, Kalamazoo County could continue to anchor a Republican-leaning district in the commission’s southwest region, as the counties that make up the region account for almost exactly a congressional district’s worth of population. MI-1, which includes the Upper Peninsula, will likely expand but remain heavily GOP — there are some pro-Democratic trends in the Grand Traverse region, but the seat is otherwise safe. Similarly, a Republican-leaning seat in the central part of the state seems likely (on the current map, MI-4 would be the closest thing to this).
Democrats have made major inroads in Grand Rapids area. A generation ago, heavily Dutch western Michigan was the most GOP area of the state. If the commission prioritizes compactness or preserving communities of interest, it seems likely that Kent County (which houses Grand Rapids and is the most populous county in the current MI-3), will continue to be the centerpiece of a district. Still, this would not constitute an automatic Democratic flip. Though Biden carried Kent County 52%-46%, presidential trends have not fully trickled down the ballot: Sen. Gary Peters (D-MI) narrowly lost it last year. Moreover, Kent County itself only accounts for 85% of the population of a congressional district: the successor to the current MI-3 will likely retain some of the red turf that surrounds the county. Still, if the commission aimed to create a map that prioritized partisan fairness, a district that links Grand Rapids with Kalamazoo would be possible. Rep. Peter Meijer (R, MI-3), a Trump critic, holds the district now, and while he could be vulnerable in a primary, he could very well be stronger than the average Republican in a general election.
The commission’s “Detroit Metro” region contains enough residents for almost exactly five congressional districts. As it is, districts 13 and 14, which contain parts of Detroit proper, are each 57% Black by composition — they are currently held by Democratic Reps. Rashida Tlaib (D, MI-13) and Brenda Lawrence (D, MI-14). Though Rep. Debbie Dingell’s (D, MI-12) current district is split between Ann Arbor and some working-class communities just south of Detroit, she is from the latter and will probably run in a Wayne County seat. North of Detroit, Reps. Andy Levin (D, MI-9) and Haley Stevens (MI-11) will probably run in districts that include suburban Oakland County.
Overall, there is a lot of uncertainty in Michigan. It will have 13 seats at the start of the next Congress, and could realistically elect anything from an 8-5 Republican to an 8-5 Democratic delegation.
MINNESOTA
Number of seats: 8 (no change from 2010s)
Breakdown in 2012: 5-3 D
Current party breakdown: 4-4 split
Most overpopulated district: MN-3 (Western Twin Cities suburbs)
Most underpopulated district: MN-7 (Western Minnesota)
Who controls redistricting: Split
2012 control: Split
The potential for drama in Minnesota redistricting was drastically reduced when the census apportionment preserved the state’s 8th U.S. House district. Many projections suggested the state would lose a seat, which would have necessitated a much more dramatic redistricting than is now required. As it was, Minnesota barely hung on by getting the 435th seat awarded in the reapportionment process (Minnesota also won the 435th seat a decade ago).
The Land of 10,000 Lakes illustrates as well as any other state the trends in House districts over the past decade.
In the first election of the past decade, 2012, Democrats won a 5-3 edge in the state’s delegation by retaking MN-8, a geographically large district that covers the state’s Iron Range in the northeastern tip of the state. Rep. Jim Oberstar (D) first won the district in 1974, and he easily won reelection until losing in 2010 — a preview of the rightward turn the white working-class district would take in the years to come. In 2008, MN-8 voted for Barack Obama by eight points, basically the same as John Kerry’s victory there in 2004 — this despite Obama running about 10 points ahead of Kerry’s national margin in 2008. There are a lot of examples of places where Obama ran behind Kerry or did no better than Kerry that would later shift strongly to Donald Trump in 2016 and 2020. Democrats did rebound and win MN-8 in 2012, 2014, and 2016, but Republicans won it as an open seat in 2018 and easily held it last year.
Democrats also lost two other geographically large districts where Trump performed markedly better than Mitt Romney had in 2012, MN-1 in southern Minnesota and MN-7 in western Minnesota, in 2018 and 2020, respectively. Former Rep. Collin Peterson (D, MN-7) finally was washed away by the Republican tide in his district in 2020, as he lost by a double-digit margin while Trump was once again carrying his district by roughly 30 points. Peterson was a major outlier in the House prior to his loss: No other member held any district that the other party had won by even 20 points for president, let alone 30.
Meanwhile, in 2018, Democrats captured two Republican-held districts in the orbit of Minnesota’s Twin Cities: MN-3 in the western Minneapolis suburbs and MN-2, which extends south and east from St. Paul.
These results had the effect of sorting out Minnesota’s House districts along presidential lines. In 2016, Republicans held MN-3 despite it voting for Hillary Clinton, and they also held MN-2 as it narrowly backed Trump (the district would swing to Biden in 2020). Meanwhile, Democrats held MN-1, MN-7, and MN-8 even as Trump carried all three by double digits. By 2020, Republicans had captured all three districts. So after featuring four “crossover” House districts as recently as 2016, Minnesota now has none: Democrats hold the four Biden districts, and Republicans hold the four Trump districts. This transition is shown in Map 7.
Map 7: Minnesota House/presidential voting, 2016 vs. 2020
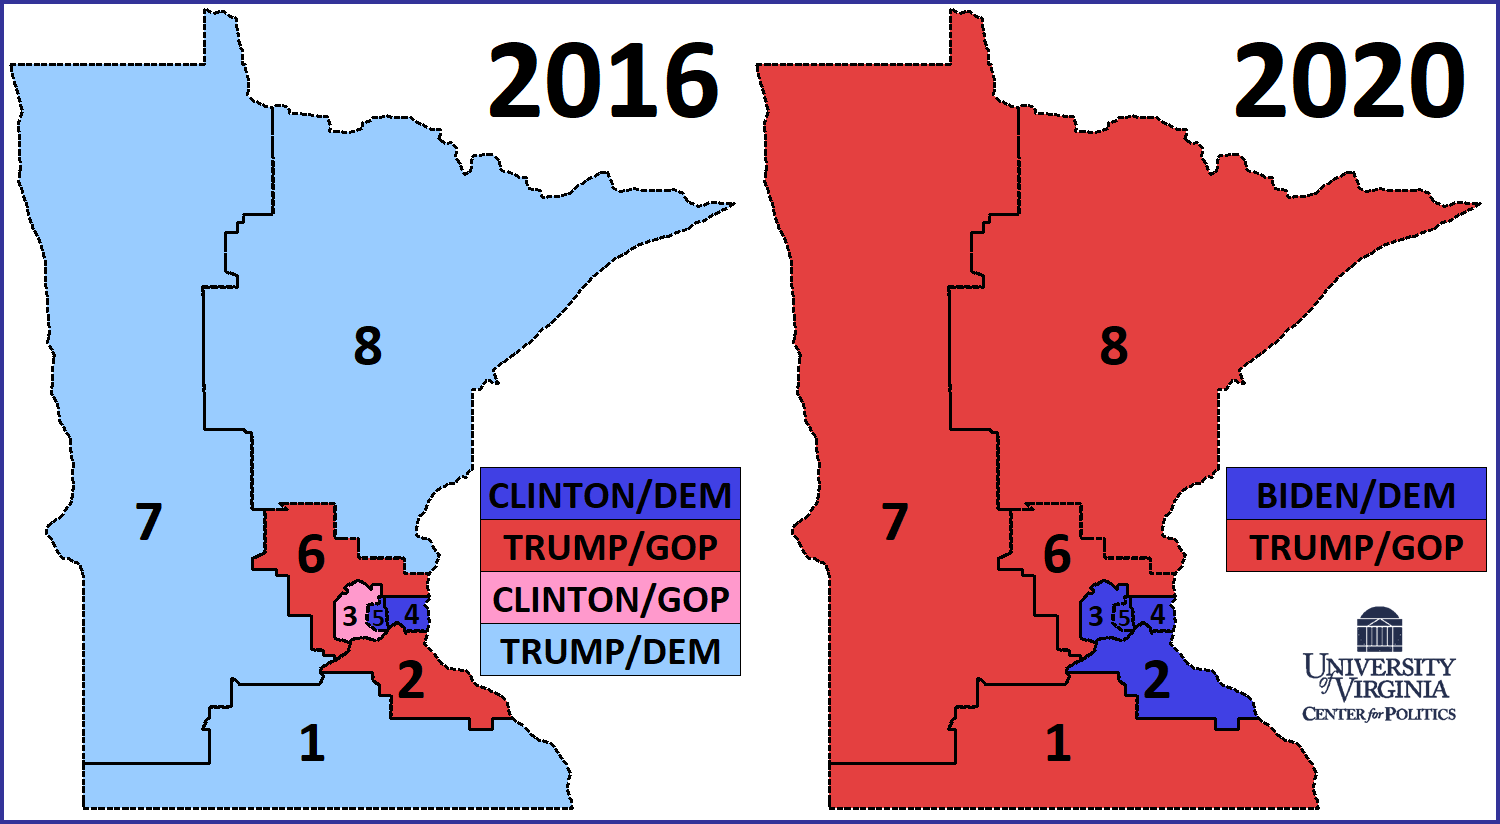
For the past several decades, redistricting in Minnesota has ended up in the courts, and that very well could be the case again. Republicans surprisingly retained control of the state Senate last year — one of a long list of Republican state legislative success stories across the country in 2020 — while Democrats hold the state House and the governorship. As is the case in many other parts of the country, Minnesota’s rural districts are growing more slowly than its districts closer to the Twin Cities: newly-Republican MN-1, MN-7, and MN-8 are all underpopulated and will need to take on additional turf, while the five districts closer to Minneapolis/St. Paul — Democratic seats MN-2, MN-3, MN-4, and MN-5 along with Republican-held MN-6 — all are overpopulated and therefore need to shed population. Assuming the two parties can’t agree on a map, we could see a court simply tweaking the lines to adjust for population disparities, which likely wouldn’t alter the underlying dynamics too much.
Barring major changes, the district to watch in Minnesota is MN-2, held by Rep. Angie Craig (D). It featured the closest race in the state in 2020, as Craig won by two points over veteran Tyler Kistner (R), who is running again in 2022. Biden won the district by seven points, but Craig ran behind Biden and also lost some votes to a deceased pro-marijuana candidate, the death of whom almost delayed the election for the seat. A few months ago, we sketched out a scenario in which Craig could get a better district while Rep. Jim Hagedorn (R, MN-1) could also be made safer (he only won by three points last year, running several points behind Trump in terms of margin). But we suspect Republicans might not want to make consequential trades between MN-1 and MN-2, as Hagedorn is likely less vulnerable in the context of 2022 than Craig is. See that article for more on the dynamics.
MISSISSIPPI
Number of seats: 4 (no change from 2010s)
Party breakdown in 2012: 3-1 R
Current party breakdown: 3-1 R
Most overpopulated district: MS-4 (Gulf coast)
Most underpopulated district: MS-2 (Jackson/Delta)
Who controls redistricting: Republicans
2012 control: Split
Mississippi, with its four districts, may be one of the more uneventful redistrictings of this cycle. In 2011, with a Republican state Senate and a Democratic state House, legislators couldn’t agree on a plan. When a panel of three federal judges stepped in, they produced a plan largely similar to the existing map. Though Republicans control the process this cycle, there may likewise be little appetite for major changes.
To start, Democratic Rep. Bennie Thompson’s 2nd District is protected by the Voting Rights Act. Two-thirds Black by composition, it includes much of the Delta region, and almost all of Jackson’s Hinds County. Due to population losses in the rural areas, MS-2 will need to pick up about 50,000 residents; reaching further down the Louisiana border to take in the trio of Adams, Franklin, and Wilkinson counties would basically accomplish this, along with some minor tweaks in the Jackson area.
Assuming the changes to MS-2 are minimal, the other three districts should be fairly straightforward. The most overpopulated district is MS-4, which has seen an influx of residents to its Gulf Coast communities. MS-4 routinely gives Republican presidential nominees close to 70% of the vote.
Moving north, MS-3 is a wide swath of central Mississippi. Rankin County, a solidly red county that includes parts of suburban Jackson, is MS-3’s most populous county, though it only accounts for 20% of the district population — the balance comes from about 20 counties that are generally more rural.
Lastly, MS-1 is essentially coterminous with the northeastern corner of the state. Though MS-1 is the state’s second most Republican district (after MS-4), some of its counties are exhibiting divergent trends. Though DeSoto County, which borders Memphis, TN and is growing more suburban, still gave Trump 61% last year, it saw a 10% swing to Biden — the largest shift, in either direction, in the state. A few miles to the east, Benton County, which is 35% Black, was a rare county that flipped from McCain in 2008 to Obama in 2012. That Trump then carried it by double-digits in both 2016 and 2020 shows the struggles that Democrats have faced in parts of the post-Obama South.
While it’s possible to draw two majority-minority districts in Mississippi, any reasonably clean iterations of such districts would only be slightly above 50% Black. Given the highly polarized racial patterns in Mississippi, in a bad year for Democrats, the minority-backed candidate may not be guaranteed victory. It is also questionable whether Thompson would be on board with taking on a significantly more competitive seat, and the Republicans who control the process wouldn’t want to do that anyway.
MISSOURI
Number of seats: 8 (no change from 2010s)
Party breakdown in 2012: 6-2 R
Current party breakdown: 6-2 R
Most overpopulated district: MO-3 (St. Louis exurbs/Jefferson City)
Most underpopulated district: MO-1 (St. Louis proper)
Who controls redistricting? Republicans
2012 control: Split
In Missouri, redistricting may be more straightforward this cycle than a decade ago. In 2011, as the state lost a seat, a Republican-controlled legislature overrode the veto of Gov. Jay Nixon (D-MO), with help from a handful of Democrats, to pass a plan favorable to then-Rep. Lacy Clay (D, MO-1) and Rep. Emanuel Cleaver (D, MO-5). While those two Democrats were given comfortable seats, another Democrat, then-Rep. Russ Carnahan, saw his MO-3 dismantled, and six Republican seats were preserved.
The first goal of Missouri Republicans this cycle will be to strengthen five-term Rep. Ann Wagner (R, MO-2). The majority of MO-2 comes from St. Louis County, while it takes in about half of St. Charles County, to the north, and a few more working-class neighborhoods of Jefferson County, to the south. From 2012 to 2016, Wagner won by over 20% each cycle. In 2018, Democrats saw some positive signs in the district: though then-Sen. Claire McCaskill (D-MO) was ousted, she carried MO-2 by about 2.5 points, and Wagner was held to a 51%-47% margin.
Encouraged by the close 2018 race in MO-2, Democrats landed a strong recruit in state Sen. Jill Schupp for the 2020 cycle. But in the suburbs, most non-incumbent (and many incumbent) Democrats ran behind Biden — this was the case in St. Louis. As Trump narrowly held the seat (it was split almost exactly 50/50), Wagner won by a 52%-46% margin. This was an impressive showing, to be sure, but it was not the type of landslide margin that defined Wagner’s earlier races.
Population dynamics will make the GOP mappers’ jobs easier: next door, MO-1, held by first-term Democratic Rep. Cori Bush, will need to pick up nearly 50,000 residents. This shrinking majority-minority seat can expand to take in Democratic-leaning precincts from MO-2. While it may be hard to sustain MO-1 as a true Black-majority seat (our estimates show that it will likely fall to about 49% Black, by composition), it is not in the GOP’s interest to radically alter it.
Though MO-2 can easily pick up redder rural areas, Wagner may want the district to retain its St. Louis-area focus, as too much new territory may give an opening to a primary challenger. Map 8 shows a potential new MO-2: like the 2002 to 2010 version of the district, it reaches back up to Lincoln County. About 60% of the hypothetical MO-2 is in Wagner’s existing seat, and McCaskill would have lost it by over six points.
Map 8: Hypothetical Republican MO-2 gerrymander

On the other side of the state, Republicans could theoretically target Cleaver, in the Kansas City area — in fact, to its south, both the ruby red MO-4 and MO-7 are open seats (their incumbents are each running for Senate), so legislators could move more Democrats into those seats without having to worry about protests from incumbents. Unlike MO-1, MO-5 is majority-white, so racial considerations would take on less salience. Still, Cleaver, as demonstrated during the last round of redistricting, seems to have a good enough rapport with the legislature, and Republicans could choose to turn his MO-5 into more of a Democratic vote sink. This is one of several blue islands in otherwise Republican states to watch as a measure of how collectively aggressive Republican gerrymandering efforts are.
While Missouri voters approved some redistricting-related changes in 2018 and 2020, congressional redistricting will still be controlled by legislative Republicans, although legislative redistricting will be handled by a bipartisan commission.
MONTANA
Number of seats: 2 (+1 from 2010s)
Party breakdown in 2012: 1-0 R
Current party breakdown: 1-0 R
Most overpopulated district: N/A
Most underpopulated district: N/A
Who controls redistricting: Commission
2012 control: N/A
For Montana, 2022 will mark a return to the 1980s: after a 30-year hiatus, the state’s 2nd District will be making a return. Montana was admitted to the Union in 1889, and for the first two decades of statehood, it sent one at-large member to the House. Then, after the 1910 census, it was awarded a second district, which it kept until the 1990 census.
Historically, Montana’s politics fell along an east-versus-west axis: ranchers, who settled the east, favored Republicans while the west, where the mining industry gave way to a tradition of organized labor, favored Democrats. The state’s 1990 congressional results — this was the last year before it went down to one seat — reflected this split. In MT-1, then the western seat, Democratic Rep. Pat Williams had an unshakable rapport with the state AFL-CIO, while out east, MT-2’s Rep. Ron Marlenee was a mainstream Republican who tended to agricultural interests. Though Williams won the contest for the at-large seat in 1992, he retired in 1996, and Republicans have held the seat since.
Though Republicans captured the governor’s mansion last year to claim a governmental trifecta, redistricting in the state is handled by a bipartisan commission. If Republicans had sole control over the process, they’d probably favor two districts running horizontally across the state — this way, both districts would be fairly reflective of the statewide vote, and would thus be reliably Republican.
The commission could theoretically take a similar approach, but given the state’s cultural and political history, an east/west pair seems more logical. Essentially, any western district that contains the cities of Missoula and Butte would, in all likelihood, have favored Trump last year by single-digits, though such a district may be open to down-ballot Democrats. Virtually any eastern seat would be notably redder than the state as a whole.
Conveniently for the GOP, an east/west split could very well precipitate a two-Republican delegation. Republican Rep Matt Rosendale, who was elected to the at-large seat last year, is from Dawson County, which is just miles from the North Dakota border — he could easily win an eastern seat. Former Rep. Ryan Zinke, who represented the state for a term before serving as former President Trump’s Interior Secretary, is eyeing a comeback. Zinke hails from Flathead County, which is not far from the Idaho border, and would be a formidable candidate for a western district.
So the bottom line for Montana is that, an eastern district would start out as Safe Republican while the Crystal Ball would probably rate a western-based seat as Leans or Likely Republican.
NEBRASKA
Number of seats: 3 (no change from 2010s)
Party breakdown in 2012: 3-0 R
Current party breakdown: 3-0 R
Most overpopulated district: NE-2 (Omaha)
Most underpopulated district: NE-3 (Rural west)
Who controls redistricting? Republicans
2012 Control: Republicans
In Nebraska, the unicameral legislature is nominally nonpartisan, but it’s generally considered that a clear majority of its members lean Republican. Though a status quo map may ultimately get passed, presidential politics may weigh on the minds of legislators: Nebraska, along with Maine, is one of two states that allocate its electoral votes based on congressional-level returns.
One of the biggest surprises of the 2008 election was that then-candidate Barack Obama carried the Omaha-based NE-2. During the redistricting process, the legislature tinkered with NE-2’s borders, so that the new seat would have given Obama a reduced margin in 2008, but the district was still one mostly based in Omaha’s Douglas County. In 2012, as Obama lost Douglas County overall by three points, NE-2 wound up in Mitt Romney’s column. Though Hillary Clinton carried Douglas County by two points in 2016, the district contains a chunk of neighboring Sarpy County, to the south — these precincts are redder and provided Trump’s 47%-45% margin in the district. But by 2020, powered by gains with college-educated whites in Omaha, Biden carried the district by almost seven percentage points.
Though Biden carried NE-2, Rep. Don Bacon (R, NE-2) held on by a similar margin — he was also a survivor of the 2018 Democratic wave. Though Bacon has generated impressive crossover support in recent cycles, if mappers want to keep Douglas County whole, it will be hard to shore him up. Douglas County alone now makes up about 87% of a full district, up from 85% last decade — so to meet the population requirement, the legislature would have to append fewer red precincts from Sarpy or any other adjacent county. Under an aggressive plan, Omaha’s majority-minority precincts could be moved into other districts, creating a Trump-won NE-2, but such a plan may trigger litigation.
Out west, Nebraska’s 3rd, like Kansas’s 1st, is a geographically vast seat that has been steadily depopulating. As an aside, though it is solid red today, NE-3 saw competitive races in three of the last four instances it was open. In 1974, when the GOP faced backlash over Watergate, Virginia Smith held the seat by just half a point — when she retired, in 1990, as their statewide candidates were running well, Democrats came up only 2% short in NE-3. Current Rep. Adrian Smith (R, NE-3) won the seat 55%-45% in 2006, as then-President Bush carried it 3:1 two years earlier. Though once elected, each of its Republican members became entrenched, they fought their races on expanding terrain: when Virginia Smith was first elected, NE-3 only extended a few counties east of Grand Island, the largest city in the district — it now shares borders with Iowa and Missouri.
In between districts 2 and 3, NE-1 will have to shed a few thousand residents. As it is, about half the district comes from Lancaster County, which includes the state capital, Lincoln. Romney and Clinton each carried the county by a few hundred votes apiece, but Biden’s nearly 8-point margin there was the best showing for a Democrat since Lyndon Johnson. Still, the rest of NE-1 is overwhelmingly GOP, and any similar district would likely favor Trump by anywhere from 12 to 15 percentage points. If the legislature cracks Douglas County, mappers would be wise to avoid putting too many Democrats in NE-1.
So in Nebraska, the big question seems to be whether or not Douglas County gets cracked. The legislature could theoretically create three Trump-won seats, but if Democrats come to view a redrawn NE-2 as a lost cause, Nebraska may become completely irrelevant in presidential politics. One other wrinkle in Nebraska is that Republicans do not quite have the two-thirds legislative majority required to override a Democratic filibuster, which Democrats could use to try to combat a Republican gerrymander.
NEVADA
Number of seats: 4 (no change from 2010s)
Party breakdown in 2012: 2-2 split
Current party breakdown: 3-1 D
Most overpopulated district: NV-3 (Southern Clark County)
Most underpopulated district: NV-1 (Las Vegas)
Who controls redistricting: Democrats
2012 control: Split
Compared to the post-2010 round of redistricting, Democrats have gained control of Nevada, but probably aren’t in a position to add more seats. Ten years ago, with a Democratic legislature and a Republican governor, a panel of three special masters were tasked by a judge to draw the lines. At the time, the state was adding a fourth seat, which most observers expected to lean Democratic, which ended up being the case.
In 2011, the court-ordered plan kept a heavily Democratic Las Vegas seat, a GOP-leaning northern seat, and retained a swingy seat in Las Vegas’ southern suburbs. The new seat, NV-4, was added in the northern Las Vegas area, and included a sampling of rural “cow counties.”
Though Democrats, as expected, won the new NV-4 in 2012, it became something of a cursed seat. Then-state Sen. Steven Horsford, a Democrat, was elected as its first member. Then, as the red wave of 2014 hit Nevada especially hard, Horsford lost to then-state Assemblyman Cresent Hardy, a Republican. Hardy was defeated himself the next cycle by Democratic state Sen. Ruben Kihuen. Faced with sexual misconduct allegations, Kihuen did not run again in 2018. Horsford made a comeback in 2018, beating Hardy by a 52%-44% margin in a rematch that year. Horsford was reelected in 2020, though by a closer 51%-46% vote — this was the first cycle since its establishment that NV-4 reelected its incumbent.
Going into last round’s redistricting cycle, Republicans held NV-3 with then-Rep. Joe Heck (R, NV-3), a first-term member who, on the campaign trail, emphasized his Army service. In 2010, Heck narrowly won his seat by defeating Rep. Dina Titus (D, NV-3), in what was, at the time, the most populous congressional district in the nation. When Heck ran for Senate in 2016, he lost to now-Sen. Catherine Cortez Masto (D-NV), and was replaced by Democrat Jacky Rosen, a first-time candidate. Rosen successfully made the jump to the Senate in 2018, and Susie Lee (D) — who had lost a primary for NV-4 in 2016 — held NV-3. Lee was reelected in 2020, though by only three percentage points.
Shoring up the 3rd District will almost certainly be a priority for Democrats. As it is, NV-3 is among the most closely divided districts in the county: at the presidential level, it supported Barack Obama in 2012, Donald Trump in 2016, and Joe Biden in 2020, but none of its winners cleared 50% of the vote.
As Map 9 shows, Democrats could unpack NV-1, which is a reliably blue seat that encompasses downtown Las Vegas. After her loss to Heck, Titus switched districts and made a comeback in NV-1. Titus’ district gets slightly redder, compared to the current map, but Lee and Horsford are each given friendlier seats. Within Clark County, aside from a few larger cities, municipal splits are minimized in Map 9. Much of Las Vegas is in NV-1, NV-4 includes almost all of the more Democratic-leaning North Las Vegas, and NV-3 takes in all of Henderson, the county’s fastest growing, though still GOP-tilting, suburb.
Map 9: Hypothetical 3-1 Democratic Nevada map
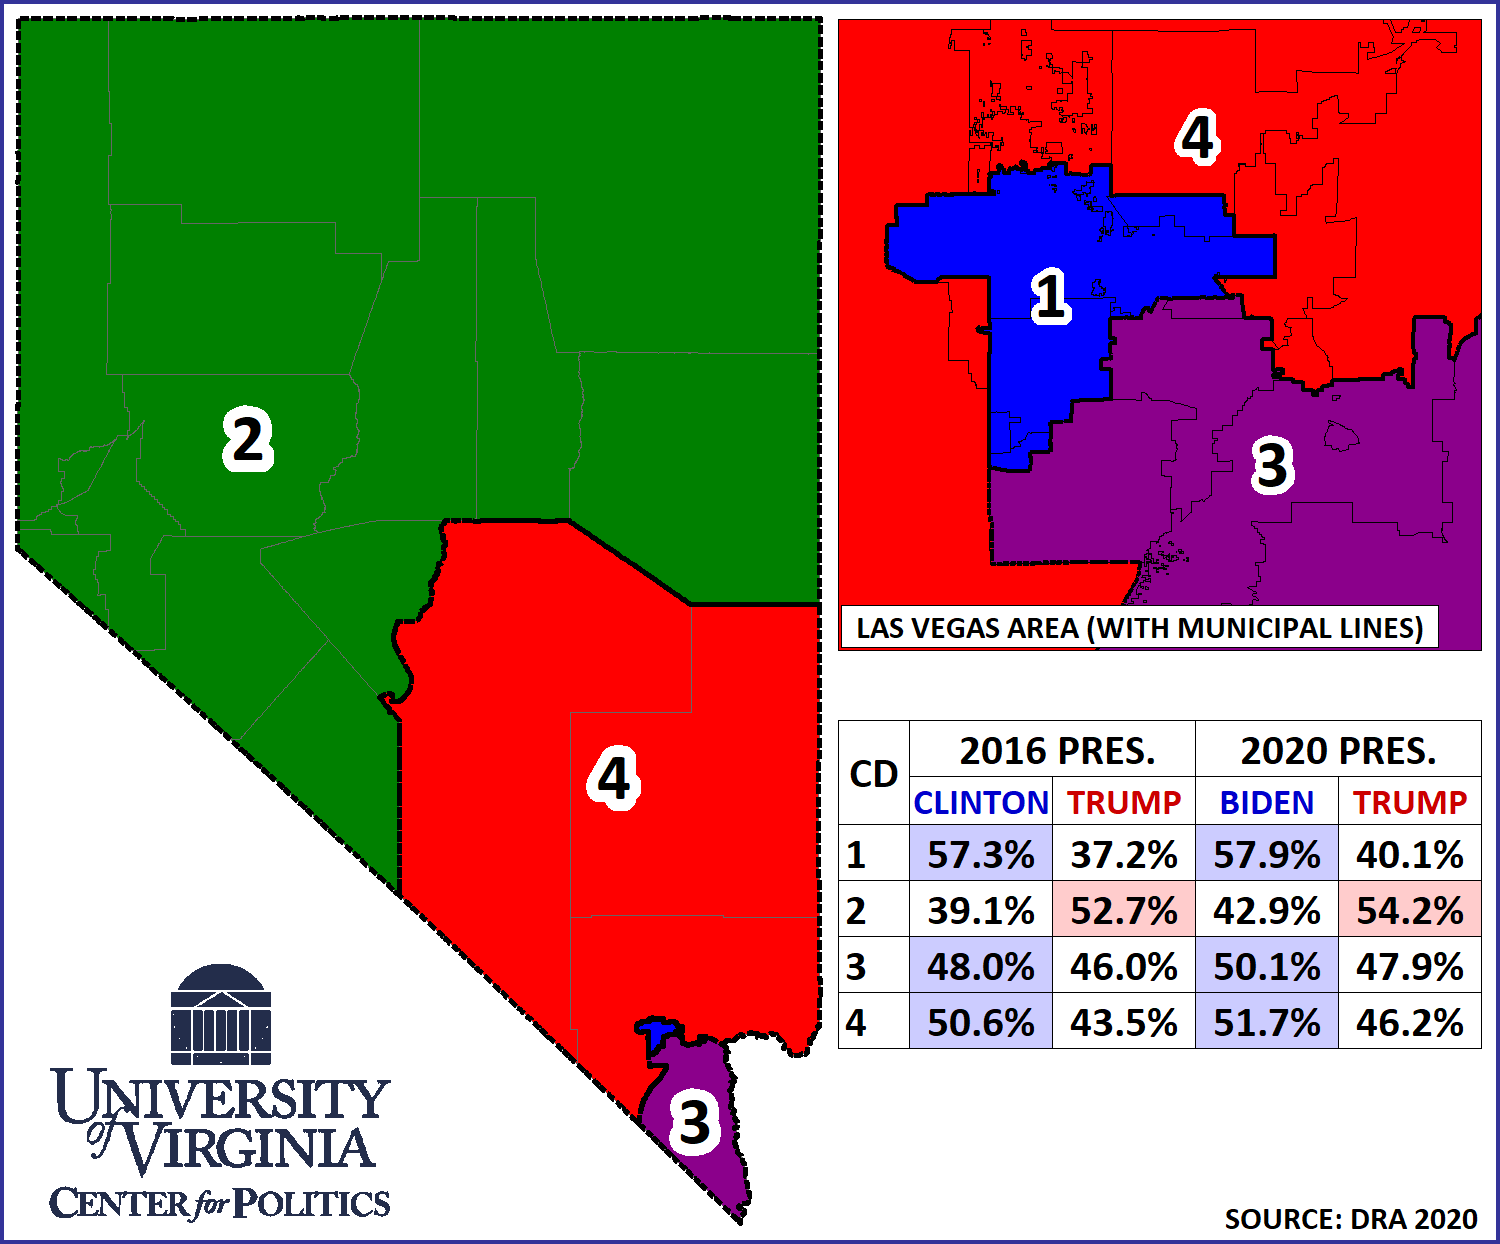
On Map 2, Rep. Mark Amodei (R, NV-2), the sole Republican in the delegation, retains a favorable seat — his NV-2 has never sent a Democrat to Congress. Though his district includes Reno, a source of Democratic votes, mappers may be reluctant to draw a Las Vegas-based district that snakes up the California border just to grab some blue Reno precincts. In that scenario, the redder precincts in NV-2 would also have to go somewhere, and it’s likely they’d be put into a safely Republican seat anyway — so Map 9 essentially shows a cleaner 3-1 Democratic plan: NV-3 remains a swing seat (as does NV-4, to a lesser extent), but NV-3 flips from having voted for Trump in 2016 to narrowly voting for Hillary Clinton.
Though it’s possible to draw four Biden-won seats in Nevada, each district would track closely with the statewide vote — so no single district would be a slam dunk for Democrats. In a red enough cycle, four marginally Democratic seats could all potentially elect Republicans.
As veteran state journalist Jon Ralston sums up, though Democrats hold the redistricting pen, pleasing all three of their incumbents may be tricky. While Democrats could certainly come up with something more aggressive than Map 9’s plan, Lee and Horsford seem likely to get, at least, a slight boost.
NEW HAMPSHIRE
Number of seats: 2 (no change from 2010s)
Breakdown in 2012: 2-0 D
Current party breakdown: 2-0 D
Most overpopulated district: NH-1 (Manchester/Eastern New Hampshire)
Most underpopulated district: NH-2 (Western New Hampshire)
Who controls redistricting: Republicans
2012 control: Split
Landmark U.S. Supreme Court decisions in the early 1960s enshrined the concept of “one person, one vote” into congressional redistricting, which created the now-familiar rhythm of redistricting following the release of the decennial census. The first full national redistricting cycle following a census release was in advance of the 1972 election, and there have been full redistricting cycles at the start of every decade since. But prior to those decisions, some states redistricted very infrequently. New Hampshire is an extreme example: The state had the same congressional district lines in place from the early 1880s all the way until the late 1960s.
Still, the lines have only barely changed in recent decades. NH-1 covers some of the eastern part of the state, including Manchester, Portsmouth, and Dover, while NH-2, which has the city of Nashua, covers the rest of the state. In the 1880s, mappers — the state was then controlled by Yankees with GOP loyalties — put Manchester and Nashua in separate districts to dilute the growing white ethnic/Catholic vote, which tended to go Democratic. Today, both districts are winnable by either party under the right circumstances, but Democrats have held the more Democratic western seat (Biden +8.7 in 2020) since 2012 and the more competitive NH-1 since 2016 (Biden +6).
New Hampshire has been the most Republican state at the presidential level in New England for a half-century: The last time any of the region’s six states gave the Republican presidential nominee a better margin than New Hampshire was way back in 1968 — that was Vermont, a traditionally Republican state that has become extremely Democratic at the federal level in recent decades.
That said, New Hampshire has not voted Republican for president since 2000. This Democratic trend is reflected in the state’s delegation to Congress, which is all Democratic (two senators and two House members). But the state’s Republican tradition is alive and well at the state level, as Gov. Chris Sununu (R) won reelection last year in a landslide, aiding a Republican takeover of both chambers of the state legislature. That surprising victory gave Republicans redistricting power in the state.
They now have to consider whether to try to gerrymander NH-1 in such a way to put Rep. Chris Pappas (D, NH-1) in further peril. One way to do this would be to move Manchester into NH-2, strengthening Democrats there, while moving Coos County in northern New Hampshire as well as some Republican-leaning turf in southern New Hampshire into NH-1. This kind of reconfiguration would reduce Biden’s winning margin in the district from half a dozen points to more like one or two points. A more dramatic gerrymander could turn NH-1 into a narrow Trump seat, but one wonders what the appetite would be for such a dramatic transformation of congressional district lines that have not changed much in close to a century and a half.
The other Republican consideration might be this: In a good enough year, Republicans could conceivably win both seats in historically very swingy New Hampshire, but strengthening Republicans in NH-1 would likely move NH-2 out of the range in which it was plausibly winnable for Republicans. Perhaps Granite State Republicans already believe NH-2 isn’t a seat they can compete for anymore, which would be an argument for making NH-1 less Democratic.
NEW JERSEY
Number of seats: 12 (no change from 2010s)
Breakdown in 2012: 6-6 Split
Current party breakdown: 10-2 D
Most overpopulated district: NJ-8 (Hoboken/Elizabeth/Part of Newark)
Most underpopulated district: NJ-2 (South Jersey)
Who controls redistricting: Commission
2012 control: Commission
New Jersey is an example of how a district plan that appears to favor one side at the start of the decade can perform contrary to expectations by the end of the decade.
The Garden State uses a commission system in which each party gets six members. Those 12 members then decide on a 13th member to break ties. A decade ago and as New Jersey was losing a district due to slower population growth, the tiebreaker sided with Republicans on the congressional map, and two incumbent Democrats ended up running against each other in North Jersey: Rep. Bill Pascrell (D, NJ-9) prevailed in that primary. The GOP map also modestly reconfigured NJ-3, a swing seat that Republicans had captured in 2010, which had the effect of strengthening Republicans in that seat. In both 2012 and 2014, New Jersey produced a 6-6 congressional delegation in a state that otherwise clearly leans Democratic.
But Republicans held a number of districts in North Jersey that are relatively affluent, suburban/exurban, and highly-educated. They lost one in 2016, when now-Rep. Josh Gottheimer (D, NJ-5) defeated social conservative Scott Garrett (R), and then two more in 2018, when now-Reps. Tom Malinowski (D, NJ-7) and Mikie Sherrill (D, NJ-11) won similar districts. All three of these districts voted for Mitt Romney in 2012 but then flipped to Democratic presidential nominees in 2016 and/or 2020. Meanwhile, in South Jersey, Trump twice won NJ-2 and NJ-3 after Barack Obama carried them in 2012, but that did not prevent Democrats from capturing both seats in 2018. Rep. Andy Kim (D, NJ-3) won a second term last year despite Trump carrying his district by just a couple tenths of a percentage point, while Rep. Jeff Van Drew (R, NJ-2) switched parties during Trump’s first impeachment fight and won a second term last year.
Even at 10-2 — down from an 11-1 high water mark prior to Van Drew’s defection — Democrats still have what is otherwise their largest edge in the New Jersey House delegation since the 1974 election, a huge year for Democrats nationally when Democrats won a 12-3 advantage in the Garden State.
Realistically, protecting this edge under what might be trying electoral circumstances in 2022 would be a significant win for Democrats. They caught a break in the redistricting commission process: The two parties could not come to an agreement on a tiebreaking commission member, so they punted the decision to the state Supreme Court, which selected the Democrats’ preferred tiebreaker. That doesn’t necessarily mean that the Democrats will get to gerrymander, but they may have a better chance of getting their preferred map compared to the Republicans.
Because New Jersey is not adding or subtracting any seats, it may be that there are not huge changes. But there are adjustments that will have to be made because of population. One positive for Democrats is that the two most overpopulated districts, those held by Reps. Albio Sires (D, NJ-8) and Donald M. Payne Jr. (D, NJ-10) in the parts of New Jersey closest to New York City, are also by far the two most Democratic districts in the state. So the swing districts in North Jersey, all of which need to grow to some extent, could hypothetically get strengthened by taking little pieces of the overpopulated New York City-area seats. But the districts could be redrawn in lots of different ways. Based on 2020, the most vulnerable Democrat in the delegation may be Malinowski, even though Biden did better in his district than in any of the others that Democrats picked up in the state in 2016 and 2018. He faces a rematch with state Senate Minority Leader Tom Kean Jr. (R), who nearly beat him last year. Joey Fox of the New Jersey Globe described three different scenarios for re-drawing NJ-7 in which the district hardly changes at all, gets more Democratic by extending further into the New York City area, or gets more Republican by becoming more western-oriented. Whatever happens in NJ-7 could have ripple effects in NJ-5 and NJ-11, too. Under the current map, all three of these districts are winnable for Republicans, but perhaps the changes will make one or more markedly less or more competitive.
Meanwhile, the competitive NJ-2 (held by Van Drew) and NJ-3 (held by Kim) are both underpopulated, so each will need to grow. One possible solution could involve swaps between the districts to shore up both incumbents, although Republicans will still want to compete for NJ-3 and Democrats may still want to target NJ-2, particularly if redistricting made the district bluer. A pro-incumbent scenario would probably have Van Drew take in more of Ocean County, which is the more Republican part of the current NJ-3.
As with many other commission states, we find it difficult to handicap what might happen. Democrats did win the first battle of the fight by getting their preferred tiebreaker, but much else is uncertain. Beyond redistricting, New Jersey is a good state to watch to measure any possible backlash against the Biden White House. A big Republican year would necessarily entail them winning back some highly-educated suburban seats where Trump was relatively weak compared to previous Republicans. Several seats in New Jersey fit that description.
NEW MEXICO
Number of seats: 3 (no change from 2010s)
Party breakdown in 2012: 2-1 D
Current party breakdown: 2-1 D
Most overpopulated district: NM-2 (South)
Most underpopulated district: NM-1 (Albuquerque)
Who controls redistricting: Democrats
2012 control: Split
In New Mexico, which has had three seats since the 1980 census, Democrats face a choice: They can continue with two solidly blue seats, or they can risk trying to flip a third seat.
In 2011, with a Republican governor and a Democratic legislature, New Mexico’s congressional map was a compromise plan enacted by the state Supreme Court. In essence, it made minimal changes to the existing plan. NM-1 and NM-3, based in Albuquerque and Santa Fe, respectively, remained Democratic-leaning seats while NM-2, which includes Las Cruces and encompasses much of the Texas border, retained its GOP orientation.
Then-Rep. Steve Pearce (R, NM-2) was popular in the 2nd District — he held it for the first decade of the 2000s, then vacated it in 2008 to run for Senate. The 2008 New Mexico Senate race was a brutal one for Republicans. Pearce beat out then-Rep. Heather Wilson (R, NM-1) in a close primary, only to get clobbered by then-Rep. Tom Udall (D, NM-3) in the general election — it was a rare situation where all three of the state’s sitting members sought a single U.S. Senate seat. Democrats gained NM-2, as an open seat, in 2008, but in 2010, Pearce reclaimed the seat.
Pearce was reelected easily until 2018, when he launched another statewide run, this time for governor — which meant a replay of 2008 in NM-2. Pearce lost by 14 points to now-Gov. Michelle Lujan Grisham (D-NM) while NM-2 flipped to Democrats. Xochitl Torres Small, a former Udall staffer whose husband was elected to the state legislature in 2016, narrowly beat out state Rep. Yvette Herrell for the open seat — two years earlier, NM-2 supported Trump by 10 points. Torres Small took 65% in Las Cruces’ Dona Ana County and kept Herrell’s margins down in the rural counties.
In Congress, Torres Small joined the Blue Dog Coalition, and tended to the oil industry, a major employer in the district. Still, Herrell ran for a rematch and got a boost from Trump’s showing in the district. While the then-incumbent president lost support in New Mexico’s other two districts, he improved by two percentage points in NM-2, carrying it by a dozen points — Torres Small ran better than Biden, but still lost by seven points.
Democrats could give Herrell a tougher district by redrawing NM-2 to take in the entire eastern half of the state. Though fellow first-term Rep. Teresa Leger Fernandez (D, NM-3) may not like such a plan, as it could move some of her Santa Fe home turf into NM-2, it would give Democrats a good chance to reclaim all three districts. Democrats also could give districts 2 and 3 a greater chunk of Bernalillo County, though that may be met with some local resistance (the county is already split among all three districts, but the vast majority of it is in NM-1).
If Democrats wanted to try for a 3-0 map, they may want to ensure their two incumbents have enough of a cushion. Based on our calculations, they could draw two seats that would each be about 57% Biden, while the third would have only given him a small majority. Such a district would probably be winnable in a neutral national environment, but not a red wave year.
If Democrats pushed for a plan like this, they’d likely risk some public backlash: earlier this year, Gov. Lujan Grisham signed into a law a bill establishing a citizen’s redistricting commission that had bipartisan support. The redistricting commission’s recommendations will not be binding, so even if it suggests a status quo map, Democratic legislators would be free to pass their own plan, though doing so may look heavy-handed.
If New Mexico passes a minimal change plan, as it did last decade, the partisan balance of its delegation will very likely remain unchanged. Though NM-3, which includes a large rural swath of the state, has seen its Democratic advantage erode somewhat in recent cycles, Leger Fernandez made a strong debut last year — she was elected by 17%, running about even with Biden in the district. Similarly, in a recent special election, now-Rep. Melanie Stansbury (D, NM-1) won by a surprisingly wide 25-point margin. With Torres Small up for a job in the Biden Administration, it seems unlikely she’d run for a rematch in a similar version of NM-2, so Democrats would need to find another credible candidate to run against Herrell.
NEW YORK
Number of seats: 26 (-1 from 2010s)
Breakdown in 2012: 21-6 D
Current party breakdown: 19-8 D
Most overpopulated district: NY-12 (East Side Manhattan/Astoria/Greenpoint)
Most underpopulated district: NY-23 (Western New York’s Southern Tier)
Who controls redistricting: Democrats
2012 control: Split
Over the past several decades, New York’s congressional reappointment, summed up in the 2000 edition of the Almanac of American Politics, could be described as “carnage.” Since the 1950 census, the state has sent fewer members to the House each decade. In 1952, the first election after the downsizing trend started, the Empire State elected 43 representatives — next year, that number will be down to 26.
For 2020, the bloodletting nearly stopped. To the chagrin of New Yorkers, the Census Bureau announced that, had the state reported just 89 more residents, it would have retained all its seats. Still, at some points during this past decade, the state seemed to be on track to lose two seats, as it did in the 2010 census — so New Yorkers may take some cold comfort in that their losses could have been worse. New York also may not have lost any seats were it not for COVID-19; a recent study by political scientists Jonathan Cervas and Bernard Grofman found that New York was the only state to lose a seat because of deaths early in the pandemic.
Though New York will again be losing representation in Congress, the regime in Albany has changed. Ten years ago, then-Gov. Andrew Cuomo (D-NY) had just won his first term, and he seemed intent on preserving his clean, reformist image — he pledged to veto any congressional map that featured gerrymandered districts. After the Republican-controlled state Senate and the Democratic state Assembly could not agree on a compromise plan, the process was kicked to a three-judge panel, which passed a map. U.S. Magistrate Judge Roanne Mann, who the panel designated to draw the map, seemed to aim for geographic and partisan balance when finding districts to cut. The seat held by Rep. Maurice Hinchey, an Upstate Democrat who was retiring anyway, was eliminated, while Republican Rep. Bob Turner, who won a 2011 special election to the seat previously held by the now-infamous Anthony Weiner (D) and was the delegation’s most junior member, also saw his New York City-area seat vanish.
Despite the deadlocked legislature, one reform that came out of the 2010 round of redistricting was an independent commission, although it would not be in place until 2020. Legislative leaders put language establishing the commission on the November 2014 ballot — it was approved 58%-42%. While the commission includes members of both parties and will draft maps, the legislature is not obligated to follow its recommendations: if the legislature rejects the commission’s plans twice, legislators can amend the maps.
The 2014 constitutional amendment also established standards for passing maps: if control of the legislature is split, a simple majority in each chamber is required to pass maps, but if one party controls both houses (as Democrats do), a two-thirds vote is needed. In November, New Yorkers will vote on another referendum that is aimed at lowering the latter threshold. If Proposal 1 is passed, the Democratic legislature’s two-thirds threshold will be reduced to a simple majority standard. Democrats already have large enough majorities in both chambers to clear the two-thirds threshold, but Proposal 1 would give them more room for defections.
Democrats have controlled the state Assembly since the 1970s, but in 2018, they flipped the state Senate and expanded their majority in 2020. The embattled Cuomo recently resigned, turning the governorship over to Kathy Hochul (D), the now-former lieutenant governor. Hochul is running for a full term next year and faces a potentially competitive primary. Perhaps with that in mind, she has signaled a willingness to play hardball, if necessary, to help Democrats pass favorable maps. Hochul may have other personal reasons for being a team player: She knows firsthand what it’s like to come up on the short end of the redistricting process. In 2011, she won a special election for a Republican-leaning seat that spanned from Buffalo to Rochester. The plan that the three-judge panel enacted did not help her — running for reelection in a similar seat the next year, she lost 51%-49%, though she still ran more than 10 points ahead of Barack Obama’s showing in the district.
So, if Hochul and the Democratic legislature get their way, what would their map look like?
Starting on Long Island, four-term Rep. Lee Zeldin (R, NY-1) is running for governor and is leaving behind an open seat that is entirely within Suffolk County. Next door, first-term Republican Rep. Andrew Garbarino’s NY-2 is also based mostly in Suffolk County, though it also contains part of Nassau County. As drawn, Trump carried both districts by about four points last year — in congressional races, Democrats have watched heralded candidates come up short in those districts over recent cycles. Democrats’ solution may be to concede one while making the other more winnable. Moving the cities of Brentwood and Wyandanch into NY-1 would turn it into a slightly Democratic-leaning seat while NY-2, which already includes a red part of Nassau County, could take in Republican parts of NY-1.
Moving west, Rep. Tom Suozzi’s (D, NY-3) district takes in parts of northern Suffolk and Nassau counties, but will probably expand its holdings in Democratic areas of Queens. Rep. Kathleen Rice’s (D, NY-4) seat is entirely confined to Nassau County, and that could still be the case next year. Democrats could shore her up by moving some minority-heavy precincts in western Nassau from NY-5 into NY-4. As drawn, both NY-3 and NY-4 gave Biden about 55% — a clear majority, but in the event of a bad year, Democrats would probably want to increase that number.
Currently, New York City includes all or parts of 13 districts. Democrats hold all of those districts except for NY-11, which they will almost certainly look to flip. Democrats held that district from 2018 to 2020, but the seat fell back into Republican hands last year when then-state Assemblywoman Nicole Malliotakis beat then-Rep. Max Rose (D, NY-11) by six points. NY-11 is mostly based in Staten Island, which has enough population for about 65% of a district, and usually leans Republican (Malliotakis carried it 55%-45%). On the current plan, the Verrazzano-Narrows Bridge connects Staten Island to some neighborhoods in Brooklyn, such as Fort Hamilton and Gravesend — the Brooklyn part of NY-11 is Democratic, but not overwhelmingly so, as it supported Rose 52%-48%. Assuming mappers keep Staten Island whole, Democrats could turn NY-11 into a Biden district (Trump carried the current version by just over 10 points) by giving it different areas of Brooklyn, or perhaps even bringing it into Manhattan (this was the case on some previous plans).
There is little question that the other 12 districts in New York City will remain Democratic, so other considerations, such as racial demographics, will inform the line-drawing more than anything else — as the Crystal Ball showed a few months ago, when we previewed the mayoral primary, NYC is certainly a diverse city. In Queens, for example, Rep. Grace Meng (D, NY-6) holds the most heavily Asian district on the Eastern Seaboard. Her NY-6 is currently about 45% Asian, but could possibly become Asian-majority.
Democratic incumbents will also have personal preferences. Veteran Rep. Carolyn Maloney (D, NY-12) has had some competitive primaries over the last few cycles: she has a base in Manhattan but, in primaries, has polled poorly in the gentrifying parts of Kings and Queens that are in her district. Maloney may be reluctant to take on much more territory from the latter. Maloney’s geographic situation is ironic when considering how she ended up in Congress. She was first elected in 1992, beating moderate Republican Rep. Bill Green: Green narrowly carried Manhattan, where the bulk of the district was located, but Maloney won by taking over 60% between its Kings and Queens portions.
Rep. Jerrold Nadler (D, NY-10) also has a sizable portion of Manhattan, but his district reaches down into Brooklyn to include some heavily Orthodox Jewish precincts. As an aside, because of Orthodox Jews and other conservative constituencies, it is possible to draw a Republican-leaning seat in Brooklyn, but Democrats will probably ensure GOP strength there remains diluted. It is possible that either, or both, of Maloney or Nadler may retire — they were both originally elected in 1992 and will each be 75 or older by Election Day 2022 — which could make things easier on mappers.
Moving north of the city, some big changes are likely in store for Upstate New York: currently, five of the eight Republicans in the state’s delegation are from there. On an effective Democratic gerrymander, Republicans could be reduced to just two Upstate seats.
Reps. Elise Stefanik (R, NY-21) and Claudia Tenney (R, NY-22) both ran as allies of former President Trump and hold adjacent seats. Stefanik’s district takes in the North Country and overlaps with Adirondack National Park. Politically, the area that makes up the current NY-21 votes like many blue collar pockets of the Midwest: after giving Obama modest majorities, it supported Trump by double-digits. Tenney was first elected in 2016 to a seat just to the south, which includes Utica and Oneida. Two years later, Tenney lost 51%-49% to Democratic state Assemblyman Anthony Brindisi — however, in an agonizing result for Democrats, Brindisi lost a 2020 rematch by 109 votes.
Though Democratic partisans would very much like to defeat both Upstate Republican women, from a practical standpoint, they would probably be better off giving one a safe seat — that way, adjacent seats would be more Democratic. It would not be hard to build a safely red seat around the Mohawk Valley, an area that Stefanik and Tenney each currently represent parts of. One source of Democratic votes in NY-21 is Clinton County (Plattsburgh), in the district’s northeastern corner. Rep. Anthony Delgado’s (D, NY-19) Hudson Valley-area seat could reach up to grab Clinton County, although the area is not as blue as it used to be: while Obama carried Clinton County twice by about 25 points, it has gone Democratic by only single digits in presidential races since. Democrats likely also will try to shore up Democratic Congressional Campaign Committee Chairman Sean Patrick Maloney (D, NY-18), who holds a Trump/Biden district south of Delgado’s turf.
Aside from drawing a red seat encompassing the Mohawk Valley, Democrats will likely draw a safely Republican seat in western New York. This could be accomplished by combining the reddest parts of the current NY-23 (the Southern Tier) and NY-27 (the Buffalo-to-Rochester district that is the descendant of Hochul’s old seat). As Rep. Tom Reed (R, NY-23) is retiring, Rep. Chris Jacobs (R, NY-27) would probably be favored for this seat.
With two solidly Republican Upstate seats out of the way, Democrats will look to monopolize the rest of the region — and the lines could be creative, to say the least. In the Albany area, Rep. Paul Tonko (D, NY-20) may be the Upstate Democrat who sees the fewest substantive changes to his district: his seat will likely remain anchored in the state’s capital city — while it is not as blue as the NYC districts, it should be out of reach for Republicans (the current version supported Biden by 21%).
In western New York, Rep. Brian Higgins (D, NY-26) currently holds a district that contains all of Buffalo. His district could easily take in more surrounding precincts in Erie County, as Democrats unpack it somewhat. Higgins’ current district gave Biden a 27-point margin, and he himself is one of Congress’ lower-profile electoral overperformers. It seems likely that mappers will take excess Democrats from Buffalo and, using Niagara and Orleans counties as a bridge, connect them to Democrats in the Rochester area — in the first decade of the 2000s, the late Rep. Louise Slaughter (D) represented a seat with a similar configuration. Rep. Joe Morelle (D, NY-25), who replaced Slaughter after her 2018 death, could run in that seat.
After recreating the Slaughter seat, Democrats will probably still have some blue turf left over in Rochester’s Monroe County. This area could be put into Republican Rep. John Katko’s Syracuse-area district. Katko was initially elected in 2014, and, to the frustration of Democrats, this moderate Republican has remained popular in his blue seat. It is possible that, with enough new (and Democratic-leaning) constituents, Katko would be more vulnerable in a general election or primary (Katko voted for the second impeachment of Donald Trump, drawing the former president’s ire). For good measure, it’s easy to see Democrats cracking Syracuse’s Onondaga County.
The part of Onondaga County that doesn’t end up with Rochester could be put with other smaller Upstate metros. Tompkins County, which includes Ithaca (Cornell University), is the bluest Upstate county — in fact, speaking to Biden’s gains with college whites and Trump’s improvement with minorities, 2020 was the first time ever that Tompkins County was more Democratic than Queens. Tompkins County is currently in the GOP-leaning NY-23, so it will almost certainly be removed. A district that includes Tompkins County and part of Onondaga County could grab some blue precincts in Utica.
Map 10 illustrates a possible pro-Democratic gerrymander of Upstate New York. Two districts, NY-21 and NY-23, are deeply red, while a stretch of four blue districts span from Buffalo to Utica. Rep. Tonko keeps an Albany-based seat while Delgado’s NY-19 reaches up to Plattsburgh. Districts in Map 10 are colored by their 2012-2016 presidential average: districts 22, 24, 25, and 26 are all about 56% Democratic.
Map 10: Hypothetical Upstate New York Democratic gerrymander
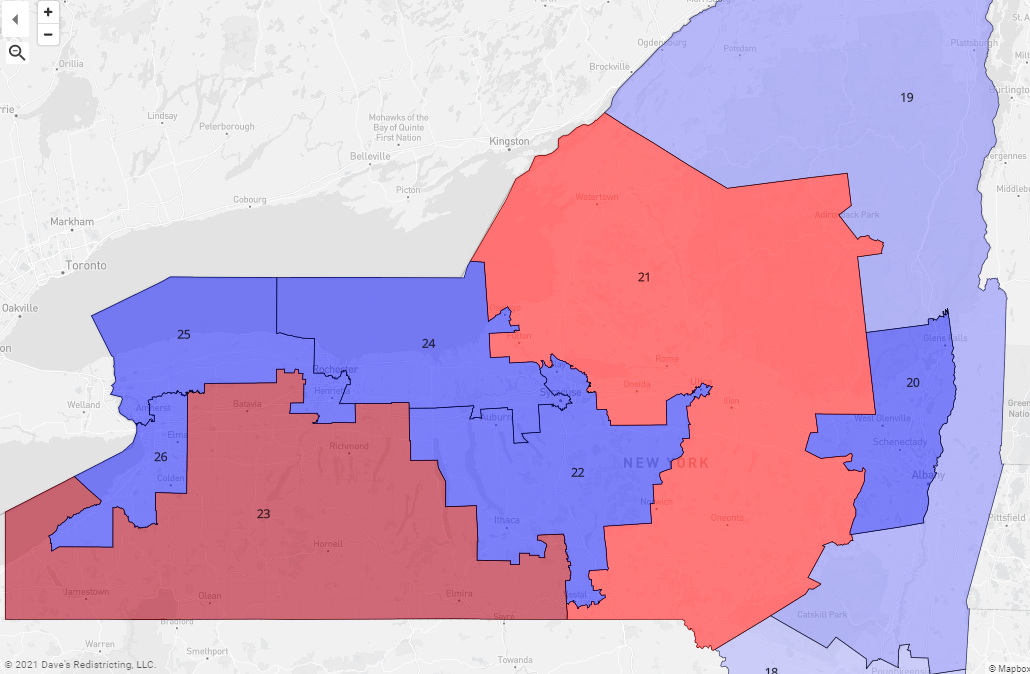
So it’s likely that, assuming they reject any commission-drawn maps, legislative Democrats will end up splitting many large Upstate cities: Buffalo, Rochester, and Syracuse are all whole on the current map, but partisan mappers will almost certainly want to spread out their Democratic voters.
If everything falls into place for Democrats — something that is not guaranteed — they could expand their current 19-8 edge in the delegation to 23-3. Given their relatively weak hand in other regions of the country, if the battle for the House is truly close, that type of windfall in New York could feasibly save their slim majority.
NORTH CAROLINA
Number of seats: 14 (+1 from 2010s)
Party breakdown in 2012: 9-4 R
Current party breakdown: 8-5 R
Most overpopulated district: NC-2 (Raleigh)
Most underpopulated district: NC-1 (Northeast North Carolina)
Who controls redistricting: Republicans
2012 control: Republicans
Tar Heel State Republicans drew two effective gerrymanders in the 2010s. The first one, which was in effect for the 2012 and 2014 elections, aimed to reverse a Democratic gerrymander from the 2000s, which helped Democrats maintain a narrow 7-6 advantage in the state even in the 2010 Republican wave. Republicans immediately won a 9-4 edge in 2012, and they got to their goal of 10-3 by 2014. But then a federal court threw out that map for packing too many minority voters into too few districts. So Republicans went back to the drawing board and drew another 10-3 map; as part of that, they unwound the serpentine and heavily litigated NC-12, a majority-minority district that took in Black pockets in Greensboro, Winston-Salem, and Charlotte. That district is now entirely contained within Charlotte’s Mecklenburg County.
State courts, led by a Democratic-controlled state Supreme Court, unwound the congressional map once again during the 2020 cycle, which forced North Carolina Republicans to make some actual concessions. So they drew two new safe Democratic seats, one in Winston-Salem/Greensboro/High Point and the other in the Raleigh area, and the state elected an 8-5 Republican delegation.
Republicans kept control of the state House and Senate last year, and while North Carolina has a Democratic governor, Roy Cooper, he has no role in redistricting and cannot veto maps. Democrats do still have control of the state Supreme Court, although a rough 2020 cycle cut their 6-1 edge to 4-3. Democrats hope that the precedent from the recent state court decisions that reconfigured the past map could constrain Republican gerrymandering. Republicans hope to grab the majority on the court in the 2022 election, and their narrow victory in the race for the court’s chief justice position last year might also provide them some logistical advantages in a Democratic lawsuit over gerrymandering.
In any event, North Carolina is adding a 14th seat. If North Carolina Republicans essentially try to recreate something along the lines of a 10-4 version of their previous gerrymanders from the last decade, it’s not hard to imagine what they could do. Map 11 is a potential 10-4 Republican gerrymander.
Map 11: Hypothetical 10-4 Republican North Carolina gerrymander
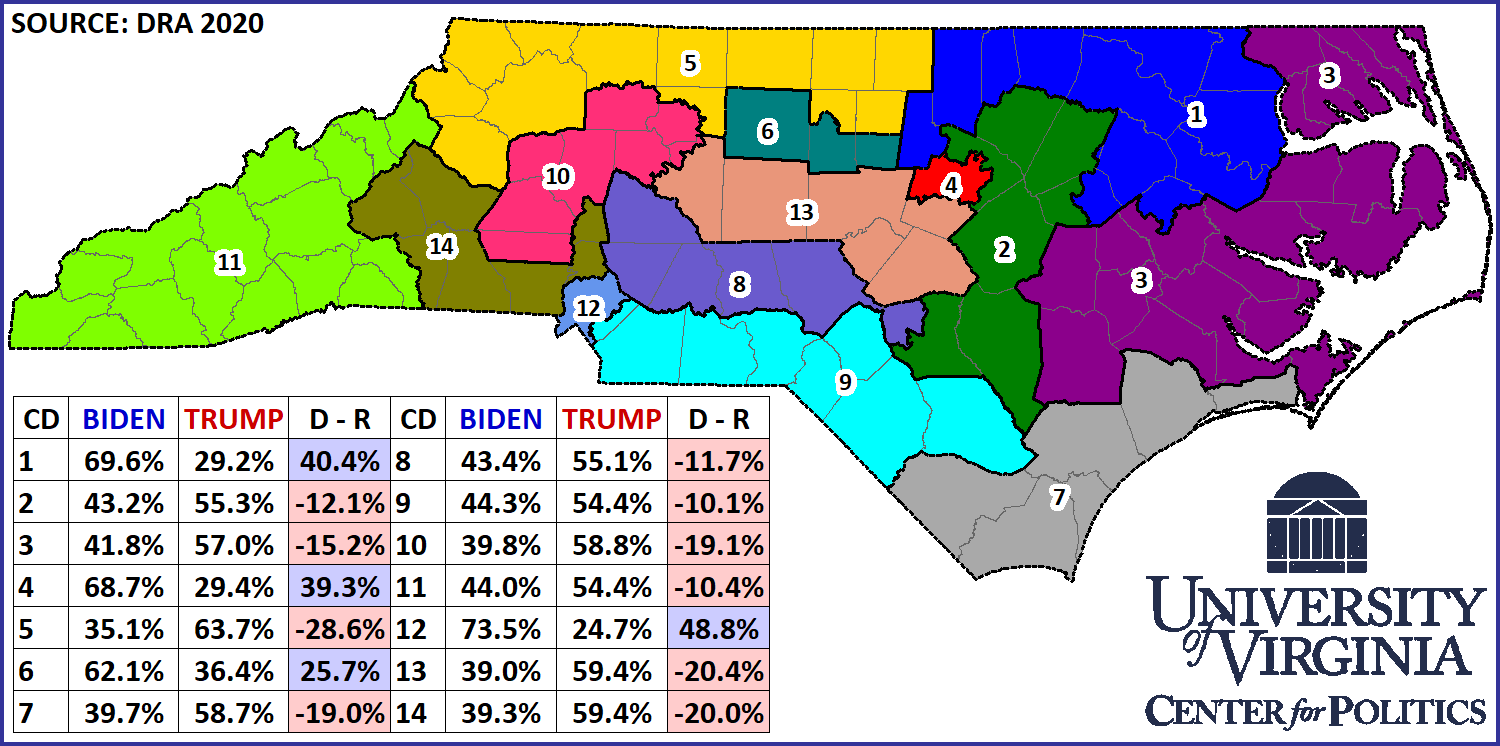
As Map 11 shows, it is not hard to draw a plan that features 10 districts that went to Trump by double-digits. Republicans’ shakiest seat under this map would be NC-9, which Trump carried by just over 10%, though this is still a bump up from Trump’s 8-point edge in the current version. The 9th reaches into the blue-trending Charlotte suburbs to include the home of Rep. Dan Bishop (R, NC-9), but he retains heavily GOP Union County, and some reddening rural counties in the east. Bishop won a close special election in 2019, but was not considered a top Democratic target in 2020.
Democrats made a series attempt at unseating Rep. Richard Hudson (R, NC-8) in 2020, but he held on by nearly seven percentage points. Though he retains much of Fayetteville, the 8th moves further into the heavily GOP-leaning Piedmont.
On Map 11, the new 14th District is added in the western Charlotte metro area. It is rumored that Republican state House Speaker Tim Moore, who hails from Cleveland County, has his eye on a congressional run, so this may be a configuration he’d favor.
Democratic Reps. Deborah Ross (D, NC-2) and Kathy Manning (D, NC-6) each retain their bases, in Raleigh and Greensboro, respectively, but veteran Rep. David Price’s NC-4 is essentially dismantled. Price, who lives in Chapel Hill, would be drawn into a district that would geographically favor Manning. A map like this could prompt Price, who turns 81 later this month, to retire.
NC-1 as currently drawn is an interesting case: It became markedly less Democratic as the most recent map essentially unpacked it by removing Durham (though Map 11 puts Durham back into NC-1, that may ultimately not be the case). Butterfield and Biden both carried the current district by roughly 8.5 points. It’s not impossible to imagine the district being competitive in a bad Democratic year. Just like a few other southern districts with substantial minority populations (the district includes a number of rural counties that are majority Black) NC-1 is not growing. Going into the 2010 round of redistricting, NC-1 needed to pick up almost 100,000 residents — this time, it is the only North Carolina seat that needs to add population. Republicans may just end up being safest leaving it alone for legal reasons, and perhaps they will be able to compete for the district at some point in the decade anyway. Short of moving Durham back into the district, Butterfield’s best scenario would be picking up Pasquotank County (Elizabeth City) while dropping some red rural turf around Greenville or Goldsboro — this would nudge the district slightly leftward.
While Rep. Madison Cawthorn (R, NC-11) has become a major lightning rod in Washington, he should be fine almost regardless. In the initial Republican gerrymander in advance of the 2012 election, the GOP helped push then-Rep. Heath Shuler (D, NC-11) toward retirement by removing Democratic precincts from the liberal city of Asheville from his western Carolina district. Shuler was replaced by Mark Meadows (R), later one of President Donald Trump’s chiefs of staff. The most recent North Carolina map now has all of Asheville in it, but Republican performance in other parts of the Appalachian district has improved. When Shuler was last reelected, in a competitive 2010 contest, he did better in some rural counties than he did in Asheville’s Buncombe County. Today, aside from running up the score in Buncombe County, Democrats would probably prioritize limiting their losses in Henderson County — this ancestrally GOP county was Shuler’s worst in 2010, but Biden was the best-performing Democratic nominee in this growing county since Jimmy Carter, in 1976. Still, Cawthorn and Trump each carried the district by about a dozen points, so Republicans should feel fairly secure with a similar seat.
Overall, though Republicans could draw some creative plans, North Carolina is probably his is another state where they need to be careful about spreading themselves too thin — especially in growing metropolitan areas where Democratic performance has been improving, most notably the growing Greater Charlotte and Triangle areas.
OHIO
Number of seats: 15 (-1 from 2010s)
Breakdown in 2012: 12-4 R
Current party breakdown: 12-4 R
Most overpopulated district: OH-3 (Columbus)
Most underpopulated district: OH-6 (Eastern border along Ohio River)
Who controls redistricting: Republicans
2012 control: Republicans
It’s difficult to find a big-state gerrymander that was as effective as Ohio’s Republican-drawn map was in the 2010s. It’s also difficult to find a big state with as many variables in its redistricting process for the 2020s. Let’s review the history first, and then explore the new system.
In 2008, Democrats won a narrow, 10-8 advantage in the state’s U.S. House delegation, breaking through on a Republican-drawn map. It’s the only time Democrats have won a majority of the state’s delegation since the Republican Revolution of 1994, when Republicans won the House for the first time in four decades. Another Republican wave, in 2010, restored the Republican gerrymander and then some: The GOP won 13 of 18 seats, a seat better than their high-water mark from earlier in the decade.
Controlling the process in advance of the 2012 election, Republicans had to deal with the slow-growing state’s loss of two congressional district. They axed one district from each party, with the goal of electing 12 Republicans and four Democrats. It worked — no seats changed hands throughout the decade — although that glosses over some of the change in the 16 districts over the course of the 2010s.
Few states performed better for Donald Trump in 2016 and 2020 compared to previous Republican presidential nominees than Ohio. Trump carried the state by eight points in each of his elections, pushing the one-time bellwether state further to the right compared to the nation as a whole than it had been since before the New Deal.
The pro-Republican shift was perhaps most notable in Eastern Ohio. OH-13, a district drawn by Republicans as a Democratic vote sink under the 2010s map and held by Rep. Tim Ryan (D), gave Barack Obama a nearly 30-point margin in 2012. Last year, OH-13 supported Joe Biden, but by just over three points — this placed the district slightly right of the national popular vote (Biden won that by about 4.5%). Map 12 compares the elections in the district.
Map 12: OH-13, 2012 vs. 2020
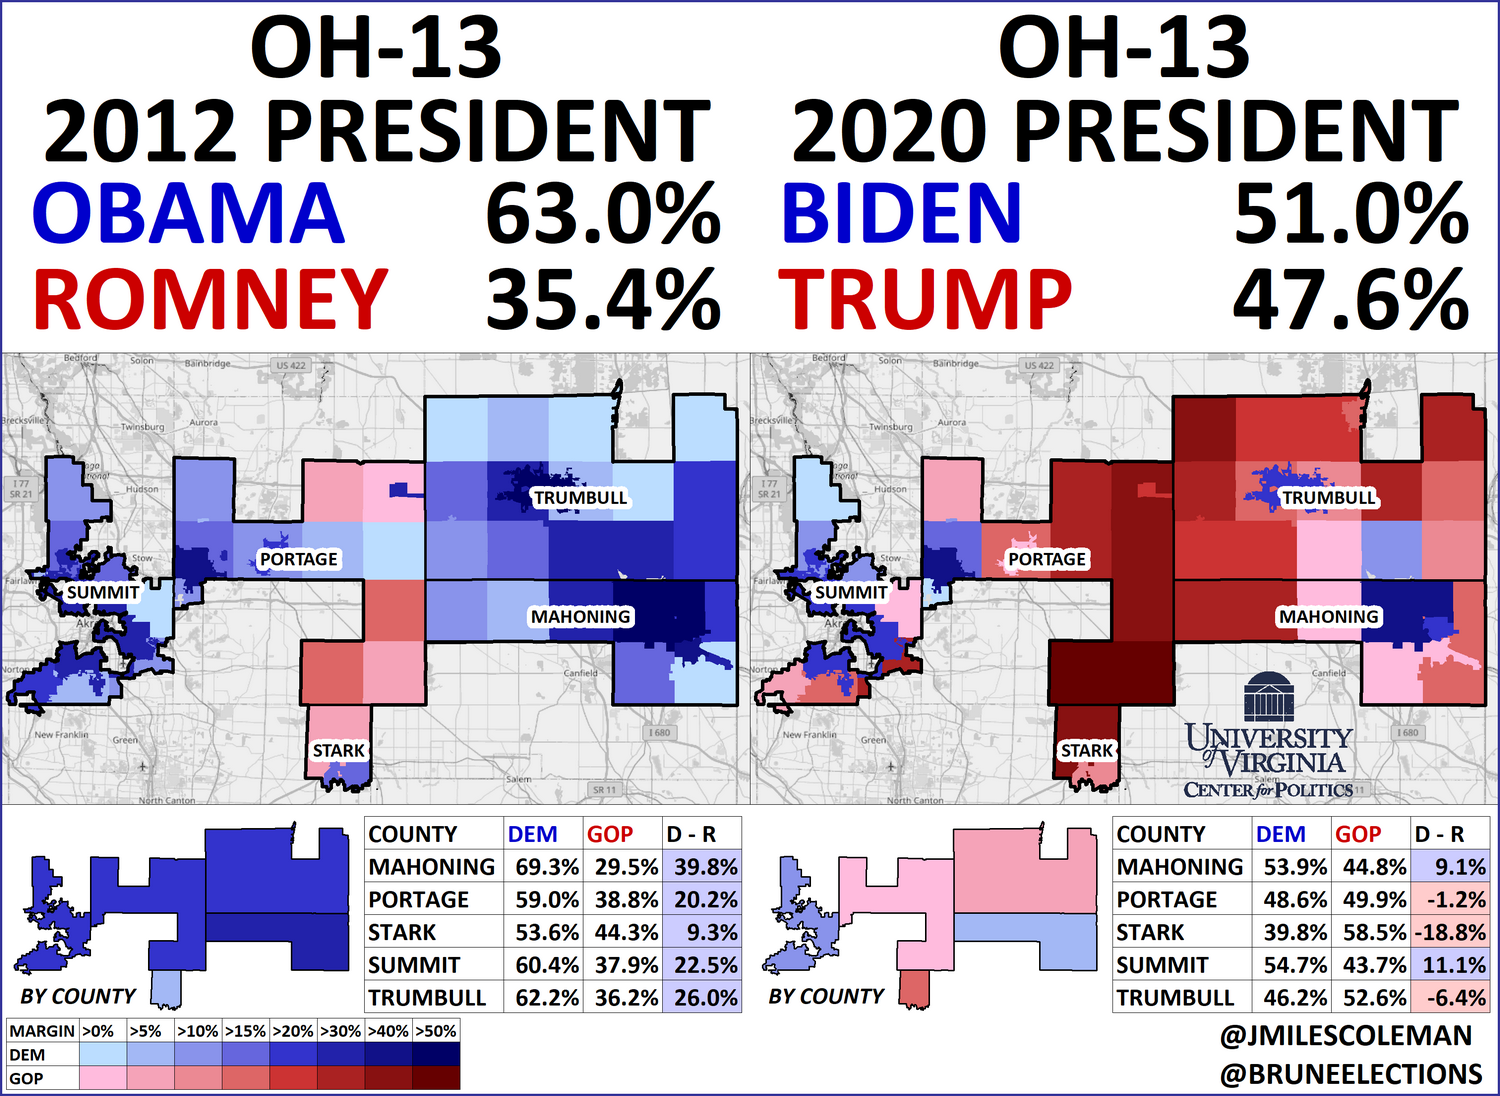
OH-13’s astonishing swing was dwarfed by that of OH-6’s, held by Rep. Bill Johnson (R), which shifted a remarkable 33 points toward the Republicans in presidential margin from 2012 to 2020 — this was the largest redshift of any district during that period. In fact, four of the five districts with the strongest pro-Republican presidential swing from 2012 to 2020 are in Ohio, per the calculations from Daily Kos Elections: the aforementioned OH-6 and OH-13, along with the districts held by Reps. Bob Gibbs (R, OH-7) and Jim Jordan (R, OH-4).
OH-13 is a prime candidate to be eliminated in redistricting, as Ryan is running for Senate: It is a Democratic vote sink that isn’t even that Democratic anymore. It would be easy for it to be absorbed by other districts. In the past, Republicans would not have wanted the one-time Democratic post-industrial powerhouse counties of Mahoning (Youngstown) and Trumbull (Warren) put together in a Republican district. But both of those counties voted for Trump in 2020, so surrounding Republicans can easily take them on.
Of the state’s other districts, only one — Rep. Troy Balderson’s (R) OH-12 in the northern Columbus suburbs/exurbs — exhibited a notable pro-Democratic shift from 2012, going from Romney by 10.5 to Trump by 5.9. Democrats came within a point of capturing the seat in an August 2018 special election, the only time they got very close to winning one of the state’s 12 Republican-held districts. Rep. Steve Chabot (R, OH-1) in the Cincinnati area also faced competitive races in 2018 and 2020 as Republican performance fell off a bit over the course of the decade.
So this is the landscape in Ohio — a state that has clearly shifted right in recent years. Republicans dominate the state legislature and control the governorship, so if they had complete gerrymandering power, they would almost certainly be able to improve upon their edge in the delegation as Ohio loses another seat in this cycle’s reapportionment. But the state’s new redistricting process could constrain that power.
In 2018, Ohio voters overwhelmingly approved a constitutional amendment creating a system that is not equivalent to the independent redistricting commissions that exist in several other states, but that also could hypothetically constrain egregious gerrymanders. The state’s 65 smallest counties cannot be split, the next 18 largest can only be split once, and the five largest can only be split twice (Democratic vote center Cuyahoga, home to Cleveland, is covered by four different congressional districts currently). Additionally, of the state’s major municipalities, only Columbus (which is too populous to fit in a single district and spills into multiple counties) can be split; the state’s other biggest cities must remain whole, including Cleveland and Cincinnati. This should have the effect of creating more regular district lines in Ohio.
The state legislature gets the first crack at drawing the lines, but a three-fifths majority must approve them and, crucially, that majority must include at least half the members of both parties. If this fails, a seven-member commission draws the lines, but that only succeeds if two of the minority party members vote in favor of the map. That commission, as currently composed, has a 5-2 Republican edge, but remember that the two Democrats would need to vote in favor of the map. Only if these two processes fail can the legislature pass a map with a simple majority, but that map would only be in place for four years instead of the customary 10. One other wrinkle here is the Ohio Supreme Court, which has a 4-3 Republican majority (justices are nominated in partisan primaries but do not have a party label on the general election ballot, which likely has been a boon to Democrats as they’ve flipped three seats in the last two cycles). It is possible that the high court could throw out a Republican-drawn map if the court found that the map did not comply with the new system/guidelines, although that would take at least one Republican voting with the Democrats. Chief Justice Maureen O’Connor (R) was in the minority in a case from 2012 that unsuccessfully challenged the GOP-drawn state legislative maps last time, for what it’s worth (possibly nothing, but possibly not).
It isn’t hard to find Republican-friendly Ohio gerrymanders from Twitter mapmakers that abide by the new rules but still produce a map that would likely result in a 13-2 Republican majority, with Democratic seats only in Cleveland and Columbus. At the same time, it’s also possible to draw a much worse map for Republicans, which likely would give them a clear majority of the seats but would allow Democrats to potentially win more seats than they hold now. One possible “compromise” would be to draw a third safe Democratic seat in Cincinnati, which perhaps would attract support from Black Democrats in the state legislature, as a Black Democrat would have a solid chance to win such a district.
Or, heaven forbid, perhaps there will actually be a competitive seat or two in the state from the get-go. For instance, Summit (Akron) and Stark (Canton) counties together have a bit more than 900,000 people, or a little more than 100,000 over the optimal size for a district. The two counties collectively voted for Donald Trump by less than two points, so it’s easy to see a swing district covering much of that territory, as well as competitive seats in other parts of the state.
Then perhaps Ohio could actually see changes to its House delegation based on campaign performance and the national environment — a foreign concept in the state in the 2010s. Regardless, Ohio is a major wild card in the national redistricting picture, with a number of possibilities ranging from a maximalist 13-2 Republican gerrymander to Democrats improving on their current 12-4 deficit.
OKLAHOMA
Number of seats: 5 (no change from 2010s)
Party breakdown in 2012: 5-0 R
Current party breakdown: 5-0 R
Most overpopulated district: OK-1 (Tulsa)
Most underpopulated district: OK-2 (Eastern Oklahoma)
Who controls redistricting: Republicans
2012 control: Republicans
Only two of Oklahoma’s five seats changed hands over the last decade, but they are emblematic of national trends: namely, Democratic problems in rural districts they used to win, and Republican problems in urban/suburban districts that used to be more Republican than they are now.
In post-2010 redistricting, the Republicans who controlled the process made only small changes to the state’s five districts. That included then-Rep. Dan Boren’s (D) OK-2, which covers eastern Oklahoma, including the state’s southeast corner along the Texas and Arkansas borders, a region called “Little Dixie.” Boren’s family connections — his father, David, served as governor and U.S. senator — as well as a lingering ancestral Democratic tradition in his district allowed him to win easily even in 2010, despite the district voting for John McCain in 2008 by a two-to-one margin. But Boren, at just age 37, retired in 2011, just a few months after the new map came out, and Republicans easily won OK-2 in all five elections held under the post-2010 map.
Meanwhile, Republicans’ urban/suburban problems under Donald Trump became so bad in 2018 that they lost the Oklahoma City-based OK-5 in what was perhaps the Democrats’ most surprising victory that year. Kendra Horn (D), helped by a late infusion of cash from Michael Bloomberg, seemed to catch then-Rep. Steve Russell (R) by surprise.
But now-Rep. Stephanie Bice (R, OK-5) restored Republican order in the district, beating Horn by four points. Still, there is a clear Democratic trend in the district: Mitt Romney won it by 18 points, but that margin fell to 14 for Donald Trump in 2016 and just five in 2020. So one would assume that Republicans, who control redistricting, will attempt to modify OK-5 to prevent it from falling into Democratic hands this decade.
The current OK-5 contains most, but not all, of Oklahoma City’s Oklahoma County, which came within about a point of voting for Biden. That the county stuck with Trump meant that, for the fifth straight presidential election, Republicans won every county in Oklahoma. Trump won every other district in the state by at least 20 points or more, so it wouldn’t be hard to strengthen the GOP in OK-5 at the expense of some surrounding areas.
OREGON
Number of seats: 6 (+1 from 2010s)
Party breakdown in 2012: 4-1 D
Current party breakdown: 4-1 D
Most overpopulated district: OR-1 (Western Portland suburbs)
Most underpopulated district: OR-4 (Eugene/Southwest)
Who controls redistricting: Democrats
2012 control: Split
Of the five states that touch the Pacific Ocean, Oregon is the only one left that lacks a redistricting commission. For 2012, a Democratic governor and a split legislature agreed on a minimal change plan — their job was, perhaps, made easier by the fact that the state was retaining its same five seats. But this year, the Beaver State, for the first time since the 1980 census, will be adding a new district.
Though Democrats nominally have a governmental trifecta, with the governorship and clear majorities in the legislature, Republicans are set to have a seat at the table. In a legislative compromise earlier this year designed to cut down on Republican stalling tactics on other legislative matters, state House Speaker Tina Kotek (D) announced that she would give the Republicans a greater role in redistricting. Assuming the deal holds, there will be an equal number of Democrats and Republicans on the House Redistricting Committee — so Democrats will not be able to pass maps out of the committee along a strictly party-line vote (although the deal applies only to the state House, not the state Senate, where Democrats will continue to hold sway on that chamber’s redistricting committee).
Of the state’s current incumbents, Reps. Earl Blumenauer (D, OR-3) and Suzanne Bonamici (D, OR-1) are likely the safest members. Though Blumenauer has a chunk of suburban Clackamas County, the bulk of his district comes from Portland’s Multnomah County. OR-3 typically gives Democrats over 70% of the vote, so he’ll have little to fear in any Multnomah County-based seat. Just to the west, Bonamici hails from Washington County, which includes suburbs like Beaverton and Tigard. Washington County itself has a population of roughly 600,000 — in other words, about 85% the population of the ideal congressional district — and Biden carried it 66%-31% last year.
Elsewhere in the state, Democrats will want to protect two of their members in more marginal seats. Reps. Peter DeFazio (D, OR-4) and Kurt Schrader (D, OR-5) have both shown impressive crossover appeal over the years, but both were held to just single-digit victories in 2020. DeFazio, who is the longest-serving member in the state’s current delegation (he was first elected in 1986), has a niche as a populist type of progressive. Both the University of Oregon (Eugene) and Oregon State University (Corvallis) are in DeFazio’s district, and these universities have provided him with a durable base of support, but the rest of the district has a more working class character — as in the Midwest, this demographic has moved more Republican. In 2010, despite the red hue of the year, DeFazio carried Coos County, a blue collar county that hugs the coast — 10 years later, he lost it by 17 points.
For Democrats, a simple solution to shoring up DeFazio may be to add Deschutes County to his district. This county, which contains Bend, is currently the most populous county in OR-2, the state’s sole GOP-held seat. Deschutes, with its relatively high concentration of college graduates, was a Trump-to-Biden county and seems increasingly dissimilar to the rest of OR-2, which is essentially the rural part of the state east of the Cascades. Though first-term Rep. Cliff Bentz (R, OR-2) carried Deschutes County by 51%-46% last year, given the trend of the area, he may prefer to take in the reddening parts of the current OR-4.
Overall, the biggest question about Oregon redistricting seems to be what will happen in the part of the state south of Portland but north of Eugene. Schrader, a Blue Dog who has pulled out clear wins even in some turbulent cycles for his party, is from Clackamas County, which includes suburban communities south of Portland. The mappers could give him all of that county, which supported Biden by 11 points last year, and some blue parts of adjacent counties, for a fairly secure seat. But would there be enough Democratic voters left over to ensure that the new seat votes blue?
Perhaps a compromise plan that could get some Republican support would be one that protects the current incumbents while adding a new swing seat — although with a seat at the table in redistricting, Republicans will likely push for a 4-2 Democratic map, giving them the state’s new seat. That outcome is our working assumption right now, but we all know what can happen to those who make assumptions, particularly about redistricting.
PENNSYLVANIA
Number of seats: 17 (-1 from 2010s)
Breakdown in 2012: 13-5 R
Current party breakdown: 9-9 Split
Most overpopulated district: PA-10 (Harrisburg/York/Carlisle)
Most underpopulated district: PA-15 (Northwest-Central PA)
Who controls redistricting: Split
2012 control: Republicans
In some ways, Pennsylvania has mirrored Michigan over the last several redistricting cycles: during the 2000 and 2010 rounds, Democrats complained as Republicans drew partisan maps — but now, as neither party has a monopoly on the remapping process, each state has a tied delegation. To get to that tied delegation, though, Democrats were helped by a 2018 state Supreme Court ruling: after Democrats won a majority of the body’s seats, in 2015, they threw out the GOP-drawn congressional map and enacted a new plan. Between the 2016 and 2018 cycles, Democrats added four members.
If Gov. Tom Wolf (D-PA) and the GOP-controlled legislature cannot agree on a plan — something that seems likely — the state Supreme Court may get another chance to draw a map. Still, the court won’t be able to take an entirely minimal change approach this time, as the state is losing a seat. Though Democrats would face a sympathetic court, population trends simply may not be in their favor: on a map with one fewer seat, some vulnerable Democrats may see their seats pick up more Republicans.
In northeastern Pennsylvania, Rep. Matt Cartwright (D, PA-8) already holds a Trump seat. Aside from some blue turf currently in Democratic Rep. Susan Wild’s next-door PA-7, there is not much friendly territory for Cartwright to add. Wild, in turn, probably can’t afford to lose very many Democrats: her PA-7 overlaps with most of the Lehigh Valley, an area that usually mirrors the statewide vote — in other words, it’s swingy.
Moving into the Philadelphia area, the Bucks County-based PA-1 is a swing seat on paper but Rep. Brian Fitzpatrick (R) has garnered serious crossover support since he was first elected, in 2016. Fitzpatrick is from a political family in the area, and assuming he is renominated (he won his past two primaries with “only” about two-thirds of the vote), he’d start out favored in any Bucks-centric seat.
Philadelphia proper contains enough population for just over two congressional districts. Rep. Brendan Boyle (D, PA-2) hails from the working-class northeastern part of the city, while Rep. Dwight Evans (D, PA-3) represents a Black-majority district there — under a similar map, each would be fine.
In Philadelphia’s suburban collar counties, three Democratic women were initially elected in 2018, and all could end up with similar seats. Just to the city’s southwest, Rep. Mary Gay Scanlon (D, PA-5) represents all of Delaware County. Assuming Delaware County is kept whole (it makes up most of a district), she’ll have somewhere to run. Similarly, Rep. Madeleine Dean’s (D, PA-4) district is essentially coterminous with suburban Montgomery County — as long as the county is not splintered multiple ways, she’ll likely have a safe blue seat. Finally, Rep. Chrissy Houlahan (D, PA-6) has a district that includes all of blue-trending Chester County. Houlahan’s PA-6 also reaches up into Berks County, to grab the city of Reading — PA-6 could simply take in more of Berks County. In 2020, Houlahan had the closest race of the three, but she still won by a clear 56%-44% margin. In the Trump era, Bucks County, which has more of a working class contingent, has replaced the more upscale Chester County as the least Democratic county in the collar — this swap has probably benefited both Fitzpatrick and Houlahan.
Moving into south-central Pennsylvania, if the court keeps a similar configuration, PA-10 may still be competitive. The current PA-10 includes the state capital, Harrisburg, as well as its suburbs, in Cumberland County, and reaches down to the city of York. Rep. Scott Perry (R, PA-10) is one of the delegation’s most conservative members: initially elected to a safer seat in 2012, he held on by a 51%-49% margin when the new seat was drawn and by a more comfortable 53%-47% last year — his 2020 opponent, former state Auditor Eugene DePasquale (D), is seriously considering a rematch. Next door, in PA-11, Republican Rep. Lloyd Smucker seems likely to run in whichever seat Lancaster County ends up in — one of the most historically GOP counties in the state, it makes up the majority of a district.
In southwestern PA, Pittsburgh proper is in Democratic Rep. Mike Doyle’s PA-18 (though the “PA-18” designation will be eliminated for the next Congress), a district that is contained entirely within Allegheny County. Next door, Rep. Conor Lamb (D, PA-17) is running for Senate and is leaving open a Trump-to-Biden seat that could become redder. Biden and Lamb each took 51% in PA-17 last year: the bulk of it comes from Pittsburgh’s northern suburbs (which have trended blue, but were Republican until recently), while it also includes reddening Beaver County and a small part of Butler County. Democrats would favor a map that unpacks Doyle’s district (Biden carried it by 30 points) by moving it into Westmoreland County, thereby freeing up closer-in Pittsburgh suburbs for PA-17 (ironically, the GOP gerrymander that was scrapped for 2018 had Doyle representing a tiny part of Westmoreland County). Republicans would rather see the Pittsburgh seat stay entirely within Allegheny County — that way, PA-17 would have to expand its holdings in the adjacent, and redder, counties.
Aside from Perry, none of Pennsylvania’s Republicans had especially close races last year. Though one of the GOP-held seats may end up getting eliminated — geographically, they hold several districts in the depopulating middle of the state — Republicans may have some promising opportunities to flip new seats next year.
RHODE ISLAND
Number of seats: 2 (no change from 2010s)
Breakdown in 2012: 2-0 D
Current party breakdown: 2-0 D
Most overpopulated district: RI-1 (Most of Providence/eastern Rhode Island)
Most underpopulated district: RI-2 (Western Rhode Island)
Who controls redistricting: Democrats
2012 control: Democrats
Rhode Island was on the bubble in the 2020 reapportionment, and it surprisingly ended up keeping its second seat. Whether Rhode Island lost a seat or kept it, the analysis was going to be pretty straightforward either way: Democrats either would hold two safe seats in the state, or they would hold one.
The Ocean State’s two districts divide the state into western and eastern halves, and each contains part of the state’s largest city and capital, Providence. The eastern part is geographically smaller and runs down to Newport, the seaside tourist destination that is also home to the Naval War College. The western RI-2 contains most of the state’s land mass and is less diverse. Donald Trump came within about seven points of winning RI-2 in 2016, though he lost the district by close to double that in 2020, and Rep. Jim Langevin (D, RI-2) was not seriously challenged even in 2016. RI-1 backed Biden by nearly 30 points last year.
If it was an open seat and if aided by other circumstances, Republicans could hypothetically compete for RI-2, so perhaps Democrats will want to shore up the district to some degree. But Democrats also could just make very minimal changes, as RI-1 only has to shed roughly 5,000 residents to RI-2.
SOUTH CAROLINA
Number of seats: 7 (no change from 2010s)
Party breakdown in 2012: 6-1 R
Current party breakdown: 6-1 R
Most overpopulated district: SC-1 (Charleston suburbs)
Most underpopulated district: SC-6 (Charleston/Columbia/Black Belt)
Who controls redistricting: Republicans
2012 control: Republicans
Since the 1990 census, either of the Carolinas has gained a district: after two consecutive rounds, 1990 and 2000, of adding seats, North Carolina remained stagnant at 13 districts after 2010 (but the state is adding a 14th seat for the 2020s), while South Carolina jumped from 6 to 7 last decade. The question of the new seat’s placement led to a more dramatic redistricting than usual in South Carolina, despite total Republican control of the process. Essentially, while the state House placed the new 7th seat in the Pee Dee River Basin, the state Senate plan placed it south of Charleston. The result was a compromise that tracked closer to the House plan, and legislators had the goal of a 6-1 Republican delegation.
For most of the decade, the map worked as intended. The 1st District, which hugs coastal communities around Charleston, was the only district to see partisan turnover. In 2018, when pro-Trump Republicans in the 1st District primaried out Rep. Mark Sanford (a former governor who had also represented SC-1 in the 1990s), Democrats snagged the seat with Joe Cunningham. In 2020, though Trump’s margin dropped from 53%-41% to 52%-46%, Cunningham narrowly lost to now-Rep. Nancy Mace. While Mace initially showed some of Sanford’s independence, she has since seemed more of a mainstream Republican.
In any case, Mace may benefit from the state’s population trends: her SC-1, the most populated district, is adjacent to SC-6, the least populated. The 6th District has sent now-Democratic Majority Whip Jim Clyburn to Congress ever since it became a Black-majority seat, in 1992, and it will need to pick up tens of thousands of residents. The 6th could easily grab some Democratic-leaning Charleston precincts in SC-1, which would push the latter seat a few points to the right.
Though both seats are currently held by Republicans, a similar tradeoff could take place between districts 3 and 4 in Upstate South Carolina. SC-4, which is the Greenville-Spartanburg area, has gotten smaller (geographically) over the last several decades, and it could simply transfer more of its Greenville County precincts to SC-3, a rural seat which needs to gain population.
The districts in between Lowcountry and Upstate may not see many changes: all three are already within two percentage points of the ideal district population and each is reliably red, although the 2nd, held by Rep. Joe Wilson (R), could perhaps be strengthened as it became a little less Republican over the course of the decade.
TENNESSEE
Number of seats: 9 (no change from 2010s)
Party breakdown in 2012: 7-2 R
Current party breakdown: 7-2 R
Most overpopulated district: TN-4 (South-Central Tennessee)
Most underpopulated district: TN-9 (Memphis)
Who controls redistricting: Republicans
2012 control: Republicans
Going into the 2011 redistricting process, Republicans were riding high in Tennessee. In 2010, they picked up the governorship and turned a 5-4 Democratic majority in the congressional delegation to a solid 7-2 GOP advantage. Importantly, the three seats that Republicans gained seemed solid: they’d all given McCain double-digit wins in 2008, and the GOP freshmen were replacing entrenched Democrats, whose appeal would be hard for future Democratic challengers to replicate.
So with Republicans’ existing edge in the delegation, the 2011 redistricting in Tennessee was in large part driven by incumbent, not partisan, considerations. For example, then-Rep. Diane Black (R, TN-6) won her 2010 primary with a 31% plurality — it was not surprising when Rutherford County, where her two main primary opponents fared well, was removed from the district.
Though Tennessee Republicans ended up passing a map that preserved their comfortable 7-2 advantage, more aggressive options were considered. While Memphis’ TN-9 is heavily Black (radically altering it would have surely result in court challenges), Nashville’s TN-5, which is white-majority, emerged as a possible target. Currently, the three districts that surround TN-5 are all ruby red (each gave Trump at least 67% in 2020), so it would not be hard to dilute Democratic votes in Nashville by splitting them up among several districts.
In Map 13, Davidson County is split among four districts — the most Democratic of these seats is TN-5, which would have given Trump 57% both times he was on the general election ballot. We used the Cumberland River, which bisects Nashville, as something of a natural guide, but the are many ways to crack the county.
Map 13: Hypothetical pro-Republican gerrymander of Tennessee
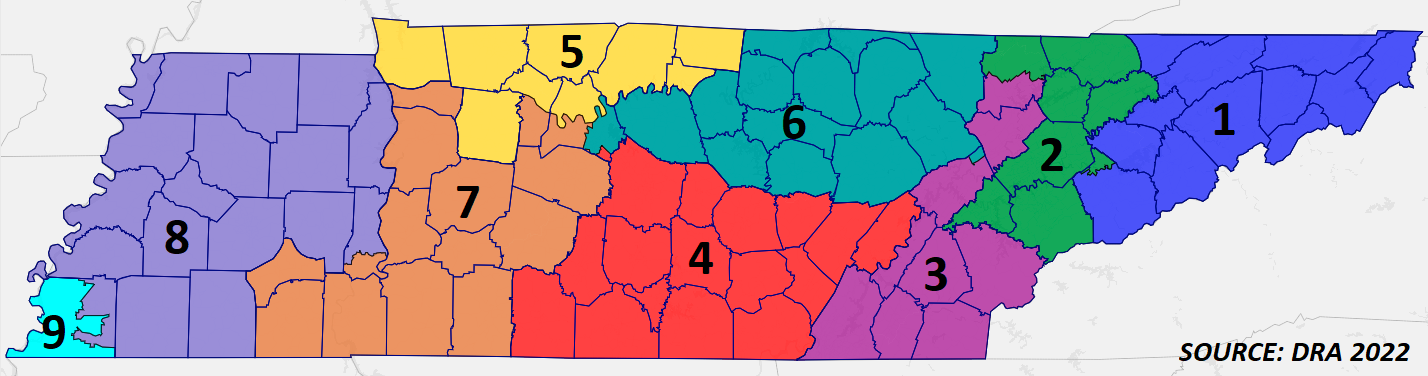
One reason why Republicans didn’t attempt an 8-1 map in 2011 may have been TN-5’s incumbent. Rep. Jim Cooper (D, TN-5), a moderate Democrat who has represented the Nashville area since 2002, used to hold a rural seat earlier in his career, where he was reelected easily in the 1980s and early 1990s. Given Cooper’s record in non-metropolitan parts of the state, it was feasible that he’d hold on in a redder district. But rural Tennessee has continued to shift rightward, and even the strongest statewide Democrats have struggled to find much crossover appeal there. Our sources on both sides of the aisle believe that Cooper is in serious danger of seeing his district broken apart, allowing Republicans to likely net an extra seat in Tennessee.
From a demographic perspective, many of the state’s fast-growing counties form a crescent around Nashville: Sumner and Wilson counties are in TN-6, Rutherford was moved into TN-4 for 2012, and Williamson County, the state’s wealthiest and most college-educated county, has been in TN-7 since 2002. A decade ago, those four counties had 720,000 residents, or just over the population of a single district — they now claim 860,000 residents, which is 115,000 over the ideal district population. On the other extreme, TN-9 has seen the slowest growth, and needs to add roughly 60,000 people — it will likely pick up some suburban Memphis precincts from TN-8, but it should still be around 65% Black. TN-8, which takes in West Tennessee, was amenable to Democrats 15 years ago, but is now a safely red seat, and it probably won’t change as much as the Nashville-area districts.
The only two counties east of the Nashville area where Joe Biden cracked even 40% of the vote were Knox (Knoxville) and Hamilton (Chattanooga); they anchor TN-2 and TN-3, respectively. While those counties have seen some pro-Democratic trends, both districts contain a handful of deeply red rural counties, so Republicans should feel secure in each. Finally, TN-1 will likely see minimal changes — it’s been nestled in the northeastern corner of the state for essentially the state’s entire history and last elected a Democrat in 1878.
TEXAS
Number of seats: 38 (+2 from 2010s)
Party breakdown in 2012: 24-12 R
Current party breakdown: 23-13 R
Most overpopulated district: TX-22 (Houston Suburbs/Exurbs: Ft. Bend/Brazoria counties)
Most underpopulated district: TX-13 (Panhandle)
Who controls redistricting: Republicans
2012 control: Republicans
A mid-1960s scholarly article on gerrymandering has as part of its title “Dragons, Bacon Strips, and Dumbbells,” which are terms sometimes used to describe what heavily gerrymandered districts look like. There’s no shortage of these kinds of shapes in Texas, one of or perhaps the most consistently gerrymandered state in the country for many decades: previously by Democrats, now by Republicans.
Back in 1994, a year when Republicans won a majority of seats in the South for the first time in modern history (and the House majority for the first time in four decades), the Democratic gerrymander of Texas endured: Republicans won the aggregate statewide House vote by 14 points, but won only 11 of the state’s 30 seats (that aggregate vote is inflated, as Democrats left five seats uncontested while Republicans had a candidate in every seat, but this was still a clear gerrymander). In the Democrats’ 2018 national wave year, Republicans won 64% of the seats with less than 52% of the two-party vote (though the Republicans left four seats unopposed).
There’s no question that Texas has become a more competitive state at the presidential level in recent years. Mitt Romney won the state by 16 points in 2012, and then Donald Trump won it by only nine in 2016 (that was as the national popular vote contracted from Barack Obama by four to Hillary Clinton by two, so Texas became markedly less Republican compared to the nation as a whole). In 2020, Trump won the state by 5.5 points, meaning that Trump did about 3.5 points worse last year than he did in 2016.
This is evident across the state’s gerrymandered districts, many of which got much more competitive over the course of the decade as Republican strength waned in growing suburban areas across the state. Trump’s 2020 margin was at least 10 points worse than Romney’s 2012 margin in 15 of the state’s 36 districts. Moreover, the Republican slippage was apparent in the state’s close 2018 Senate race, when 20 of the 36 districts voted more Democratic than the state as a whole. Democrats, at both the presidential and congressional level, flipped two formerly Safe Republican seats by the end of the decade: those now held by Reps. Colin Allred (D, TX-32) and Lizzie Pannill Fletcher (D, TX-7). Biden flipped a third, TX-24, but first-term Rep. Beth Van Duyne (R) narrowly held it as an open seat last fall, and he came within three points or less of flipping seven more. In other words, the Republican gerrymander generally endured, but it was showing major signs of strain by last fall.
Though Texas is getting closer at the presidential level, it still pretty clearly leans Republican, and that’s a little more pronounced at the congressional level. In all 23 seats they won, the Republican House candidate got a larger share of the vote than Trump. Republican challengers also did better than Trump against the two new Democratic incumbents, Fletcher and Allred, which indicates a lingering Republicanism below the surface even in some districts that are clearly leaning Democratic now at the presidential level.
The Democrats did not gain everywhere in the state at the presidential level, though. Joe Biden’s 2020 margin was between 14-19 points worse than Barack Obama’s 2012 margin in three districts — TX-15, TX-28, and TX-34 — that cover South Texas, although the districts’ three Democratic incumbents all did at least a little bit better than Biden.
With 38 districts for Republicans to draw, and Democratic lawsuits a certainty, we’re not going to pretend to be able to handicap what might happen, other than to say that our expectation is that Republicans will come out of Texas with a bigger advantage in the delegation than they hold now. How much bigger? It’s hard to say. Still, there are some observations we can make:
— Many of the Republican-held districts where GOP performance eroded in the 2010s are, to borrow the term from above, “bacon strips” that extend out from major urban areas into rural areas and or link two urban areas with wide swathes of dark red Republican areas in between. Perhaps the most striking example of this is TX-21, held by Rep. Chip Roy (R). His district stretches from downtown Austin to northern San Antonio, while also taking in rural areas whose most famous inhabitant was President Lyndon B. Johnson. Republicans will want to strengthen many of these districts, or they risk losing them later in the decade.
— One way to do that would be to make some Democratic districts stronger, or even create a new Democratic vote sink or two to make the other districts more reliably Republican. For instance, Republicans may consider drawing a safely Democratic district in Austin as a way to protect several Republican incumbents whose districts currently cover parts of Austin’s Travis County. This is something the Republicans arguably could or should have done last decade, although it didn’t end up hurting them, as they held all their Travis County seats the whole decade despite some close calls. Tadeusz Mrozek, an Election Twitter mapmaker, drew a hypothetical Republican gerrymander that creates a new, heavily Democratic district in Austin but otherwise is designed to elect 27 Republicans and 11 Democrats statewide. Republicans may also decide that, instead of targeting Allred and/or Fletcher, they could just change their currently Democratic-leaning swing seats into very safe Democratic districts.
— In the Houston area, Rep. Kevin Brady’s (R, TX-8) retirement may be convenient for Republicans. While TX-8 takes in some rural counties, the heart of the district is Montgomery County, a veritable wellspring of Republican votes — in fact, it was the only county, nationally, that gave Trump a margin greater than 100,000 raw votes in both 2016 and 2020. Without an incumbent to consider, GOP mappers could unpack Brady’s 8th District to buffer up adjacent Republican districts.
— Depending on how enduring the Trump 2020 surge was among Latinos in South Texas — and this is an open question, although some signs of Democratic weakness in the region also appeared in Beto O’Rourke’s (D) otherwise impressive but unsuccessful challenge of Sen. Ted Cruz (R-TX) in 2018 — Republicans very well may try to grab one of those three South Texas seats. Rep. Filemon Vela (D, TX-34) has already announced his retirement from one of them.
One of the themes in public reporting about GOP gerrymandering efforts across the country is a push and pull between being maximally aggressive and grabbing as many Democratic seats as possible in order to ensure a 2022 House majority versus being a bit less aggressive and designing districts that can elect Republicans throughout the decade. Rep. Patrick McHenry (R, NC-10) summed it up in a quote to Politico: “There’s an old saying: Pigs get fat. Hogs get slaughtered. And when it comes to redistricting, that is, in fact, the case.” We’ll spare you any more reference to pig products and pig product production, as there’s been plenty of that in this section, although Democrats reading this are plenty queasy already.
UTAH
Number of seats: 4 (no change from 2010s)
Party breakdown in 2012: 3-1 R
Current party breakdown: 4-0 R
Most overpopulated district: UT-4 (Salt Lake City suburbs, Central Utah)
Most underpopulated district: UT-3 (Provo, Southeast Utah)
Who controls redistricting: Republicans
2012 control: Republicans
One feature of the Republicans’ better-than-expected performance in the 2020 elections was them capturing some seats that they may have been able to use gerrymandering to target in 2022. A good example is UT-4, which over the course of the 2010s was the only competitive district in the state. Democrats won it in 2012 and 2018, while Republicans won it in 2014, 2016, and 2020, when now-Rep. Burgess Owens (R) defeated then-Rep. Ben McAdams (D) by a percentage point. Owens’s victory restored a 4-0 Republican House delegation in Utah — meaning that there’s no way for Republicans to do better than that in 2022.
Now, instead of targeting McAdams for defeat in 2022 — much as Republicans tried to do to Democrat Jim Matheson in 2012 — the Republican focus will be on protecting Owens and trying to ensure the 4-0 GOP edge endures throughout the decade.
Despite being the clear minority party in Utah, Democrats have often competed credibly for Utah House seats. Over the last six decades, going back to 1962, Utah has elected at least one Democrat to the House in 19 of 30 elections, and Democrats held a majority of the state’s seats in the early 1970s and early 1990s. Fast-growing Utah added a third House seat in the 1980 reapportionment, and a fourth in the 2010 reapportionment after very narrowly missing out on it in the 2000 census (that seat went to North Carolina instead, as Utahns complained that Mormon missionaries abroad were not counted).
In 2018, Utah voters narrowly voted to create an independent redistricting commission. However, this commission does not have final authority on the maps — rather, the state’s Republican-controlled legislature does. That’s why our expectation is that they will work to protect Owens, the only member who sits in a competitive district.
A common issue in Utah redistricting is what to do with Salt Lake County, home of the state’s capital and roughly 35% of the state’s population. Like many other big counties, Salt Lake has taken a turn toward the Democrats in recent years. In 2008, Barack Obama was the first Democrat to carry the county for president since Lyndon Johnson in 1964, albeit only by about a tenth of a percentage point. Mitt Romney, who like the majority of Utah residents is a Mormon, then carried the county by 20 points. But Donald Trump was a weaker GOP nominee for Utah, and Salt Lake County voted for Hillary Clinton by nine and Joe Biden by 11.
A guiding principle of Utah Republican redistricting strategy, for decades, has been that all of the state’s districts should contain both urban and rural portions. That position, particularly now, has become politically self-serving, as Democrats would likely win and be able to hold a district that was included entirely in Salt Lake County. As it stands now, all four of the state’s districts contain at least some of the Salt Lake metro area. In the 2012 redistricting round, Utah accommodated its fourth seat by further splitting Salt Lake County, which was designed to knock out the aforementioned Matheson. Surprisingly, Matheson held on in 2012, but he retired in 2014. The district has featured competitive races since then, but Democrats only broke through in 2018.
One thing that could aid Republicans in their quest to lock in a 4-0 delegation is that last week’s census release revealed that deeply Republican Utah County, the state’s second-most-populous county and home to Brigham Young University in Provo, was growing faster than the state as a whole. Utah County’s growth is especially impressive because Utah, which grew by over 18% over the past decade, was the fastest-growing state in the Union. Meanwhile, Salt Lake County was growing slower than the state as a whole. On the other hand, UT-4 itself, as currently drawn, is the only one of the state’s four districts that is overpopulated, while the other three need to gain population. Republicans also need to be mindful of preserving their strength in UT-2, the district that actually covers most of Salt Lake City proper: Donald Trump won UT-2 by 16 points, and UT-4 by nine. Weakening Republican performance in UT-2 to shore up UT-4 could hypothetically make it competitive under the right circumstances. Fortunately for Republicans, the state’s other two districts are much more deeply Republican: Trump won northern Utah-based UT-1 by 33 points and the central/southeastern-based UT-3 (which includes Provo) by 25 points.
The current Utah districts are sometimes compared to pizza slices or even spokes on a wheel. Turning the wheel a little bit might do the trick for Republicans, although there may come a time in the future where the party cuts its losses and just draws a Democratic vote sink covering most of Salt Lake County. Had McAdams won, maybe they would have considered that. But with a 4-0 delegation, they should be OK just by modifying the current districts.
VIRGINIA
Number of seats: 11 (no change from 2010s)
Breakdown in 2012: 8-3 R
Current party breakdown: 7-4 D
Most overpopulated district: VA-10 (Northern Virginia: Leesburg/McLean/Manassas)
Most underpopulated district: VA-9 (Western Virginia)
Who controls redistricting: Commission
2012 control: Republicans
Virginia, which includes the former capital of the Confederacy and has long been identified as a pillar of the Old South, now stands apart from the nation’s historically most conservative region. It has become so much of an outlier that we grouped it not with the South in this series, but rather with the Mid-Atlantic/Northeastern states.
The Old Dominion was the only Southern state that Hillary Clinton won in 2016, and one of only two Joe Biden won in 2020 (Georgia was the other). Democrats control only two state legislative chambers in the entire South: the two in Virginia, although the state House of Delegates is on the ballot this fall, along with the state’s three state-level statewide elected offices (governor, lieutenant governor, and attorney general, all of which the Democrats also hold). Virginia is also the only Southern state that now has a commission system for redistricting: Voters approved it in a statewide vote last year after the legislature put it on the ballot.
Without this new system, Democrats would control the levers of redistricting in the state and could strengthen and even expand their 7-4 edge in the state’s congressional delegation. As it stands now, it is unclear who may come out ahead, but Republicans could conceivably re-take a majority in the state’s congressional delegation next year.
A decade ago, Republicans held gerrymandering power in Virginia, and they drew a map that resulted in an 8-3 Republican delegation in both 2012 and 2014. But a racial redistricting lawsuit forced the unpacking of Rep. Bobby Scott’s (D, VA-3) then-majority-Black district. That change transformed Scott’s Richmond-to-Norfolk district into one centered just on the Hampton Roads area, freeing Richmond and other Democratic areas to be put into VA-4, which now-Rep. Don McEachin (D) easily won. The changes also weakened Republican performance in VA-7, which contains western parts of the Richmond area and extends into Central Virginia. Conversely, the new map strengthened Republicans in VA-2, which covers Virginia Beach and other parts of Hampton Roads. Democrats ended up winning and holding both VA-2 and VA-7 in 2018 and 2020 — it seems likely that they would have come up short in VA-7 without the changes.
So the 2016 remap contributed to Democrats winning two additional seats, and they flipped VA-2 even though redistricting made the district less Democratic. The pre-2016 remap was only partial, and Democrats won the unchanged VA-10 in 2018, a highly-educated Northern Virginia suburban seat that has shifted so heavily against Republicans that it isn’t really a swing seat anymore: Mitt Romney won it by a point in 2012; eight years later, Trump lost it by 19.
As of now, Democrats control seven seats and Republicans control four. The Democrats hold four seats in the combined Richmond/Hampton Roads area, and they hold the three dedicated Northern Virginia seats. Republicans hold three districts in Western/Central Virginia — an area our former colleague Geoffrey Skelley once described as “RoVa,” as in the Rest of Virginia outside of Northern Virginia/Greater Richmond/Hampton Roads — and one district, VA-1, that extends from the southern portions of Northern Virginia’s fast-growing Prince William County all the way down to the fringes of Colonial Williamsburg. That district has become more competitive recently, as Trump only won it by about 4.5 points, although Rep. Rob Wittman (R) ran way ahead of Trump.
The commission, composed of a bipartisan group of state legislators and citizens, is off to a rocky start, to the point where some — particularly Democrats — worry that the commission process, which also involves getting approval from the state legislature, will fail. If that happens, it will be up to the conservative state Supreme Court to draw the maps (the justices on that court are appointed by the state legislature, which has been mostly dominated by Republicans for the past couple of decades). The commission did recently agree to try to start from scratch on creating new maps as opposed to using the current districts as a template. One could interpret this as a positive for Democrats, given that the current congressional map was drawn, at least in part, by Republicans. However, as noted above, that gerrymander was altered in important ways already.
It’s also hard to really “start from scratch” on a redistricting map. For instance, the current Democratic-held VA-3 and VA-4 are substantially Black (though neither are currently majority-Black). Significantly strengthening or weakening the Black population in those districts could spur litigation. Additionally, the “Fighting Ninth” district has been based in the southwestern corner of the state since Reconstruction. VA-9 needs to add population and is surrounded on three sides by other states: it will need to expand further east, it’s simply a question of where. VA-9 is bordered to the east by VA-6, a heavily Republican district that contains the Democratic city of Roanoke and the heavily Republican Shenandoah Valley, and VA-5, a Republican-leaning central/southern Virginia seat that has recently hosted some competitive races. Those districts are also underpopulated, so the next versions of each will have to move further north and/or east.
The Northern Virginia districts are all overpopulated and will need to contract to some degree. VA-2 in Hampton Roads, held by Rep. Elaine Luria (D), is underpopulated, and it is hard to reconfigure the district as anything other than a swing seat, particularly given the likelihood that neighboring VA-3 and VA-4 aren’t likely to change much. About 60% of VA-2 comes from Virginia Beach, a Trump-to-Biden locality that has usually voted roughly five percentage points more Republican than Virginia as a whole in recent statewide races. VA-7, the Greater Richmond/central Virginia seat held by Rep. Abigail Spanberger (D), could be made either more or less Democratic. If Democrats were in charge of the process, they might have followed Interstate 64 to link the Richmond part of VA-7 with Democratic Charlottesville/Albemarle County — this would produce a blue-leaning seat. An iteration of this seat is possible, but Republicans will likely fight against it. VA-5, which currently covers Charlottesville, would become safely Republican if the city was moved into another district, but the district also could be reconfigured in such a way that it would remain competitive under the right circumstances.
With a first-time commission process unfolding that potentially has a conservative-leaning backstop in the Supreme Court of Virginia, this is a hard process to handicap. Democrats likely will come out of this process with three safe seats in Northern Virginia and two in Richmond/Hampton Roads. Republicans should come out of it able to at least defend the four seats they hold now, although the trajectory of VA-1 and whether it becomes a swing seat, either through redistricting now or political changes later, will merit monitoring. Then it’s just a question of how the state’s two most competitive seats, Democratic-held VA-2 and VA-7, end up looking. If both remain marginal, Republicans should seriously be able to contest both, and redistricting could make their job easier in one or both seats.
If Republicans are able to hold what they currently have and flip VA-2 and VA-7, Virginia will regain a commonality it recently shared with the rest of the classically-defined South: a Republican majority in its congressional delegation.
WASHINGTON
Number of seats: 10 (no change from 2010s)
Party breakdown in 2012: 6-4 D
Current party breakdown: 7-3 D
Most overpopulated district: WA-7 (Seattle)
Most underpopulated district: WA-6 (Olympic Peninsula)
Who controls redistricting: Commission
2012 control: Commission
In Washington state, redistricting has been the prerogative of a bipartisan commission since the 1980s. In 2011, with the state gaining a seat, members of the commission ended up striking a deal: while the new seat would be a blue-leaning district in the Olympia area, WA-1, which was being vacated by now-Gov. Jay Inslee (D-WA), would become slightly more amenable to Republicans.
The new WA-10, as expected, elected a Democrat, but the party also retained its hold on WA-1 — now-Rep. Suzan DelBene claimed the redrawn seat 54%-46%, and has only won by larger margins since.
Both 2014 and 2016 were fairly sleepy election cycles in the Evergreen State, as no districts traded hands. But 2018 was more eventful. Rep. Dave Reichert (R, WA-8), a popular Republican who held a swing district in the Seattle suburbs, announced his retirement. Republicans ran a credible candidate in Dino Rossi — between 2004, 2008, and 2010, he came out on the losing end of three close statewide races, and was well-known — but the seat flipped to now-Rep. Kim Schrier (D), a physician who was then a first-time candidate. Schrier won by almost five points in 2018, though her margin was slightly reduced in 2020.
Though much of WA-8’s vote comes from the Seattle area, specifically King and Pierce counties, some rural counties — Chelan, Kittitas, as well as a small part of Douglas — were added to the seat for 2012, presumably to help Reichert. The three rural counties are all located in the Cascade Mountains, and don’t have especially much in common with the urban parts of WA-8. If the commission prioritizes incumbent protection, WA-8 may lose its eastern counties, though this would mean the district would lose its iconic Scottish Terrier Shape.
In 2018, Democrats made serious attempts at districts 3 and 5, but it’s likely that both seats will remain Republican-leaning. WA-3 has been based in southwestern Washington for the past several decades — once home to a vibrant timber industry, Democratic fortunes in the area have waned as the rural pockets of the district have fallen on harder times. In 2010, now-Rep. Jaime Herrera Beutler (R) won the district over now-Lt. Gov. Denny Heck (D-WA) — even though 2010 was a rough year for Democrats nationally, Herrera Beutler was the sole Republican to flip a seat in a West Coast state. About 80% of the current WA-3 comes from Clark County (Vancouver) and a few peripheral counties — Clark County has a slight Democratic lean, but the surrounding areas have moved increasingly to the GOP — so it seems mappers wouldn’t have too much room to radically alter a Vancouver-centric seat.
In eastern Washington, the 5th District has sent Republican Cathy McMorris Rodgers to Congress since 2004 — from 2013 to 2019, she was Chair of the House Republican Conference, and remains an influential player in the caucus. In 1994, WA-5 was the site of one of the greatest recent congressional upsets, as Democratic Speaker Tom Foley lost his seat in that Republican wave year. Tellingly, the district has changed little since Foley left office — Democrats have a base in Whitman County (which houses Washington State University) and can sometimes carry Spokane County (the largest county in the district), but the rural counties usually give Republicans large majorities. McMorris Rodgers won by nearly 10% against a credible opponent in 2018, and her race completely fell off the radar in 2020.
WA-7 which takes up much of Seattle proper and is held by Rep. Pramila Jayapal (D), needs to shed nearly 60,000 residents. As WA-7 usually gives Democrats over 80% of the vote, this could essentially amount to an “unpacking,” as the districts around it could get bluer.
So overall, we don’t expect Washington state’s delegation to look much different in 2022 — only one seat changed hands over the last decade. If a similar plan is adopted, the next 10 years could be just as static. Democrats seem likely to be clear favorites in six districts, while their hold on WA-8 may be somewhat tenuous, depending on if it retains its eastern counties. Rep. Herrera Beutler, who voted for Trump’s impeachment, faces several more conservative challengers in her all-party primary, but we’d probably start any Republican there off as a favorite against a Democrat.
WEST VIRGINIA
Number of seats: 2 (down 1 from 2010s)
Party breakdown in 2012: 2-1 R
Current party breakdown: 3-0 R
Most overpopulated district: WV-2 (Charleston/Eastern Panhandle)
Most underpopulated district: WV-3 (Southern coalfields)
Who controls redistricting: Republicans
2012 control: Democrats
In 1952, when voters in a Charleston-area district first sent Robert Byrd to Congress, he was part of the state’s six-member House delegation. Six years later, Byrd made the jump to the Senate, where he’d serve for more than half a century. While Byrd used his clout to steer resources to the state, demographic trends have not been kind to West Virginia: today, some counties in the state’s southern coalfields claim less than half of their 1950 populations.
At the start of the next Congress, the Mountain State will be down to just two seats in the House. Even worse for Republicans, who have full control of state government for the first census since the Hoover Administration, is that one of their own members will have to go — they hold all three of the state’s seats.
Though Democrats, who had a government trifecta in 2011, considered some creative plans last cycle, they ultimately took a minimal change approach. In what was dubbed the “Mason County flip,” just one county on the entire map changed districts (Mason County was moved out of WV-2 and into WV-3).
West Virginia has always kept counties whole. In a ruling that defined the state’s 2011 redistricting outcome, the U.S. Supreme Court maintained that, in the interest of keeping counties whole, a greater-than desirable population deviation between districts is permissible. There are several combinations of whole counties that could produce two districts.
Since 1992, the most awkward district on the map has undoubtedly been the 2nd District, which includes both the Charleston metro area and the Eastern Panhandle. As the Washington, D.C. suburbs have spilled into the panhandle, the two extremes of WV-2 have become increasingly dissimilar.
An obvious fix would be to essentially split WV-2 in two. WV-2’s panhandle could easily be given to WV-1, which is based in Morgantown and includes the state’s Northern Panhandle, while Charleston’s Kanawha County would be grouped with the southern coalfields, which make up the current WV-3.
Though Rep. Alex Mooney (R, WV-2) has a base in the Eastern Panhandle (before his time in Congress, he served in Maryland’s legislature) and would probably prefer an east-west configuration, the state’s cultural, and political, lines seem to fall on more of a north-against-south axis.
Regardless of which Republicans are bunked together, West Virginia is so red these days that virtually any two districts there would both vote safely Republican.
WISCONSIN
Number of seats: 8 (no change from 2010s)
Breakdown in 2012: 5-3 R
Current party breakdown: 5-3 R
Most overpopulated district: WI-2 (Madison)
Most underpopulated district: WI-4 (Milwaukee)
Who controls redistricting: Split
2012 control: Republicans
In 2011, Republicans in Wisconsin came up with what would become one of the decade’s most effective plans. In 2010, the Badger State congressional delegation flipped from 5-3 Democratic to 5-3 Republican — five cycles later, the balance has not changed.
Ten years ago, a key objective of Republican map drawers was to turn veteran Rep. Ron Kind’s (D, WI-3) western seat into a Democratic sink while protecting then-first-term Rep. Sean Duffy (R, WI-7), who had just flipped a rural seat to the north. Portage County, which contains the college town of Stevens Point, was shifted from WI-7 to WI-3, while WI-7 picked up some redder areas of WI-3.
As it turned out, Duffy didn’t need help: the 7th District has stayed comfortably in GOP hands since 2010, and even the older, more Democratic version would have stayed red. Kind’s district, though it was made bluer, still trended red anyway: it voted for Obama and Trump twice, while former Gov. Scott Walker (R-WI) carried it in his three successful gubernatorial runs, but not in his 2018 loss. In 2020, as Trump slightly improved his showing in WI-3, Kind was held to just a three-point margin — this was the closest race of his career (though he may have still won, he caught a lucky break in 2016, as Republicans did not field a challenger against him).
Given these larger-scale shifts, it was not too surprising when Kind announced his retirement earlier this month. With the redistricting process split between a Democratic governor and a Republican legislature, the configuration of WI-3, which is the only truly marginal seat on the map, will almost certainly be a point of contention. Republicans can take some comfort that the state Supreme Court, which could end up drawing the map if the process deadlocks, is controlled 4-3 by GOP-aligned judges, although Justice Brian Hagedorn has shown something of an independent streak.
Currently, about 40% of WI-3’s votes come from three “urban” counties: Eau Claire, La Crosse, and Portage. That trio gave Biden a 54%-44% margin last year, while the rest of the district gave Trump a 57%-41% vote — for perspective, in 2012, Obama carried its urban counties 57%-42% and the rest by 53%-45%. In an ideal arrangement for Democrats, WI-3 would take in some bluer turf in the orbit of Madison’s Dane County, such as Iowa County. Depending on what is added and/or subtracted, WI-3 could become a narrow Biden seat. Dane County makes up most of WI-2, and any version of the district containing it would be deep blue. Republicans would probably rather give the 3rd District more of northern Wisconsin, as WI-7 (now the reddest district in the state based on the 2020 presidential results) has GOP votes to spare.
In the Milwaukee area, WI-4 will have to pick up about 40,000 residents. It already contains all of Milwaukee proper, so it will probably have to pick up one of the whiter suburbs around it (WI-4 is majority-nonwhite by composition). WI-1 and WI-5 both take up substantial chunks of Milwaukee County, but they will not be hard to shore up, as heavily GOP Waukesha County is split between the two districts. Before 2002, WI-1 did not have much of Waukesha County, but, as a pro-incumbent plan was passed that cycle, more of it was added to strengthen then-Rep. Paul Ryan (R, WI-1), who would later be the vice presidential nominee on the 2012 GOP presidential ticket as well as Speaker of the House. The 2000 version of WI-1 actually favored Al Gore in the presidential race that year (though Ryan routinely overperformed). If WI-1 is taken out of Waukesha County, it may be competitive, but this doesn’t strike us as especially likely.
Going a bit north, WI-6 and WI-8 probably won’t see large partisan changes. WI-6 is based in east-central Wisconsin and, aside from a sliver of Milwaukee County that it contains, Trump carried every county in the district. WI-8 has long been a Green Bay-area seat, and Rep. Mike Gallagher (R, WI-8) has performed well in his three successful elections, though he has been mentioned as a potential Senate candidate if Sen. Ron Johnson (R-WI) retires.
Given the tense partisan atmosphere in Wisconsin, it seems more likely than not that the courts will have to get involved. If a status quo plan is adopted, Democrats would essentially be guaranteed to only hold districts 2 and 4, while WI-3, without Kind, would probably be a Toss-up, at best. So Republicans could end up getting to a 6-2 delegation in what is otherwise a very evenly divided state.