KEY POINTS FROM THIS ARTICLE
— The American electorate has changed dramatically over the past 40 years, and a pair of factors — race and education — have driven the changes.
— The electorate has become more diverse and more highly educated. Democrats rely heavily on nonwhite voters and have improved with white college-educated voters, while Republicans have cut deeply into Democratic support with non-college whites.
— Racial and cultural issues, rather than economic ones, have fueled Republican gains with the non-college white electorate.
How the electorate has changed
The American electorate has changed dramatically over the past 4 decades. This transformation has involved changes in both the demographic composition of the electorate and the party loyalties of major demographic groups. In this essay, I describe long-term trends in the demographic composition of the electorate and in the party loyalties of key demographic groups, focusing on two crucial demographic variables: race and education. I then examine the forces driving the striking shift in the party loyalties of the group that still makes up the largest share of the American electorate — white voters without a college degree, a group often referred to as the white working class.
Demographic change
Figure 1 displays trends in the demographic composition of the American electorate between 1980 and 2020. The data displayed in this graph show that the electorate that voted for Joe Biden in 2020 was very different from the electorate that voted for Ronald Reagan in 1980. Over these 40 years, the electorate has become both more racially diverse and more educated. The white share of the electorate has fallen from 84% in 1980 to 66% in 2020. At the same time, the share of the electorate without a college degree has fallen from 84% in 1980 to 63% in 2020.
Figure 1: Composition of the American electorate by race and education, 1980-2020
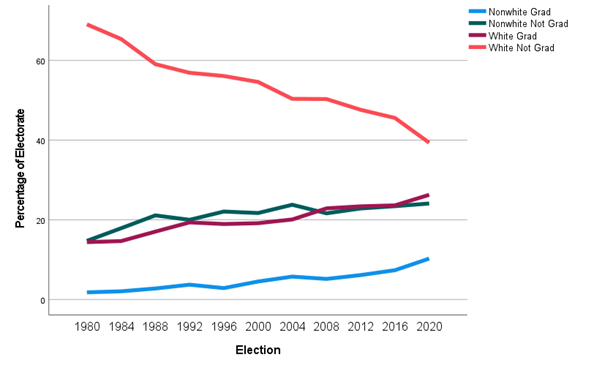
Source: American National Election Studies Cumulative File
The combined impact of growing racial diversity and rising levels of education is that the share of the electorate made up of whites without a college degree has fallen drastically, from 69% in 1980 to 39% in 2020. In 40 years, non-college whites have gone from an overwhelming majority to a minority of the American electorate. This decline in the non-college white share of the electorate has been very consistent, averaging about 3 percentage points every four years, and shows no signs of abating. At this rate of decline, the proportion of the electorate made up of non-college whites will fall to approximately 30% by 2032.
Race, education, and party identification
The dramatic changes in the composition of the American electorate over these 40 years, especially the substantial decline in the white share of the electorate, would appear to favor the Democratic Party because it has historically received the large majority of the nonwhite vote. However, despite the decline in the white share of the electorate, the data displayed in Figure 2 show that the proportion of Americans identifying with the Republican Party actually increased between 1980 and 2020. Although this trend has been uneven, the Democratic advantage in party identification has declined steadily since 2008, falling from 13.9 percentage points to only 4.1 percentage points over these 12 years. The 4.1 percentage point Democratic advantage in party identification in 2020 was the smallest recorded in ANES surveys in the past 40 years.
Figure 2: Party identification in the American electorate, 1980-2020
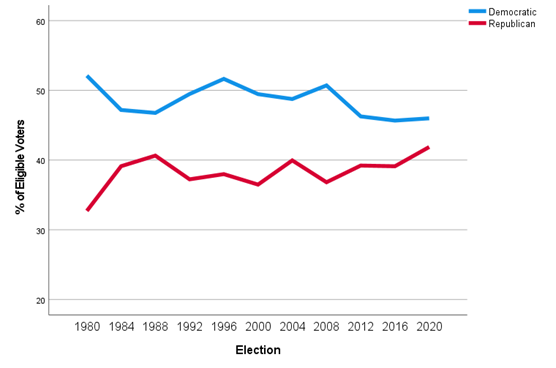
Note: Democratic and Republican identifiers, including leaning independents
Source: American National Election Studies Cumulative File
In order to understand how the Democratic Party’s advantage in party identification has been shrinking even as the nonwhite share of the electorate has been growing, we have to examine trends in the party identification within different racial groups. Figure 3 displays these trends among whites, Blacks, and other nonwhites — a category that includes Latinos, Asian Americans, Native Americans, and persons of mixed racial ancestry.
The most significant long-term trend apparent in these data is the decline in Democratic identification among white Americans. In 1980, Democrats enjoyed an 11-point advantage in party identification among whites. As recently as 2000, Democrats still enjoyed a 2-point advantage in party identification among whites. However, between 2008 and 2020, a 2-point Democratic deficit among whites turned into a 16-point deficit.
No such long-term shift in party identification is apparent in these data among either Blacks or other nonwhites, although there have been some short-term swings within these groups, especially among other nonwhites. The Democratic advantage among other nonwhites did fall from 39 points in 2008 to 25 points in 2020. However, that 39-point lead in 2008 was considerably larger than in any of the previous 4 elections. This variability in party identification among other nonwhites may reflect both short-term effects of the national political environment and random variation due to relatively small sample sizes.
Figure 3: Net party identification by race, 1980-2020

Note: Net party identification measured by difference between percentage of Democrats and percentage of Republicans, including leaning independents
Source: American National Election Studies Cumulative File
Along with race, the other key demographic characteristic that has undergone substantial change over these 40 years is education. According to the ANES data, the proportion of eligible voters with a college degree more than doubled between 1980 and 2020, going from 16% to 37%. The proportion of college graduates rose from 17% to 40% among whites and from 11% to 30% among nonwhites.
As the proportion of college graduates has grown since 1980, there has been a dramatic realignment in party identification along educational lines. According to the ANES data, during the 3 elections between 1980 and 1988, Democrats enjoyed an average advantage of 14 points in party identification among Americans without a college degree. At the same time, Republicans enjoyed an average advantage of 5 points in party identification among college graduates. By 2016-2020, the Democratic advantage among Americans without a college degree had fallen to only 1 point while the 5-point Republican advantage among college graduates had turned into a 14-point Democratic advantage.
Table 1: Net party identification by education and race, 1980-2020
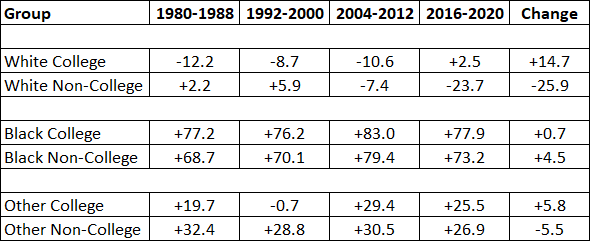
Note: Net party identification measured by difference between percentage of Democrats and percentage of Republicans, including leaning independents. In order to ensure adequate numbers of nonwhite respondents, the data are grouped into 4 electoral eras: 1980-1988, 1992-2000, 2004-2012, and 2016-2020.
Source: American National Election Studies Cumulative File
Since the election of Donald Trump in 2016, some pundits and political observers have argued that a class-based realignment of American politics has been occurring among nonwhites as well as among whites. According to analysts like Ruy Teixeira, declining support among nonwhites without college degrees is becoming a major problem for the Democratic Party. However, the data displayed in Table 1 indicate that the realignment of support along educational lines in recent elections has thus far been confined mainly to white Americans.
The data displayed in Table 1 show that over this 40-year period, there was a very dramatic realignment along educational lines among white Americans. Between the Reagan-H.W. Bush era and the Trump-Biden era, Democratic identification collapsed among non-college whites. At the same time, Democratic identification increased substantially among white college graduates. No such realignment is apparent in these data among either Blacks or other nonwhites, however. By 2016-2020, there was a yawning divide in party identification between non-college whites and college-educated whites. In contrast, there was very little difference in party identification between Blacks with and without college degrees or between other nonwhites with and without college degrees. The so-called class divide in American politics today appears to be almost entirely a white phenomenon.
Explaining white realignment: economic stress vs. racial resentment
There are two prominent explanations for the dramatic realignment of party identification among white Americans along educational lines since the 1980s. One explanation for this realignment emphasizes economic stress and insecurity caused by changes in the structure of the American economy that have disproportionately affected those without a college degree. The other explanation emphasizes racial and cultural resentment caused by changes in American society that disproportionately affect those without college degrees because they tend to hold more conservative attitudes on racial and cultural issues. I will test both of these explanations using data from ANES surveys between 1980 and 2020.
Figure 4. Net party identification by family income and education among whites in 2020
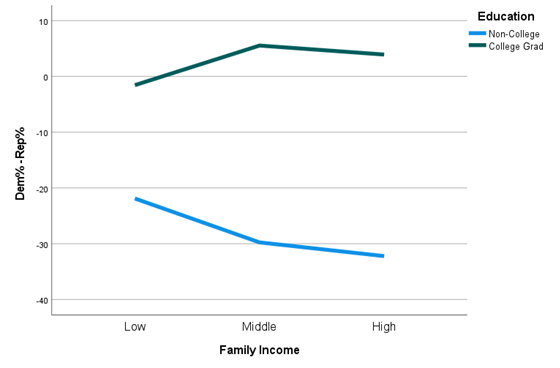
Note: Net party identification measured by difference between percentage of Democrats and percentage of Republicans, including leaning independents
Source: American National Election Studies Cumulative File
In order to examine the role of economic stress and insecurity in driving support for the Republican Party among non-college whites, I examined the relationship between family income and party identification among college and non-college whites in 2020. One would expect that to the extent that economic stress and insecurity are causing whites to move toward the GOP, there should be an inverse relationship between family income and Republican identification among both non-college and college-educated whites. In addition, the gap in party identification between non-college and college-educated whites should become much smaller or disappear once we control for family income.
The findings displayed in Figure 4 provide no support for the economic stress hypothesis. There was only a weak relationship between family income and partisanship among whites in 2020 and among non-college whites, those with lower incomes were actually somewhat less likely to identify as Republicans than those with higher incomes. Moreover, at every income level, whites without college degrees were much more likely to identify as Republicans than those with college degrees.
Figure 5: Net party identification by racial resentment and education among whites in 2020
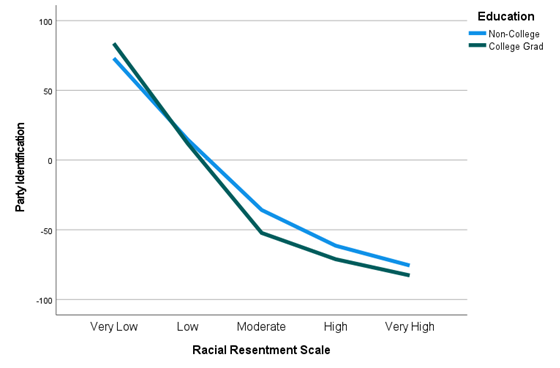
Note: Net party identification measured by difference between percentage of Democrats and percentage of Republicans, including leaning independents
Source: American National Election Studies Cumulative File
To test the racial and cultural resentment hypothesis, I examined the relationship between the standard 4-item racial resentment scale and party identification among whites with and without college degrees. The results are displayed in Figure 5. The findings here contrast dramatically with those in Figure 4. There is a very strong relationship between racial resentment and party identification among those with and without college degrees. Whites who scored low in racial resentment identified overwhelmingly with the Democratic Party while those who scored high in racial resentment identified overwhelmingly with the Republican Party. Moreover, once we control for racial resentment, the educational divide in partisanship disappears completely. In fact, at moderate to high levels of racial resentment, whites with college degrees were slightly more likely to identify as Republican than whites without college degrees.
Figure 6: Net party identification by racial resentment among non-college whites, 1980-2020
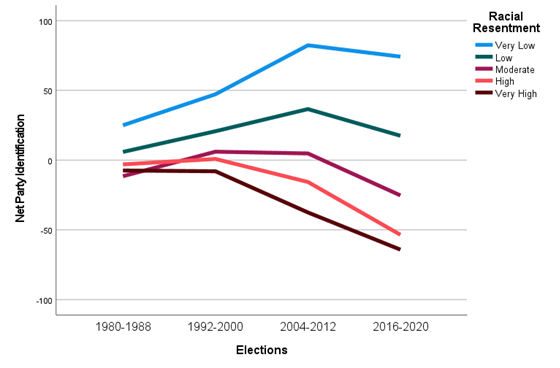
Note: Net party identification measured by difference between percentage of Democrats and percentage of Republicans, including leaning independents. In order to ensure adequate numbers of nonwhite respondents, the data are grouped into 4 electoral eras: 1980-1988, 1992-2000, 2004-2012, and 2016-2020.
Source: American National Election Studies Cumulative File
The findings in Figures 4 and 5 indicate that racial and cultural resentment rather than economic distress and insecurity has been driving non-college whites toward the Republican Party in recent years. As one additional test of this hypothesis, I analyzed the relationship between racial resentment and partisanship among non-college whites over time. The results of this analysis, displayed in Figure 6, strongly support the racial/cultural resentment hypothesis. Over these 40 years, the relationship between racial resentment and partisanship became much stronger among whites without college degrees. At the beginning of this time period, non-college whites who scored very high on the racial resentment scale were only slightly more likely to identify as Republicans than as Democrats. By the last 2 elections in this series, however, those who scored very high on the scale identified overwhelmingly as Republicans. Meanwhile, over the same 40-year time period, non-college whites who scored very low on the racial resentment scale actually shifted strongly in the direction of the Democratic Party.
Consequences of realignment for voting behavior
The evidence examined in this article indicates that the realignment of party identification along educational lines among Whites has actually been a realignment of party identification based on racial and cultural resentment. As a result of this realignment, white Democrats today, regardless of education, are much more likely to hold liberal attitudes on racial and cultural issues than in the past. This shift has been very dramatic since 2012. According to the ANES data, the proportion of white Democrats scoring either low or very low on the racial resentment scale increased from 36% in 2012 to 57% in 2016 to 76% in 2020. Among white Democrats without a college degree, the proportion scoring either low or very low on the racial resentment scale increased from 26% in 2012 to 44% in 2016 to 63% in 2020. Among white Democrats with college degrees, the proportion scoring either low or very low on the racial resentment scale increased from 56% in 2012 to 75% in 2016 to 86% in 2020.
Figure 7: Party loyalty in presidential elections, 1980-2020
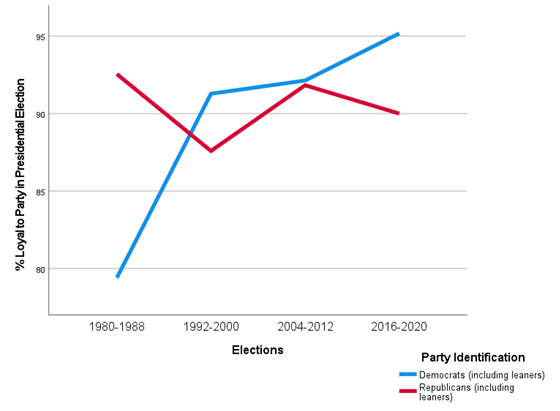
Note: Loyalty based on those voting for major party candidates
Source: American National Election Studies Cumulative File
This dramatic change in the racial attitudes of white Democrats has had important electoral consequences because racial attitudes are strongly related to party loyalty in voting. White Democrats with liberal racial attitudes are much more likely to support Democratic candidates than white Democrats with conservative racial attitudes. The decline in the proportion of white Democrats with conservative racial attitudes has contributed to a substantial increase in party loyalty among members of this group. In 2020, according to the ANES data, 96% of white Democrats reported voting for the Democratic nominee, Joe Biden. This was the highest level of loyalty among white Democrats in any presidential election in the entire ANES series, going back to 1952. As recently as 1988, only 80% of white Democrats reported voting for the Democratic nominee, Michael Dukakis.
The sharp increase in party loyalty among white Democrats has largely offset the impact of declining Democratic identification among whites since the 1980s. The Democratic base today is somewhat smaller than it was 40 years ago but it is much more loyal in its voting behavior, as shown in Figure 7. That is a major reason why Democratic candidates have won the popular vote in 7 of the last 8 presidential elections.
 Alan I. Abramowitz is the Alben W. Barkley Professor of Political Science at Emory University and a senior columnist with Sabato’s Crystal Ball. His latest book, The Great Alignment: Race, Party Transformation, and the Rise of Donald Trump, was released in 2018 by Yale University Press. Alan I. Abramowitz is the Alben W. Barkley Professor of Political Science at Emory University and a senior columnist with Sabato’s Crystal Ball. His latest book, The Great Alignment: Race, Party Transformation, and the Rise of Donald Trump, was released in 2018 by Yale University Press. |