| Dear Readers: Next Thursday (April 2) from noon to 1 p.m. eastern, the Crystal Ball will be hosting a briefing to assess the state of play in the 2020 election via Zoom. Editor in Chief Larry J. Sabato, Managing Editor Kyle Kondik, and Associate Editor J. Miles Coleman will discuss the rapidly-changing political environment and the latest outlook in the races for president, Senate, House, and governors.
The event is free, but we are asking participants to sign up via Eventbrite. — The Editors |
KEY POINTS FROM THIS ARTICLE
— With very few exceptions, statewide turnout in the 2020 Democratic primary has been higher than 2016.
— Suburban areas have seen some of the sharpest turnout increases — though these areas tend to have higher population growth, they’ve also trended blue in general elections, perhaps a positive indicator for Democrats looking to the fall.
— Meanwhile, some rural areas that have been trending away from Democrats in places like North Carolina and Oklahoma saw turnout lag behind 2016.
— While Bernie Sanders seems to have a stronger opponent in Joe Biden than he did with Hillary Clinton, Sanders’ prospects may have been hurt by partisan realignment since 2016.
2020 Democratic turnout
With the Democratic primary essentially in limbo while the coronavirus dominates the news and prompts states to postpone their primaries, we’ll be looking back at one of the most important factors of the 2020 primaries — turnout. Given the nature of the current public health crisis, it seems that the primary race could be pushed to the back of many voters’ minds. For the sake of historical comparison, the states holding their primaries over the next few months may well have asterisks next to them in terms of turnout.
Still, prior to the outbreak of the coronavirus, some clear turnout patterns were apparent in the primary season. Nationally, based on data from 19 states, voters were generally turning out at higher rates than in 2016 (Map 1). States that used different systems between the years (Minnesota and Utah, for example, which held caucuses in 2016 but primaries this year) were excluded. While our primary picture is still incomplete, 55% of the votes in the 2016 general election came from the 19 states in Map 1, giving us an adequate sampling of the electorate.
Map 1: Turnout change in the Democratic primary season
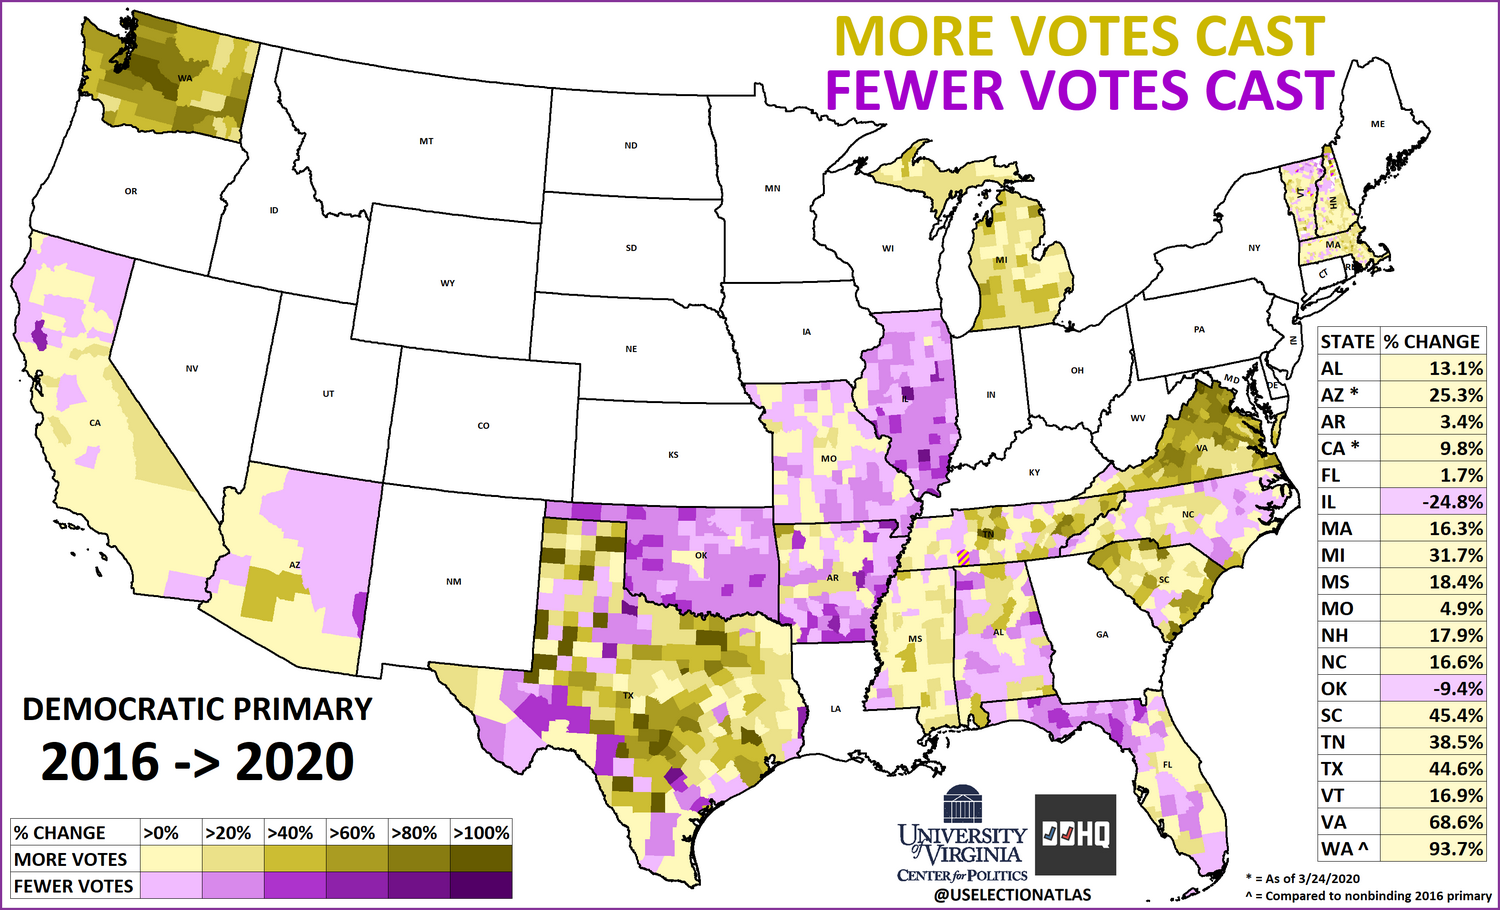
Overall, 17 of these 19 states saw higher turnout in 2020 than in 2016; the two exceptions were Illinois and Oklahoma, and we explore some possible explanations for why that was below.
Before we dive into some of the specific state-level trends that stood out to us, we want to note that primary turnout is not necessarily predictive of general election outcomes. Four years ago, Crystal Ball Senior Columnist Rhodes Cook looked at past primary turnout and didn’t really see historical patterns that one could consistently carry forward to the fall. Years like 2020 — where only one side has a contested primary — may have even less value as a November predictor, because the contested side naturally will generate more participation than the uncontested side. Still, as Republican pollster and analyst John Couvillon has chronicled, turnout on the GOP side has been unusually robust — this is something we may explore further in a future Crystal Ball article.
That said, there have been some interesting trends in the Democratic primary season — trends that seem to reflect broader changes in the composition of the Democratic Party’s electorate. It may be that some of these trends offer positive portents for Democrats in the fall although, again, we warn against using primary turnout as a definitive indicator about the general election.
Let’s start in the first primary state, New Hampshire.
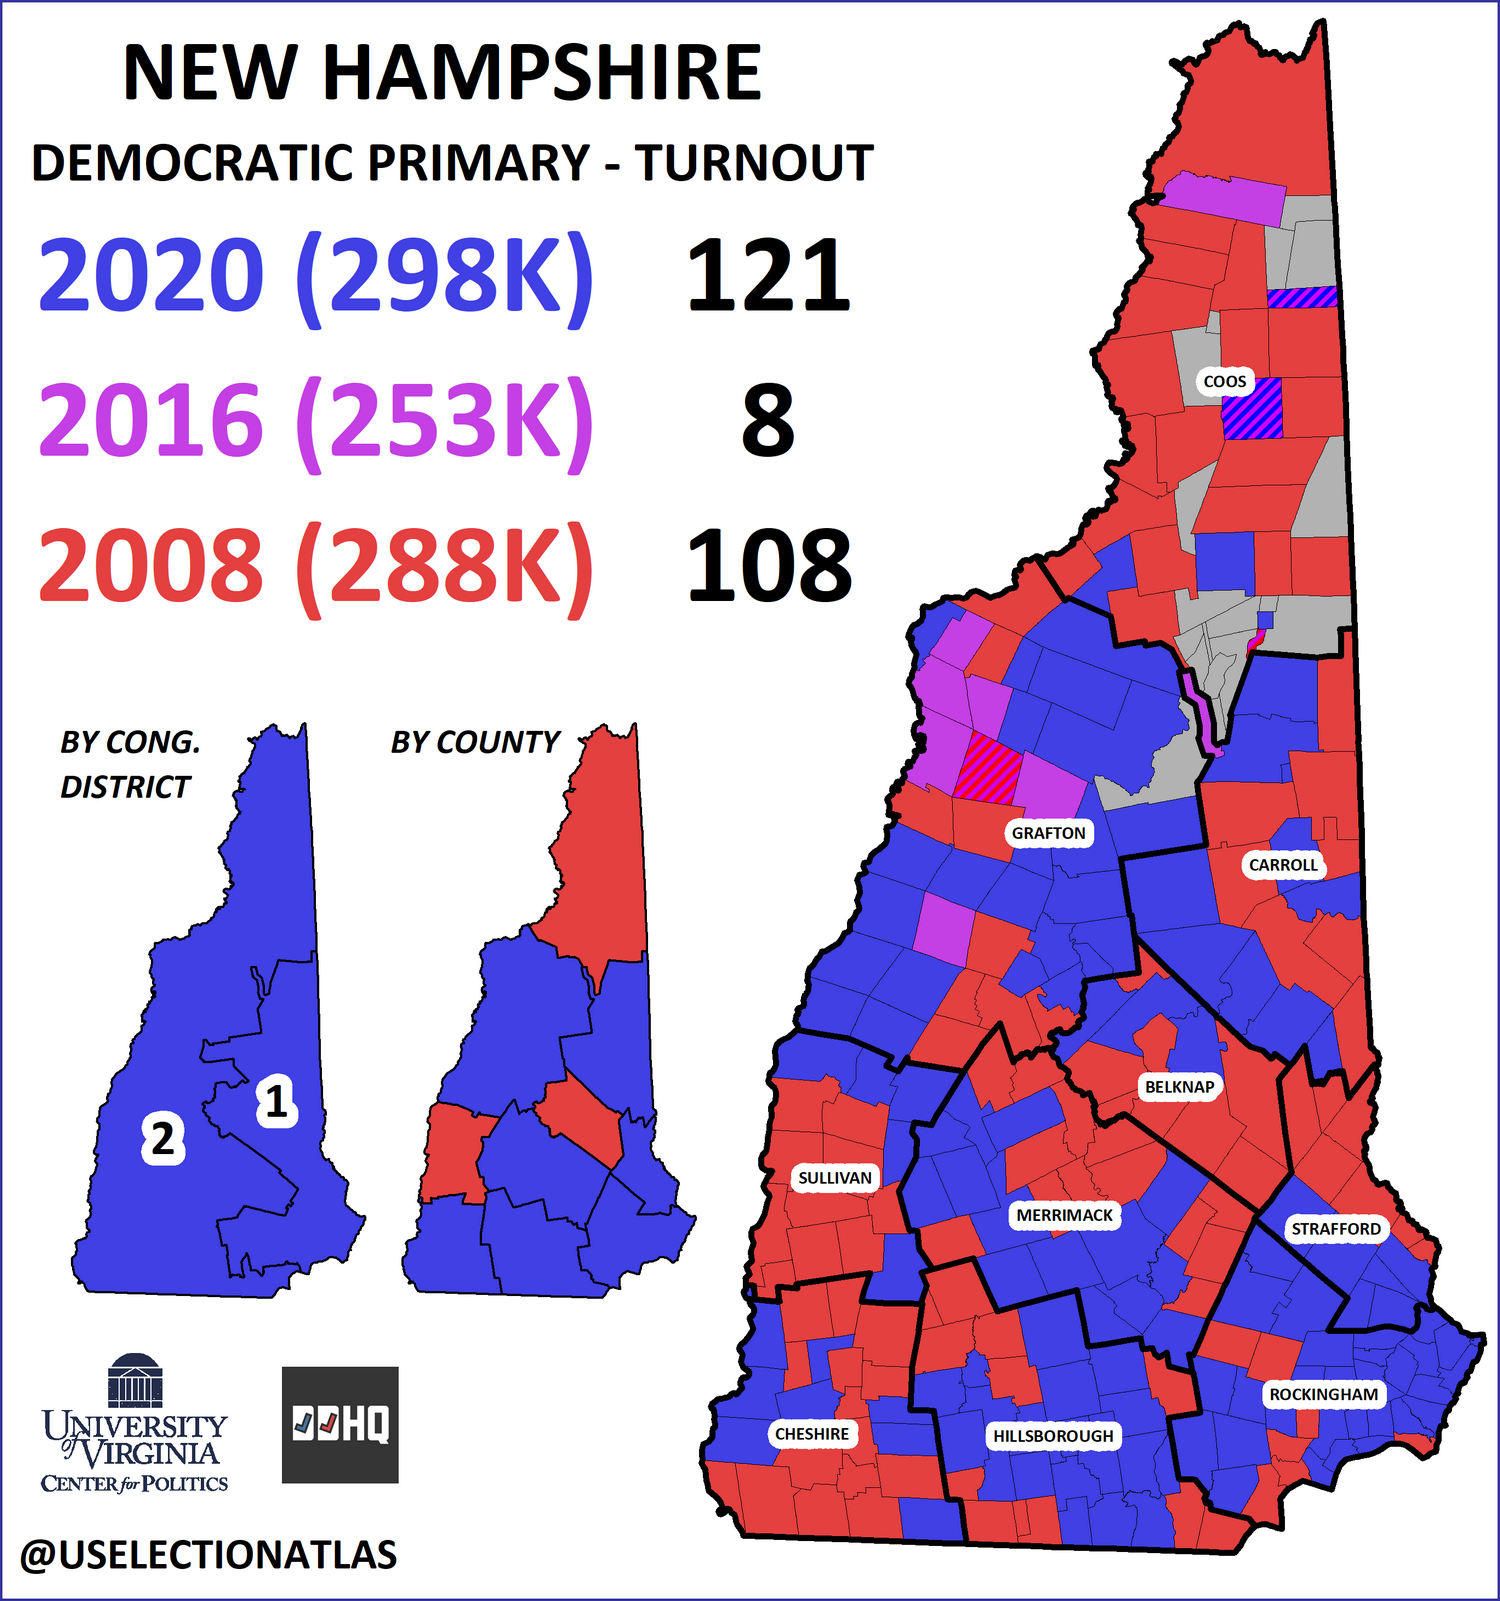
Despite criticism that the state’s heavily white electorate isn’t reflective of the national party, New Hampshire set a precedent in its leadoff primary that some other states followed: Turnout was significantly higher than 2016 but only slightly higher than 2008. Geographically, turnout was up in the southern part of the state — home to a disproportionate number of voters with college degrees — while rural, working-class regions tended to show less enthusiasm this year. In Map 2, the colors of each town correspond with the highest turnout year.
Map 2: Yearly comparison of New Hampshire turnout
One factor that may have boosted turnout was Virginia’s lack of party registration. On primary day, any voter can request to cast a ballot on either the Democratic or Republican side; as there was no GOP primary, the Democratic primary was the only option for voters that day.
It’s easy to see how soft Republicans in the wealthy suburbs of Washington D.C. or Richmond could have voted against Trump in the 2016 Republican primary and then, four years later, participated in the Democratic primary to back a candidate like Biden.
The 10th District, a fast-growing seat in Northern Virginia held by first-term Democrat Jennifer Wexton, seems to suggest this type of pattern. For the last several decades, VA-10 favored Republicans in the mold of the Bush family or former Sen. John Warner (R-VA), but its voters have been reluctant to embrace Donald Trump.
In the 2016 Republican primary, Trump carried the Old Dominion by three percentage points over then-candidate Sen. Marco Rubio (R-FL), but his weakness in the suburbs was notable. Rubio carried VA-10 by a 37%-29% margin. Additionally, VA-10 gave then-Gov. John Kasich (R-OH), who played to the center-right, more raw votes than any other district in the state.
In the Democratic primary this month, more than 150,000 votes were cast in VA-10, double the 77,000 total from the 2016 primary. That turnout spike was higher than the statewide change from 2016. Significantly, Biden was a beneficiary of that increase. While Sanders added about 5,000 more voters in his second time around, Biden added almost 31,000 votes to Clinton’s showing — though he took a lower percentage share, Biden’s 51%-24% margin over Sanders was also an improvement from Clinton’s 60%-40%.
Though the trends in some other demographically-similar places were not quite as extreme as VA-10, they did replicate its general trajectory in this primary season.
Virginia’s neighbor to the south, North Carolina, voted on Super Tuesday as well. The Tar Heel State, which uses a semi-closed primary — registered partisans vote in the primary that matches their party registration, but the state parties allow unaffiliated voters to choose a primary to participate in — saw a more modest uptick in turnout, about a 17% increase from 2016. Given their comparable demographics and geographic proximity, perhaps if Virginia had a less open primary system, its turnout spike would not have been as pronounced, either. The geographical distribution of the turnout increase, though, was not consistent statewide.
In central North Carolina, a string of a dozen counties, stretching from Mecklenburg (Charlotte) to Wake (Raleigh), saw turnout increases of over 20%. Orange County, which was possibly the biggest surprise of the night, is located here: a liberal bastion housing UNC-Chapel Hill, this was the only county in the region to support Sanders in 2016 — this time, Biden carried it by less than a point, though Elizabeth Warren, then still an active candidate, placed a strong third.
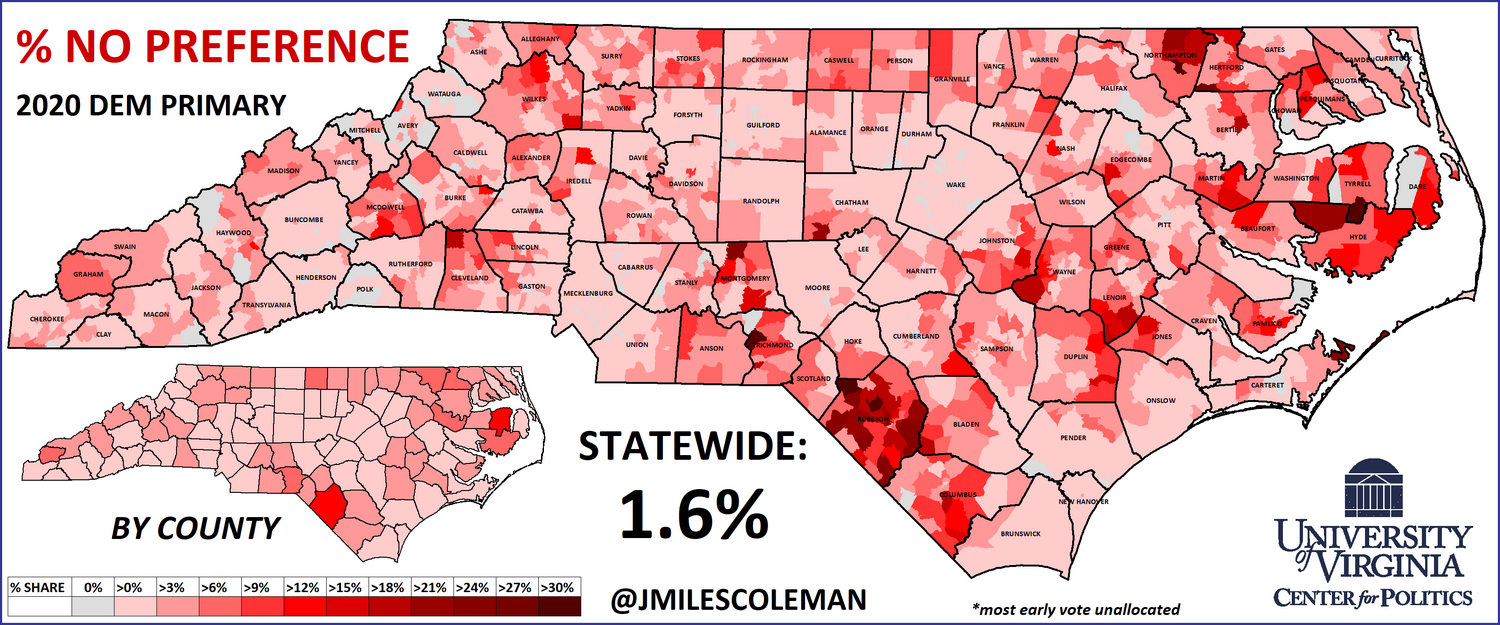
Two metro areas that bookend the state, Asheville in the mountains and Wilmington on the coast, saw generally robust turnout increases, but many rural counties in between cast fewer votes. Indeed, just a few miles west of Wilmington is Columbus County, a rural county that cast 28% fewer votes than it did in the 2016 primary. The main culprit may be declining Democratic Party registration. White-majority and poor, Columbus was a reliably blue county, by state standards, until the advent of Trump. In March 2016, 61% of the electorate were registered Democrats; four years later, the party can claim just 49% of the voters there. Perhaps just as telling, those that are still registered with the party were more likely to cast protest votes. Nearly 6% of the electorate in Columbus County voted “No Preference,” a number not uncommon for rural North Carolina (Map 3). In Florida, the panhandle is known for a similar phenomenon — in last week’s primary, it stayed true to form. This may be an indicator of registered Democrats who won’t support the Democratic nominee in the fall.
Map 3: No Preference vote in North Carolina
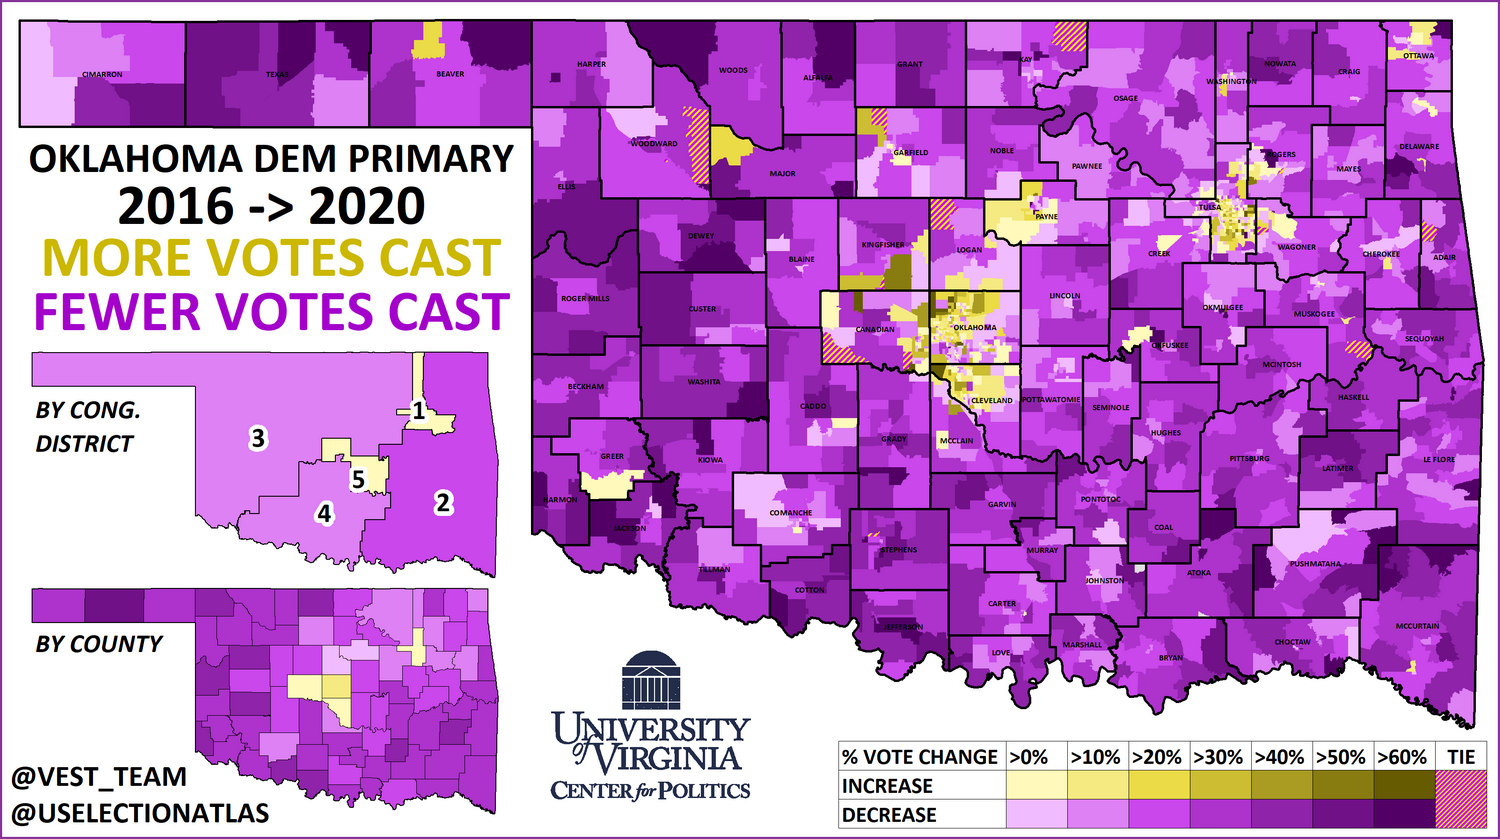
Oklahoma was one of just two states included in this analysis where turnout was down from 2016. In 2016, Bernie Sanders’ victory in the Sooner State was, at the time, taken as early evidence that he could win in primaries outside of New England. In Oklahoma, Independent voters can vote in Democratic primaries, but registered Democrats cannot participate in GOP primaries; since 2016, the Democratic share of the electorate, by registration, has dropped from 42% to 35%. Much of that drop was driven by conservative, ancestrally Democratic rural counties. As the *only* candidate other than Hillary Clinton — a known figure who many registered Democrats in the state had no intention of supporting in the general election — Sanders was essentially the only option for rural conservatives who were locked out of the GOP primary. By 2020, these voters, instead of making up Sanders’ base, were shaking off their Democratic pedigrees, perhaps by registering as Republicans or sitting out the Democratic primary entirely. Oklahoma turnout was down slightly, from 336,000 to 304,000, but rural areas saw the steepest drops — and Sanders’ performance suffered commensurately. (Map 4) Note: The previous paragraph has been clarified from a previous version to more accurately describe Oklahoma’s primary system.
Map 4: Turnout change in Oklahoma Democratic primary, 2016-2020
Looking back at Super Tuesday, perhaps one of the most disappointing results for Sanders was his home state. In 2016, he carried Vermont by a huge 86%-14%, enough to carry all the state’s pledged delegates. A beloved figure in the state, Sanders was reelected to the Senate in 2018 by a 67%-27% margin, a wider margin than either of Barack Obama’s 2008 or 2012 showings in the state. But by Super Tuesday, even as turnout was up by 23,000 votes statewide from 2016, Sanders’ share plummeted from 86% to a bare 51% majority — it seemed that even the voters who knew him best were not especially enthusiastic with his candidacy this time (although, to be fair, he also was competing amidst a much larger field of candidates this time).
The week after Super Tuesday, on March 10, Biden’s strength endured, as a handful of states weighed in. That night, the main event seemed to be Michigan. Sanders’ 2016 upset in the Wolverine State gave his candidacy a critical jolt of energy during that cycle — if Sanders were to halt Biden’s upward trajectory, it was critical that the Vermont senator replicate his 2016 showing there. Instead, the result was a wide 53%-36% victory for Biden, who carried all 83 of the state’s counties (Clinton carried only 10 in 2016). Perhaps not coincidentally, turnout was also up in every county, though this was helped by measures that the state had enacted since 2016, such as same-day registration, that eased access to the ballot box. Michigan, like Vermont, was a state with high symbolic significance to the Sanders campaign — in both cases, he underperformed with higher turnout.
Michigan, which uses an open primary, mirrored Virginia in that Biden seemed to benefit from higher engagement in the suburbs. Michigan’s 8th District, held by first-term Rep. Elissa Slotkin (D, MI-8), which includes three counties between the Detroit and Lansing metro areas, was a striking example of this. Statewide, turnout in Michigan was up 32% from 2016; MI-8 cast 51% more votes in this year’s primary, increasing from 84,000 to 127,000. This came as Sanders performed 25 percentage points worse in the district: his 56%-42% win from 2016 turned into a 49%-38% deficit.
As in general elections, educational attainment is an increasingly relevant electoral indicator in primaries — though Sanders ran well with younger voters on college campuses, broadly speaking, voters with college degrees tended to favor center-left candidates. In MI-8, 41% of the population has at least a college degree, compared to the 28% for the state overall, making the acute swing to Biden less surprising.
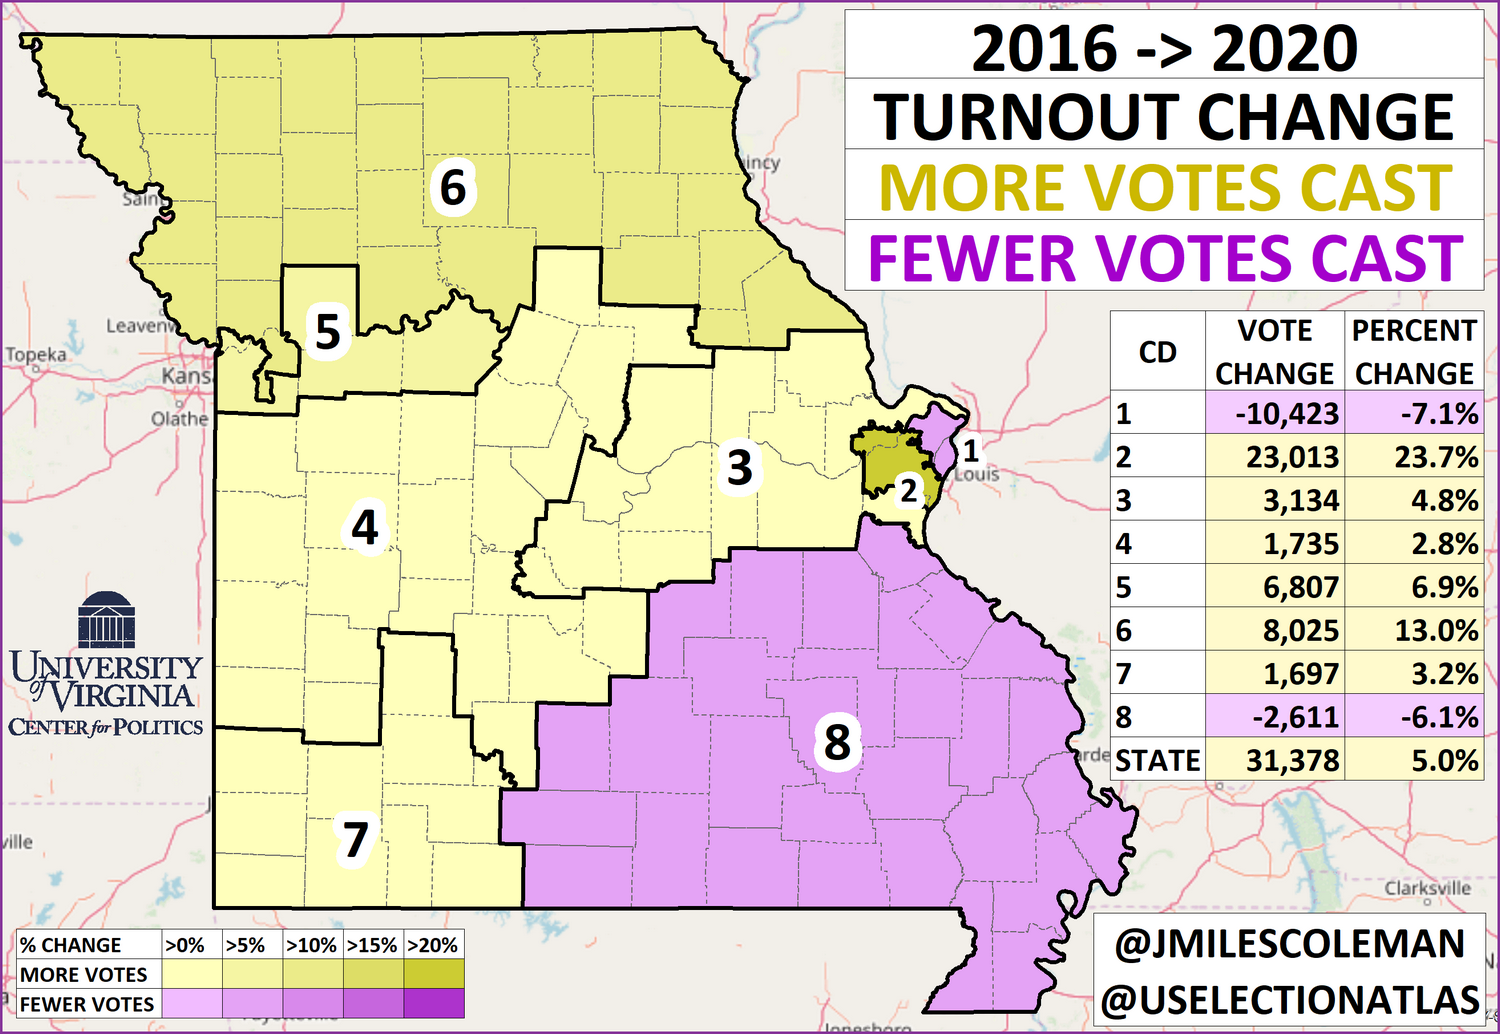
Though Missouri received less attention than Michigan on March 10, its results largely followed suit. After Clinton carried the state over Sanders by just over 1,500 votes in 2016, the result there this month was a 60%-34% blowout for Biden. As with other states, the turnout patterns in Missouri had mixed implications for the general election. (Map 5)
Map 5: Missouri turnout change by congressional district
Conclusion
Last week’s primaries were the first since the coronavirus outbreak became a true national emergency, and it yielded divergent turnout dynamics. In Arizona and Florida — states with heavy early voting and voting by mail — turnout was up from 2016 levels. Meanwhile, Illinois, a state where voter turnout overall is more dependent on Election Day, cast 25% fewer votes than its 2016 primary. Ohio, which was scheduled to vote that day, pushed its election back, and several other states have followed suit since. Looking to the general election, regardless of how long the coronavirus persists as a national pandemic, it’s a safe bet that more voters will be exploring mail-in voting as an option.
At this inflection point on the election calendar, there are no shortage of uncertainties: Will more elections get pushed back? Are states prepared to massively expand their mail-in voting operations?
One clear pattern, though, is that the geographic trends in the Democratic primary are lining up with the contours of recent general elections. Greater turnout in suburbs has buoyed Joe Biden’s prospects and given us an idea of what the Democratic coalition may look like in November — the bigger question will be if that coalition is good for 270 electoral votes, particularly if Democrats continue to lose ground in areas outside major metro areas. That Biden did significantly better than Hillary Clinton in outstate areas in many states may also be an encouraging sign for the fall, but — again — primaries are not general elections, and the overall movement away from Democrats in these kinds of places showed up in the turnout patterns in some states as well.