| Dear Readers: In the latest edition of our Politics is Everything podcast, we discuss the third indictment of former President Trump as well as today’s Crystal Ball article. Listen and subscribe here or wherever you get your podcasts.
— The Editors |
KEY POINTS FROM THIS ARTICLE
— Just about 150 of the nation’s more than 3,100 counties cast half of the nation’s presidential vote in 2020.
— As we typically see at the state level, the more vote-rich counties are more Democratic, while the thousands of smaller counties that make up the bottom half are more Republican.
— This political gulf has widened. Despite similar overall national presidential margins in 2012 and 2020, the difference between the top and bottom halves expanded about 10 points from 2012 to 2020.
— Joe Biden won 126 of the 151 top half counties, while Donald Trump won 2,548 of the remaining 2,960 counties in the bottom half.
— Trump’s wins among the top half counties were concentrated among the smaller pieces of that group — Biden won all but one of the nearly 50 counties that cast 500,000 votes or more.
Top half vs. bottom half at the national level
Earlier this year, we analyzed several key states by dividing them in half, with a state’s most vote-rich counties adding up to half the statewide vote making up the “top half” of a state, and the rest of the state’s counties making up the “bottom half.” The general though not universal trend is that the top halves are getting bluer and the bottom halves are getting redder or, at the very least, the gap between the two halves is widening.
Both of those observations apply when splitting the nation as a whole into two halves. The nation’s most vote-rich counties, collectively, got bluer from 2012 to 2020 — the two elections we have been comparing as part of this series — while the remaining bottom half counties got collectively redder. That means that the gap between the two halves is increasing.
We calculated the nation’s top half by starting with the nation’s largest county-level source of votes — Los Angeles County in California — and moving down until we got to a total number of votes closest to half of the total votes cast in the 2020 presidential election. We used Dave Leip’s Atlas of U.S. Presidential Elections for all of our numbers.
The cutoff point for inclusion in the top half counties ended up being slightly over 230,000 votes cast. The least vote-rich top half county was Hillsborough (231,659 cast in 2020), in New Hampshire, which is home to Manchester and Nashua. The most vote-rich bottom half county was Colorado’s Douglas County (231,605 cast), a booming exurban county located between Denver and Colorado Springs.
Overall, the top half is made up of 151 counties across 39 states. The full list of top half counties included is at the end of the story. We included 49 of the 50 states in the calculation; Alaska is generally excluded from such analyses because it doesn’t report votes via its boroughs (the state’s county equivalents). The District of Columbia, which doesn’t have counties, is also excluded from the tally of counties and county equivalents, which is 3,111 across the 49 states (Louisiana’s parishes are included as counties in this analysis, as are Virginia’s independent cities and a few other independent cities across the country). Still, the vote totals from both Alaska and the District of Columbia are included as part of the bottom half.
Table 1 shows how the top and bottom halves voted in both 2012 and 2020 and how they changed.
Table 1: Top half of U.S. vs. bottom half, 2012 and 2020
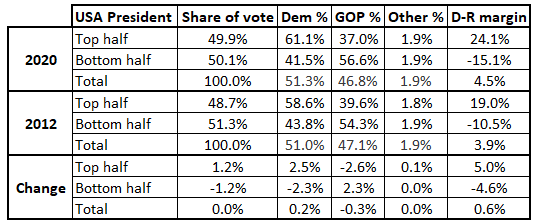
In 2012, Barack Obama won by about 3.9 points nationally, while Joe Biden won by about 4.5 points in 2020. Both Biden and Obama did markedly better in the top half than the bottom half, but the gap expanded under Biden: Obama’s top half margin was 29.5 points better than his bottom half margin, while Biden’s was 39.2 points better.
Biden ran about 5 points ahead of Obama’s top half margin but close to 5 points behind his bottom half margin. It worked out to Biden winning the national popular vote by slightly more — in part because 2020’s top half made up slightly more of the overall national vote in 2020 than the same group of counties did in 2012 — but Biden’s Electoral College coalition was less efficient than Obama’s (Obama’s “tipping point” state voted to the left of the nation, while Biden’s voted to the right).
Overall, Joe Biden won 126 of the 151 top half counties, although that still means that Donald Trump won 25 of them, which might be somewhat surprising in a national electorate where population density seems so highly correlated with partisanship. Biden’s haul was up from Obama, who won 112, but Obama won more counties overall, 692 to 538 for Biden (those numbers come from Crystal Ball Senior Columnist Louis Jacobson, who wrote about county-level voting patterns for us in 2021).
The Trump wins among this top half group were generally concentrated among the counties that cast fewer votes: Of the 46 counties that cast 500,000 votes or more, Trump only won one: Suffolk County, which covers the eastern part of New York’s Long Island. Trump’s victory there was tiny — just .03%, or 232 votes out of 773,287 cast (this was the closest margin of any of the top half counties). Other closely-divided counties that cast more than 500,000 votes were Tarrant in Texas (Fort Worth) and Pinellas (St. Petersburg/Clearwater) in Florida, each of which was decided by .22 points in favor of Biden.
Trump did carry a couple of counties that came close to casting 500,000 votes: Macomb County in Michigan, the suburban Detroit Obama-to-Trump county long associated with the so-called “Reagan Democrats,” and Collin County in the northern Dallas-Fort Worth exurbs, although Trump’s 4-point margin there was way weaker than Mitt Romney’s 2012 margin of about 31 points.
The most Republican-leaning top half county is also in Texas: Montgomery, an exurban county directly north of Houston’s Harris County. Trump won it 71%-27%, although that was down from Romney’s 80%-19% victory in 2012. Still, the fact that this big county outlier is in Texas is part of the reason why the state remains GOP-leaning as opposed to becoming a full-blown battleground: Democrats still have work to do in the key suburban/exurban counties around Austin, Dallas/Fort Worth, and Houston. Trailing somewhat closely behind Montgomery for the title of most Republican big county is Utah County, the home of Provo and Brigham Young University that Trump won 67%-26%.
The two most Democratic top half counties by percentage margin are both in Maryland: Prince George’s County (89%-9% Biden) in the DC suburbs and Baltimore City (87%-11% Biden), which at about 237,000 votes cast is one of the smallest entities in the top half (Prince George’s cast about 425,000 votes). Of the larger counties that cast more than 500,000 votes, the most Democratic is Manhattan (New York County), at 86%-12% Biden (big shock, we know).
We realize that the mostly ancient (in the context of the relatively short history of the United States) decisions on how county lines are drawn impacts this analysis. For instance, Los Angeles County is both geographically huge as well as highly populated. It casts by far the most votes of any county in the nation — 4.26 million, or nearly 2 million more votes than the second most vote-rich county, Cook County (Chicago). New York City has a single mayor but is technically five different counties — were it combined into one, it would have cast about 3 million votes in 2020, placing it second overall between LA and Cook. As it is, four of the five counties that make up New York City — Kings (Brooklyn), Queens, New York, and the Bronx — are included in the top half (Staten Island’s Richmond County, at about 217,000 votes cast, is a bit below the roughly 230,000 vote cutoff line and is thus included in the bottom half).
Some states are overrepresented because they have very few counties, and others are underrepresented because they have very many. Take New Jersey and Virginia, for instance. The former has 14 electoral votes and the latter has 13, so they are very similar in terms of population. But New Jersey is geographically much smaller and has just 21 counties, while Virginia has 133 counties and county equivalents (combining the commonwealth’s 95 counties and 38 independent cities). So New Jersey has 10 counties on the top half list, which together account for a little more than 70% of the total vote the state casts, while Virginia has just one, Fairfax, which accounts for 13% of its statewide vote. Alas, we don’t compute election results with the counties we wish we had, but rather with the counties we actually have.
On a similar note, voter turnout and eligibility have an impact on the states and counties that are represented in the top half. For example, Hidalgo County in South Texas, with a population nearing 900,000, has habitually low turnout, and it is in the bottom half with only about 221,000 votes cast in 2020. In contrast, Dakota County in Minnesota’s Twin Cities area only has about 440,000 people, but it is in the top half with more than 260,000 votes cast in 2020.
We’ll have more to say about the top half counties and their states, as well as about how these counties performed in other elections, in part two of this analysis.
The list of top half counties
Counties are listed by state, and in order of size within states based on number of votes cast:
Alabama: Jefferson
Arizona: Maricopa, Pima
California: Los Angeles, San Diego, Orange, Riverside, Santa Clara, San Bernardino, Alameda, Sacramento, Contra Costa, San Francisco, Ventura, San Mateo, Fresno, Kern, San Joaquin, Sonoma, Placer
Colorado: Denver, El Paso, Jefferson, Arapahoe, Adams
Connecticut: Fairfield, Hartford, New Haven
Delaware: New Castle
Florida: Miami-Dade, Broward, Palm Beach, Hillsborough, Orange, Pinellas, Duval, Lee, Brevard, Polk, Volusia, Pasco, Sarasota, Seminole
Georgia: Fulton, Gwinnett, Cobb, DeKalb
Hawaii: Honolulu
Idaho: Ada
Illinois: Cook, DuPage, Will, Lake, Kane
Indiana: Marion
Iowa: Polk
Kansas: Johnson
Kentucky: Jefferson
Maryland: Montgomery, Prince George’s, Baltimore County, Anne Arundel, Baltimore City
Massachusetts: Middlesex, Worcester, Essex, Norfolk, Suffolk, Plymouth, Bristol
Michigan: Wayne, Oakland, Macomb, Kent
Minnesota: Hennepin, Ramsey, Dakota
Missouri: St. Louis County (St. Louis City is a different and smaller entity), Jackson
Nebraska: Douglas
Nevada: Clark, Washoe
New Hampshire: Hillsborough
New Jersey: Bergen, Monmouth, Middlesex, Essex, Ocean, Morris, Camden, Burlington, Union, Hudson
New Mexico: Bernalillo
New York: Kings, Queens, Suffolk, Nassau, New York, Erie, Westchester, Bronx, Monroe, Onondaga
North Carolina: Wake, Mecklenburg, Guilford
Ohio: Franklin, Cuyahoga, Hamilton, Summit, Montgomery
Oklahoma: Oklahoma, Tulsa
Oregon: Multnomah, Washington, Clackamas
Pennsylvania: Philadelphia, Allegheny, Montgomery, Bucks, Delaware, Chester, Lancaster, York
Rhode Island: Providence
South Carolina: Greenville
Tennessee: Shelby, Davidson
Texas: Harris, Dallas, Tarrant, Bexar, Travis, Collin, Denton, Fort Bend, Williamson, Montgomery, El Paso
Utah: Salt Lake, Utah
Virginia: Fairfax
Washington: King, Pierce, Snohomish, Spokane, Clark
Wisconsin: Milwaukee, Dane, Waukesha
NO COUNTIES IN TOP HALF: Alaska, Arkansas, District of Columbia, Louisiana, Maine, Mississippi, Montana, North Dakota, South Dakota, Vermont, West Virginia, Wyoming