KEY POINTS FROM THIS ARTICLE
— For the entire period from 1972 to 2020 there is little partisan bias in the seat/vote relationship, but this overall pattern obscures substantial bias from decade to decade.
— In the 1970s and 1980s there was a substantial bias favoring the Democrats; in the 1990s the relationship was a very small bias favoring the Democrats; in the 2000s and 2010s there was a noticeable bias favoring the Republicans.
— The 2020 election had a proportional outcome, as the Democratic candidates received 51% of the votes and 51% of the seats. This reduction in the Republican bias in 2020 may be the result in part of mid-decade redistricting in several states favoring the Democrats.
Votes received vs. seats won in the House
Redistricting for the U.S. House of Representatives is not a unified process as is the case for most national legislatures, but the result of the cumulative actions in the states that have more than one representative. Nevertheless, it is useful to look at the entire House to see how the decisions in the states combine to form a fair or biased playing field for the parties.
One commonly used method for analyzing the partisan nature of the redistricting process is the seats/votes relationship, which I discuss in more detail elsewhere. For this analysis simple least squares regression is used to relate the percentage of the two-party votes that the Democrats received to the percentage of the seats they won. The Pearson’s R2 tells us how strongly the allocation of seats is related to the votes received by each party. The slope of the regression line is called the swing ratio, and tells us how responsive the system is to changes in the vote. One can determine partisan bias by simply solving the regression equation for the situation in which the Democrats received 50% of the votes. At that level they should also receive about 50% of the seats if the playing field is level.
Determining the percentage of the two-party votes received by Democratic candidates for the House requires attention to two questions. The first question is how to count elections in states that have majority vote requirements with run-off elections after November (e.g., Louisiana), and elections in which all the candidates in the November general election are in the same party as a result of a jungle-primary system (e.g., California). If the candidates in the final election are both in the same party, I counted the contest as unopposed for that party. If there was a runoff after November, I combined the vote of each party’s candidates in the November election.
A second question is what to do with these unopposed contests. I define an opposed contest as one in which there was both a Republican and a Democratic candidate in the November election on the ballot. If the vote in unopposed contests is included, the total for the party that had the most unopposed candidates is inflated, because their opponents would have received at least some votes. If the vote of the unopposed candidates is excluded, the vote of the party with the most unopposed candidates is understated because unopposed candidates would undoubtedly receive a substantial majority of the votes if they were opposed.
One way to deal with this problem is to substitute the vote of some other set of candidates in districts where the Congressional candidate is unopposed. But on a nation-wide basis the only office available for that job is the presidency, and that is only available in half the congressional elections. There was variation in presidential and congressional voting as shown by Barry C. Burden and David C. Kimball, although this is increasingly less true. Votes for U.S. Senate or Governor could be substituted into unopposed races, but this also has problems. Voters typically know more about candidates for these offices, only about 33 or 34 of the states have a Senate election in any year, and most governors now have four-year terms.
My solution is to estimate the vote that each party would receive in unopposed contests and add this to the vote in the opposed races. The formulas for the adjustment of the vote for each party is:
d = x + amv + bm(1 – v)
r = y + bmv + am(1 – v)
Where:
d = estimate of Democratic vote
r = estimate of Republican vote
x = vote for all opposed Democratic candidates
y = vote for all opposed Republican candidates
a = number of unopposed Democratic candidates
b = number of unopposed Republican candidates
m = mean number of votes cast for both Republican and Democratic candidates in opposed contests
v = proportion of the vote that unopposed candidates would have received if they had been in an opposed contest
The two-party voter turnout in unopposed districts is assumed to be equal to the mean turnout in opposed contests — a reasonable assumption as Robert Huckfeldt et al. report. This is designated as “m” in the formula.
Gary C. Jacobson estimates the percentage of the vote that we would expect unopposed candidates would have received, on average, if they had been opposed (v in the formula) at 71% with a standard deviation of 10%. His analysis is based on the support that congressional candidates received in the election following or preceding the one in which he or she was not opposed.
With this calculation I derived the percentage of the two-party vote that the Democrats would have received if all contests were opposed in recent elections. These figures deviate little from total vote without this adjustment. For example, in 2020 the unadjusted total including the votes for unopposed candidates was 51.55% Democratic, the total only for opposed candidates was 50.64% Democratic, while the adjusted vote was 51.09% Democratic. Over the years I have collected the data from a variety of reliable sources, most commonly the Clerk of the U.S. House. The data for 2016 to 2020 come from the Cook Political Report.
This remarkably close congressional election can be compared to the unremarkably decisive victory by the Democratic candidate for president. Former Vice President Joe Biden received 52.2% of the national popular two-party vote, or over seven million more votes than President Donald Trump. The drop-off of voters from the presidential to the congressional vote is about average. There were 155,507,229 votes cast for president, but only 152,898,796 votes for congressional candidates (adjusted totals).
The logical place to start the analysis is with the 1972 election, which is the beginning of the first redistricting cycle after the U.S. Supreme Court required congressional districts to be one-person-one-vote. In the period from 1972 to 2020, only in 1996 and 2012 did the party that received the most adjusted votes fail to receive the most seats in the House. In 1996 the Democrats received 50.02% of the two-party vote (adjusted), but failed to retake the House from the GOP. In 2012 the Democrats received 50.6% of the two-party vote, but again failed to retake the House.
Given the power of incumbency, the “out” party may need to get well over 50% of the two-party vote to take over the house even if there is no gerrymandering. The Republicans received 54.5% of the two-party vote in 1994 to take over the House, and the Democrats took it back in 2006 with 53.9%. The Republicans took it back again in 2010 with 52.9%, but lost it again in 2018 when the Democrats received 53.4% of the vote.
Table 1 shows the number of unopposed contests for both parties in each election since 1972. In general, the party with the most momentum going into the election period had the largest number of unopposed contests, as one would expect. The number of unopposed Democrats went down as the Republicans first became competitive in the South and then became dominant there. The number of unopposed Republicans had been going up over time mainly as a result of those same changes in the South, but has tapered off in this last decade. Indeed, the number of unopposed Republicans was historically low in 2018 and 2020.
Table 1: Uncontested House races, 1972-2020
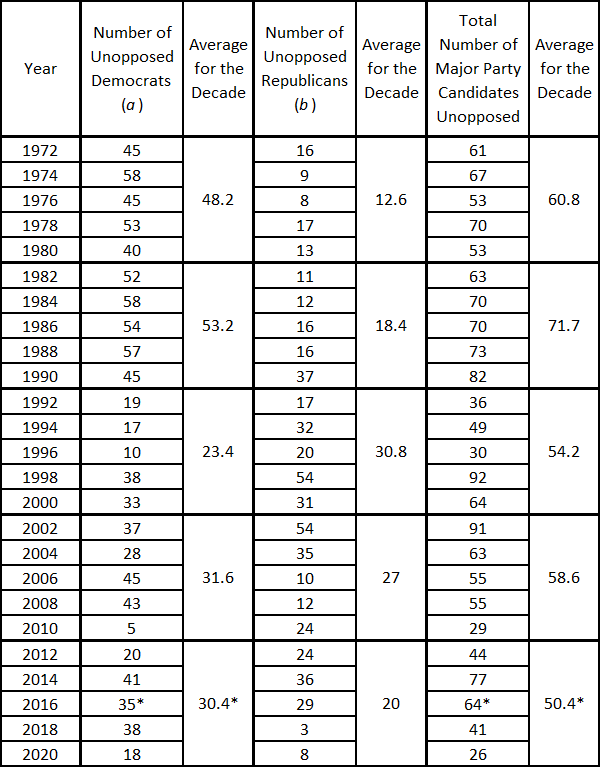
Note: *Includes seats in California in which the November final election featured two candidates of the same party.
The pattern of unopposed elections in 2020 dramatically shows the geographic weaknesses of the two parties. Of the 18 unopposed Democrats, seven were in California and four in Massachusetts. No other state had more than one unopposed Democrat. Seven of the eight unopposed Republicans were in the formerly Confederate states, the other one was South Dakota at-large.
Table 2 shows the correlation, slope, and bias figures for the entire period and for each redistricting cycle. Figure 1 shows a scatterplot of this relationship during the entire period from 1972 to 2020, while Figure 2 shows the relationship during the 2012 to 2020 period. The Pearson correlations indicate that the allocation of seats is consistently related to the votes cast. For this entire period the swing ratio has been appropriately at or above 1.0, indicating adequate response to changes in the vote. Over the entire period, the system has had little partisan bias — a Republican advantage of only 0.3%, which is perhaps an additional one seat if the vote were evenly split. However, in the 1970s and 1980s the Democrats had a sizeable advantage, while in more recent elections this advantage has shifted from a very slight Democratic bias in the 90s, then a Republican advantage starting in 2002. Thus the overall fairness statistics disguise substantial variation over several different redistricting cycles.
Table 2: Correlation, slope, and bias of House races
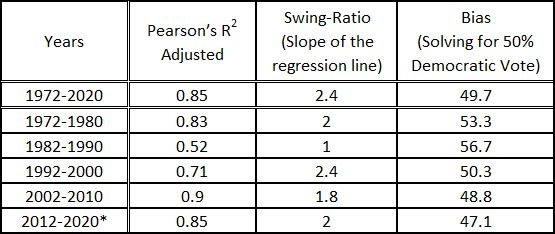
Note: *There was substantial and consequential mid-decade redistricting in Pennsylvania, Florida, Virginia, and North Carolina during this decade.
Figure 1: Scatterplot of Democratic percentage of the two-party adjusted vote to Democratic percentage of the seats in the House won 1972-2020

Figure 2: Scatterplot of Democratic percentage of the two-party adjusted vote to Democratic percentage of the seats in the House won 2012-2020

Now that we have a complete set of elections for the last decade (2012-2020), the continued recent Republican advantage is clear. If the vote were evenly split, the Democrats would be getting only 47.1% of the seats on average (205 seats out of 435). This pretty well describes what has been happening during this decade. In 2012, the Democrats received 50.6% of the votes (adjusted), but only 46.2% of the seats. In 2014 the Democratic percentage of the adjusted votes declined to 47.6%, and they won only 43.2% of the seats. In 2016 the Democrats did slightly better with 49.2% of the votes, but still won only 44.6% of the seats. In 2018, however, the Democratic candidates received 53.5% of the votes and won 235 seats (54%). Some mid-decade redistricting (Virginia, Pennsylvania, Florida, and North Carolina) may have affected the overall pattern for the current cycle, and certainly affected the relationship in 2020. In this regard, it is interesting that the seat/vote relationship in 2020 could not be closer to proportional with the Democrats getting 51% of the seats and 51% of the votes.
The more recent Republican advantage may be due, in part, to the requirements of the Voting Rights Act (VRA) to create majority-minority districts, thus artificially packing the most reliable Democratic voters in a few districts. The high point of this requirement, however, was in the 90s, when there was almost no partisan bias. Thus the VRA is not inconsistent with unbiased redistricting or even a pattern that has a small Democratic bias. To some extent, the bias may derive from the way in which Democratic and Republican voters are concentrated geographically, and not with the implementation of the Voting Rights Act per se as pointed out by Gary C. Jacobson and Sam Hirsch. It is clear, however, that one cause of the bias in this most recent cycle must be gerrymandering in several large states by Republican state legislatures and governors in the redistricting cycle following the 2010 census.
| Theodore S. Arrington is Emeritus Professor of Political Science at the University of North Carolina at Charlotte. He has been an expert witness in over 40 voting rights cases in the United States and Canada, and his commentary is frequently cited in the press. This article is a follow-up to his post-2018 analysis. |