KEY POINTS FROM THIS ARTICLE
— There is a substantial and persistent difference among pollsters’ findings with respect to Donald Trump’s job approval and his percentage against Joe Biden.
— Biden’s ability to consolidate the anti-Trump vote will be decisive.
— Trump’s statewide job approval is almost exactly what one would predict given his 2016 share of the vote. His approval is below 50% in every state that was competitive in 2016.
— However, Trump’s predicted two-party share of the vote is over 50% in states with 289 electoral votes. Seven states with a combined 88 electoral votes are projected to be within one point.
Trump approval versus voteshare
Few relationships are as strong in politics as the relationship between an incumbent’s presidential approval and the vote he receives in his race for reelection. Importantly, current polling shows significant inconsistency between Trump’s approval and his share of the vote. Figure 1 documents polling that includes both Trump’s job approval and percentage in trial heats.
On average, Trump’s job approval is about three points higher than what he receives in trial heats against former Vice President Joe Biden. But there is substantial variance in the relationship pollsters find.
Figure 1: Trump approval minus Trump vote share against Biden by pollster
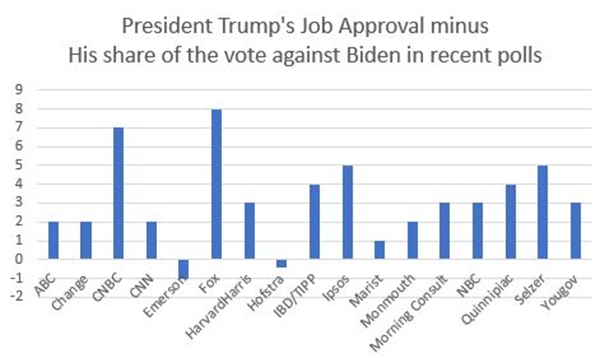
Note: Includes most recent poll conducted by listed national pollsters through Monday, April 13.
We are in the midst of the coronavirus pandemic. It is tempting to look at these numbers and conclude that the difference between Trump’s approval and his ballot test percentage against Biden is a function of Trump’s increase in approval rating due to the pandemic. But this relationship predates COVID-19. As Table 1 shows, the relationship different pollsters are finding between Trump’s job approval and his trial heat percentage against Biden has been stable over time. ABC, CNN, Marist, Mason-Dixon, and Quinnipiac have tended to find little difference between Trump’s job approval and his performance against Biden. Conversely, Fox News and Ipsos have found that Trump runs significantly behind his job approval.
Table 1: Trump approval vs. performance against Biden by pollster
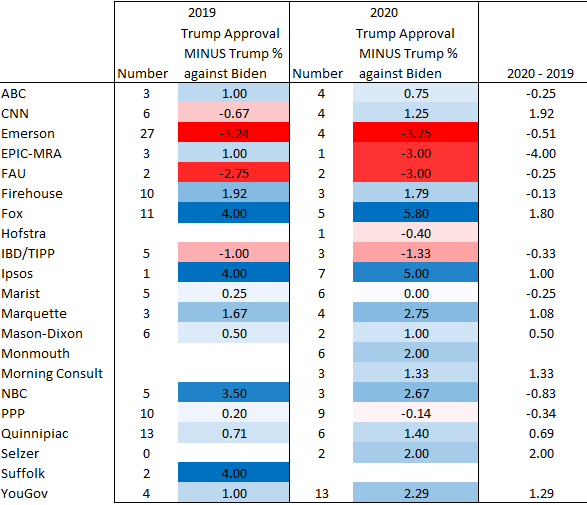
Note: Includes most recent poll through Monday, April 13.
History: Job approval and incumbent reelection
Figure 2 shows that it is rare for a president’s share of the vote to vary much if at all from his job approval rating.
Figure 2: Incumbent presidential voteshare and job approval, 1972-2012
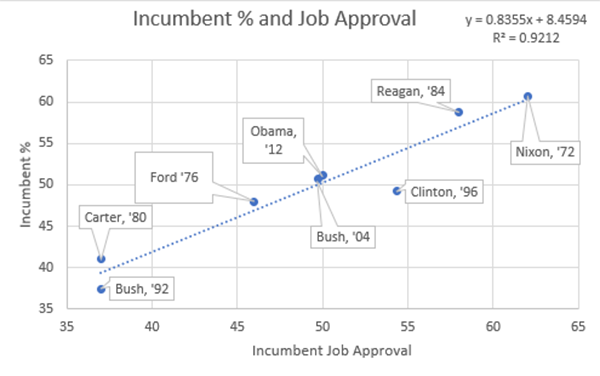
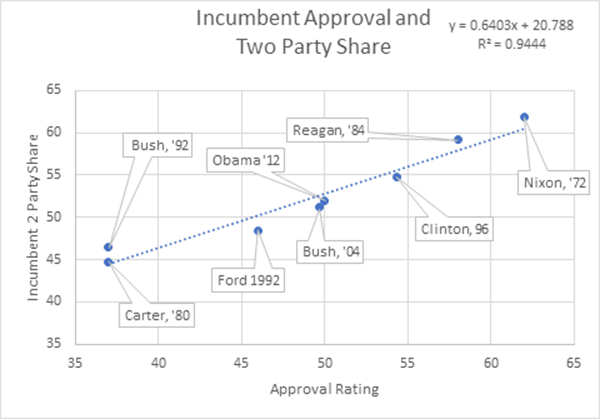
Figure 3 is the same chart, but it shows incumbent approval and the two-party share (which just counts votes cast for Democratic and Republican candidates):
Figure 3: Incumbent presidential two-party voteshare and job approval, 1972-2012
Here is the same data in table form. In 2004 and 2012, the exit poll asked about George W. Bush’s and Barack Obama’s job approval. I used the pre-election polling to make the chart, as there is an argument that because of the order in which the exit poll questions were asked Bush and Obama’s job approval numbers were inflated. Both numbers are shown in the table below.
Table 2: Incumbent presidential voteshare and job approval, 1972-2012
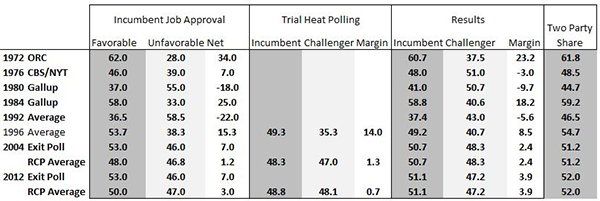
In 2012, Obama’s pre-election job approval net was more accurate in predicting his final margin than was the trial heat polling. In 2004, Bush’s pre-election job approval net and trial heat margin was about the same.
I compared the exit polling for job approval versus the actual results in 2004 and 2012. There is one issue: The 2012 exit poll asked about both job approval and a question about the voter’s “opinion about Obama.” In the national exit poll, Obama’s job approval was 53% approve, 46% disapprove, but Obama’s favorable number was 54% favorable, 45% unfavorable. However, the state-level job approval numbers were not released. Still I thought a state-by-state comparison was worth performing.
Table 3: Incumbent share minus job approval in 2004-2012
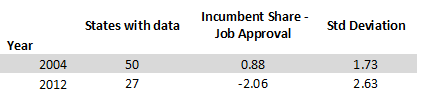
Bush slightly overperformed his job approval numbers in 2004. In 2012, Obama underperformed his favorability rating, but this isn’t surprising.
This charts the 2004 data — note the very high R squared (about .96 on a zero to one scale represents a very high relationship).
Figure 4: State job approval and Bush voteshare, 2004 election
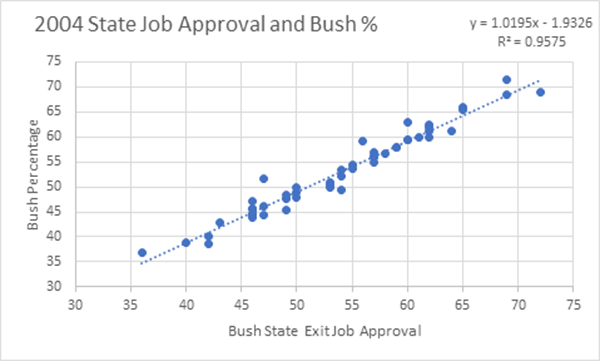
The conclusion here is obvious: We should be as interested at this point in Trump’s job approval as we are in his numbers again Biden.
State job approval and Trump’s reelection
Table 4 summarizes the state-level job approval ratings and the trial heart numbers since January of this year. State-level job approval and trial heat data were compiled from public polls — the full list is available here. I have listed the states in order of Trump’s job approval from lowest to highest. I assume that the Democrats start with 187 electoral votes.
This table also uses the historical relationship between presidential job approval and the incumbent president’s share of the vote to translate Donald Trump’s current job approval into the percentage of vote he will receive. For example, let’s take the random example of Wisconsin:
His average job approval in Wisconsin is 46.47%. So, we use this to project his percentage using the following formula, which is based on a regression analysis of the relationship between presidential approval and incumbent voteshare in past recent elections.
(46.47 * .8347) + 8.4944 = 47.28
This is Donald Trump’s predicted share of the two-party vote:
(46.47 * .6403) + 20.788 = 50.54
Though these calculations seem mundane, the difference between them is critical. Trump’s current predicted percentage in Wisconsin is quite a bit under 50%. Yet his predicted share of the two party-vote in Wisconsin is over 50%. The difference in these two calculations is the effect of third parties. These numbers suggest that Biden’s ability to consolidate voters who do not approve of the president’s performance will be the difference between a very close election and a relatively significant Democratic victory.
Critically, if the president continues to underperform his job approval by three to four percentage points, the state job approval numbers suggest a Democratic mini-landslide is possible.
Based on President Trump’s job approval, seven states appear critical. It is probably a mistake to think Trump’s likelihood of winning one of them is very different from another.
I highlighted one column in this table: It takes Donald Trump’s predicted share of the vote and compares it to what he received in 2016. I was frankly astonished at how closely they matched. The president’s job approval is very consistent with what his percentage was in 2016.
Table 4: Trump job approval, voteshare vs. Biden by state

Note: Includes most recent poll through Monday, April 13. To see a larger version of the table, click on the image.
| Daniel Guild is a lawyer and project manager who lives in New Hampshire. He writes for Bleeding Heartland and has written for CNN and contributed to the Washington Post’s 2020 primary simulations. Follow him on Twitter @dcg1114. |