KEY POINTS FROM THIS ARTICLE
— Two years ago, we began looking at the states that produced “excess” House seats for one party or the other — states for which the partisan ratio in House seats exceeds what would be predicted by the state’s presidential vote in 2020.
— Back then, we found a rough parity: Republicans squeezed out 32 excess seats, while Democrats squeezed out 28. Now, after a round of aggressive redistricting following the 2020 census, the GOP has expanded that lead to 39-24.
— The biggest states for Republican excess seats are Florida, with 5.5; Texas, with 4.9; and Tennessee, with 2.4. The biggest states for excess Democratic seats are California with 6.2, Illinois with 4.0, and Massachusetts with 3.0.
House overperformances by state
In an era of sharp partisan polarization, it’s increasingly common to find a correlation among House, Senate, and presidential results. Still, differences exist — and those differences help explain why the Democrats control the White House but the Republicans control the House.
Two years ago, we looked at the states that produced “excess” House seats for one party or the other — that is, states for which the partisan ratio in House seats exceeds what would be predicted by the state’s presidential vote in 2020.
At the time, we found a rough parity: Republicans squeezed out an extra 32 seats beyond what their state-by-state presidential results would have predicted, while Democrats squeezed out an extra 28 seats.
Now, after redistricting and the 2022 election, the GOP has expanded that lead. Today, the GOP holds 39 excess seats in the House, compared to 24 for the Democrats. That net GOP edge of 15 excess seats is about triple the Republicans’ narrow edge in the House, as their 222-seat majority is just 5 seats away from being in the slim minority (217 seats).
Let’s take a look at how this happened.
What was our methodology?
We began our analysis by calculating the percentage of House seats currently held by each party in each state (the “actual” breakdown), along with the percentage won by Joe Biden and Donald Trump in the 2020 election (the “ideal” breakdown). For the latter, we used the two-party breakdown, ignoring third-party votes cast for president (this is slightly different than how we calculated it in 2021, as we used the all-party vote that time).
Next, we subtracted the “ideal” percentage of seats from the “actual” percentage of seats and then multiplied this percentage by the total number of seats in the state’s congressional delegation. The result of this calculation was the number of “excess” seats that one party holds today beyond its percentage of the presidential vote in 2020.
A technical note: We ignored the 15 states with only one, two, or three House seats, because states this small would distort the comparison.
Table 1: Where do Republicans hold excess House seats?
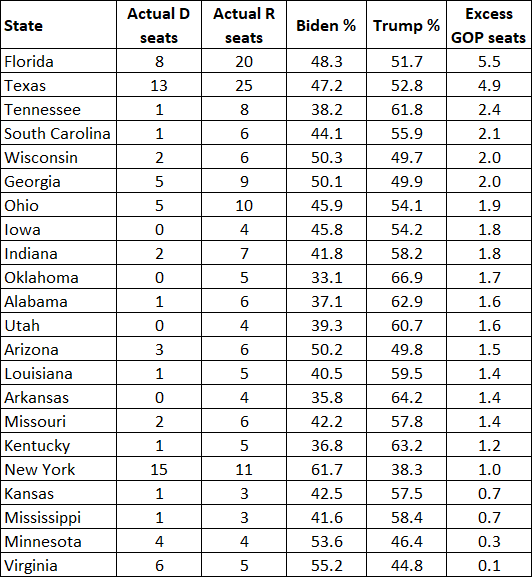
The biggest states for Republican excess seats are Florida, with 5.5 excess seats; Texas, with 4.9 excess seats; and Tennessee, with 2.4 excess seats.
Florida’s total was bolstered by an aggressive gerrymander enacted by GOP Gov. Ron DeSantis. Texas, another state where the GOP is dominant in the legislature and controls the governorship, implemented a map favorable to the GOP as well, as did Tennessee, which split a Democratic-leaning district based in Nashville into three parts, subsuming those areas into heavily GOP districts.
The GOP also pulls an impressive number of excess seats from smaller red states, including Iowa, Oklahoma, Utah, and Arkansas, each of which provide the party with 1.4 to 1.8 excess seats.
Especially notable on this list are two highly competitive presidential states won by Joe Biden. In Wisconsin and Georgia, GOP-favoring maps have given Republicans two excess seats each.
Table 2: Where do Democrats hold excess House seats?
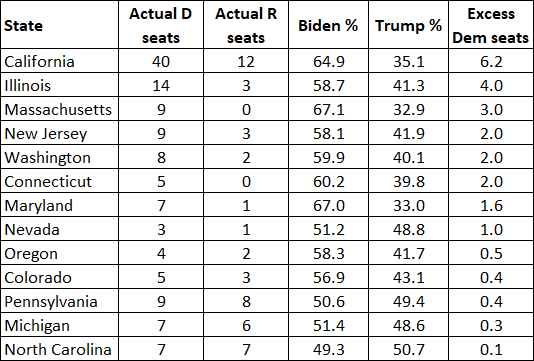
The biggest states for excess Democratic seats are California with 6.2, Illinois with 4.0, and Massachusetts with 3.0. While redistricting was a factor in Illinois — the Democratic legislature and governor enacted an aggressive map — it is less so in Massachusetts, where it is hard to draw a balanced partisan map due to the state’s very favorable Democratic geography, and it is not at all a factor in California, where the map was drawn by an independent commission (albeit one that Republicans sometimes grumble is more favorable to Democrats, but an actual Democratic gerrymander would be different and likely more hostile to Republicans).
Notably, the Democrats, unlike the Republicans, do not have as much of an excess-seat advantage in presidential battleground states. Four presidential swing states do have a Democratic excess-seat edge, but in three states, the difference is tiny (North Carolina, Michigan, and Pennsylvania), while in one, it’s only a little bit larger (Nevada).
What states have close to the “correct” ratio?
Congratulations to the 10 states that have produced House seat ratios that are roughly “correct” compared to their 2020 presidential results — though in some cases, the fact that the ratio is very close comes as a disappointment to partisan mapmakers.
Four of these states have a slight Republican edge in House seats (Kansas, Mississippi, Minnesota, and Virginia) while six have a slight Democratic edge in House seats (North Carolina, Michigan, Pennsylvania, Colorado, Oregon, and Nevada). But in each of these 10 states, there’s only a fractional excess seat for one party or the other, making these states a pretty good approximation of partisan balance.
This comes after a Republican gerrymander in Kansas and a Democratic gerrymander in Oregon failed to produce the results the majority party hoped for, as Rep. Sharice Davids (D, KS-3) easily won despite her seat being made less Democratic and Rep. Lori Chavez-DeRemer’s (R, OR-5) narrow victory foiled Democratic attempts to create a 5-1 edge in the state’s delegation. Nevada Democrats, meanwhile, drew an incumbent-protection gerrymander that allowed them to retain their 3-1 edge in that state, taking three-quarters of the seats in what is fairly close to a 50-50 state at the federal level (although because the overall delegation is so small — with just four seats, the bare minimum to be included in this article — it only accounts for a single “extra” Democratic seat). Many of these other states saw maps that were created by some sort of nonpartisan process, be it a commission or court.
Three other states are worth noting here because they have enough vulnerable seats in the 2024 election cycle to erase the current number of excess seats.
In Arizona, the GOP holds 1.5 excess House seats, but two of the state’s Republican-held seats are considered vulnerable in 2024 — the 1st District’s David Schweikert and the 6th District’s Juan Ciscomani (in 2020, Biden would have very narrowly carried both seats). So these could easily flip in 2024, producing a Democratic edge in excess seats.
The GOP also holds excess seats in a more surprising state: generally blue New York. Due to unusual Democratic weaknesses in the 2022 midterms — combined with a relatively balanced court-drawn map — Republicans actually hold one excess House seat in New York. But that is unlikely to hold. Even if the Democratic legislature fails in its bid to enact a more favorable map for the party, Republicans currently hold a half-dozen seats in New York that could be at risk in 2024, including the 3rd District’s George Santos, the 4th District’s Anthony D’Esposito, the 17th District’s Mike Lawler, the 19th District’s Marc Molinaro, and the 22nd District’s Brandon Williams.
Meanwhile, the Democrats have two excess seats in Washington state, along with two incumbents who could be at least somewhat vulnerable in 2024: the 3rd District’s Marie Gluesenkamp Perez and the 8th District’s Kim Schrier.
How have the patterns changed from two years ago?
The Republicans have increased their lead in excess seats during the past two years.
In our previous analysis, the GOP had a 32-28 edge in excess seats. Now, the GOP has a 39-24 lead in excess seats — nearly quadruple its previous edge.
The Republican gains were built on big swings in Florida and New York, based on a GOP gerrymander in the former and, at least partially, on the inability of Democrats to gerrymander the latter. Both swung roughly 3.5 seats in favor of the GOP. Republicans gained more modestly in several other places, including in Texas, where the GOP gerrymander focused more on shoring up incumbents against recent Democratic gains. That plan increased the number of GOP excess seats in Texas by just 0.6.
As for the Democrats, Illinois with its Democratic gerrymander represented a notable gain, as their excess seat edge in the state expanded by 1.3 seats.
In addition to New York, the Democrats suffered a significant decrease in California, where the party lost 2.2 excess seats. These were largely due not to redistricting but rather to Republican success in competitive districts, including the 13th District’s John Duarte, the 22nd District’s David Valadao, the 27th District’s Mike Garcia, the 40th District’s Young Kim, the 41st District’s Ken Calvert, and the 45th District’s Michelle Steel. Biden carried all of these districts except for Calvert’s, and redistricting made that district more competitive than it had been previously.
Where could pending redistricting efforts change the calculus?
Redistricting could force changes in several states. Leading that list is North Carolina, where the current map was imposed by the state’s formerly Democratic-controlled state Supreme Court. That court has since flipped to Republican control, and the justices have overruled the old court’s ruling that blocked a previous GOP gerrymander. A new Republican-drawn gerrymander there should push the state’s delegation from 7-7 now to perhaps 10-4 or even 11-3 Republican, which would give Republicans several “excess” seats in what is otherwise a closely-divided but Republican-leaning state.
Meanwhile, potential remaps in Ohio and New York could improve the majority party’s position.
In Ohio, a stronger GOP edge on the state Supreme Court could allow a more GOP-friendly map, potentially enabling Republicans to increase their lead in excess seats from its current 1.9. The situation in Ohio seems to be in flux, though, in the aftermath of the failure of Issue 1 — which would have made it harder for voters to change the state constitution — and a newly-announced effort by reformers to ask voters to create a new, independent redistricting commission next year. Meanwhile, in New York, Democrats may be able to enact a more favorable map, which, combined with stronger showings in vulnerable GOP-held districts during a presidential year, could flip the Republicans’ current edge in excess seats.
At the same time, redistricting developments in several states could eat into the GOP’s excess-seat edge in solidly red states. Redraws required by the 2023 U.S. Supreme Court decision in the case Allen v. Milligan could produce Democratic gains of a seat each in Alabama and Louisiana, essentially erasing the GOP’s excess-seat edge in those states. And while Allen v. Milligan is not having a direct effect on Florida’s GOP gerrymander, state court action there could give the Democrats an extra seat for 2024. Late last week, the state and groups suing over the state’s congressional map agreed to narrow the legal battle’s scope to just the possibility of restoring a substantially Black northern Florida district that, if ultimately redrawn, would almost certainly be won by a Democrat.
Other developments in redistricting could help Democrats in Wisconsin, where the party has a newly ensconced majority on the Supreme Court. And there are some looming redistricting lawsuits elsewhere that could eventually result in changes to the current maps. These changes could cause the imbalances in some states to narrow — or expand, depending on what happens.
| Louis Jacobson is a Senior Columnist for Sabato’s Crystal Ball. He is also the senior correspondent at the fact-checking website PolitiFact and is senior author of the newly released Almanac of American Politics 2024. He was senior author of the Almanac’s 2016, 2018, 2020, and 2022 editions and a contributing writer for the 2000 and 2004 editions. |