KEY POINTS FROM THIS ARTICLE
— Compared to 2004, another year that featured a Republican president in a lightly-contested primary and a contested Democratic primary race, turnout has been up across the board.
— 63% of the votes cast in this year’s primaries have been on the Democratic side, which, interestingly, mirrors 2004.
— States that hold both their presidential and congressional primaries on the same day may see unique turnout dynamics.
— We made a House rating change late last week: Rep. Josh Harder (D, CA-10) moves from Likely Democratic to Safe Democratic. A brief explanation is included at the end of this article.
Table 1: House rating change
2020 vs 2004: More votes, but same breakdown
Early in the primary season, Republican pollster John Couvillon noted that President Trump’s “unshakable” rapport with the Republican Party’s base may be leading GOP partisans to do something unusual historically: turn out in uncontested primaries.
In state after state, Trump would routinely receive far more raw votes than previous sitting presidents who found themselves in lightly-contested reelection primaries. For a president who famously values personal loyalty, Trump’s vote totals in the primaries seemed a solid manifestation of support from the GOP base.
Still, is it really that rare for presidents to be popular with their base? After all, Barack Obama and George W. Bush were pretty popular within their parties.
First, let’s look at how primaries this year have shaped up so far this cycle.
So far in the primary season, 25 states have held primaries where presidential nominees from both major parties were on the ballot. Table 2, which is arranged chronologically, looks at the aggregate partisan totals for these states. In some state primaries, only the Democratic side was contested — the Crystal Ball’s home of Virginia, for example, saw a high-turnout primary in March, but voters could only cast a ballot in the Democratic primary. So we excluded Virginia and other similar states.
Table 2: Partisan composition of the 2020 primaries
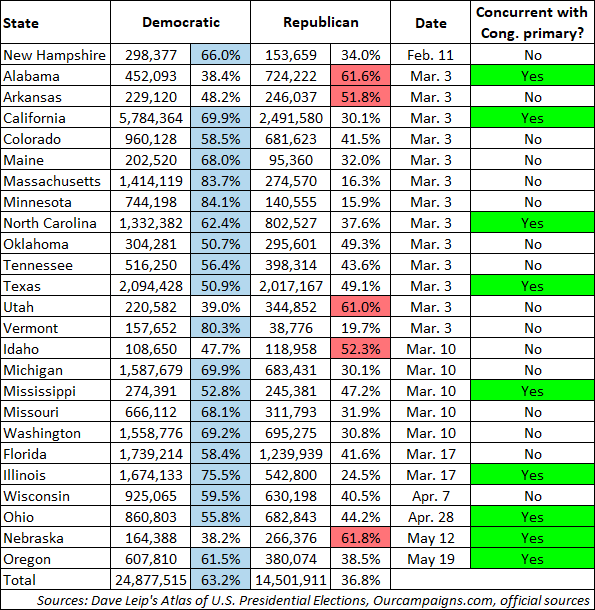
Coincidentally, the states in Table 2 would have, taken all together, favored Hillary Clinton 48%-46% in the 2016 general election — in other words, this sampling matched the national popular vote exactly.
Breaking these states down further, we expected that states that held their presidential and congressional primaries on the same day would have a more equitable partisan balance than states that didn’t. In other words, for Republicans, even though their presidential primary was noncompetitive, congressional primaries, or perhaps other down-ballot races, could have driven partisans to the polls.
Most states, at least of the group that’s voted so far, favor holding separate primaries for their presidential and down-ballot primaries. New Hampshire seems to take this to the extreme: in a state where the “first in the nation” presidential primary is a deeply ingrained facet of the political culture, residents there won’t vote in congressional primaries until Sept. 8.
In any case, nine of the 25 states in Table 2 held their presidential and congressional primaries concurrently. Chronologically, they were dispersed evenly throughout the calendar: Alabama voted on Super Tuesday while Nebraska held a May primary. Though this was undoubtedly skewed by megastate California, another concurrent presidential and down-ballot primary state, just over half of the votes that were cast in the primaries (21 million out of 39 million) came from these nine states. The partisan composition of the group was 62%-38% in favor of Democrats, not markedly different than the overall total — though removing California knocks the Democratic share down five points, to 57%. But still, in the general election, neither party will be able to simply exclude unfavorable states from the electorate.
In Table 2, Republicans outvoted Democrats in Alabama, Arkansas, Utah, Idaho, and Nebraska — only two of which held congressional primaries, Alabama and Nebraska. The GOP’s 62%-38% edge in Alabama probably was helped by the competitive Republican Senate primary, which guest author Niles Francis profiled at the time. In Nebraska, the most closely-watched primary was on the Democratic side, for the nomination in NE-2 to face Rep. Don Bacon (R). Still, statewide, Democrats can claim just 29% of registered voters, a plurality of which are clustered in that Omaha-based district. Republicans hold a 46%-13% registration advantage over Democrats in Utah, a heftier 50%-14% edge in Idaho, and have made major inroads in Arkansas over the last decade (although the vast majority of voters in Arkansas don’t claim a formal party affiliation) — so these are states where the GOP could be expected to turn out more voters, even in a situation where their presidential primary was not noncompetitive.
For some historical perspective, let’s consider the last time an incumbent Republican president was facing a lightly-contested primary: 2004. That year, George W. Bush faced token, if any, opposition in states that held Republican presidential primaries. On the Democratic side, though he lost a few early states, then-Sen. John Kerry grabbed control of the Democratic race relatively early in the process — somewhat similar to Biden this time, although Biden had a harder time (particularly early in the calendar).
Conveniently for comparison’s sake, 25 states in 2004 held primaries where candidates from both parties appeared on the ballot, giving us a sample comparable to what we’ve logged so far this year. Going further, just as our states in Table 2 mirrored the national vote in 2016, the 25 states in Table 3 would go on to, collectively, support Bush 51%-48% in the 2004 general election, the same as his popular vote margin. Table 3 lists the 2004 primaries in chronological order.
Table 3: Partisan composition of 2004 presidential primaries
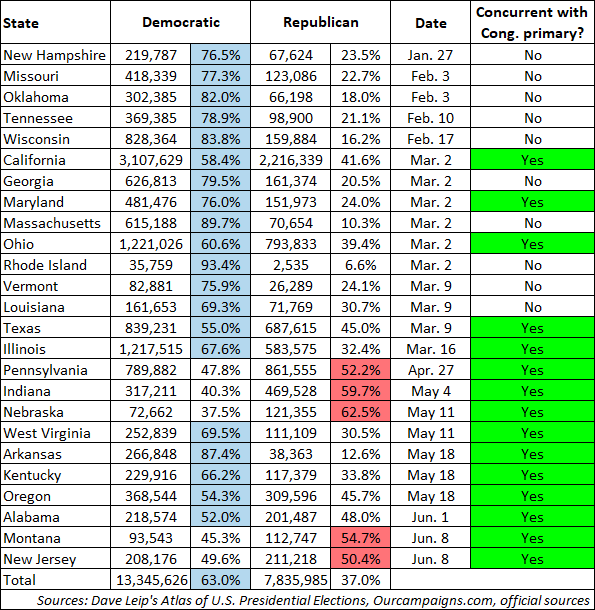
In 2004, states that held both presidential and congressional primaries fell almost uniformly later in the calendar. Perhaps this was a function of 2004 primary season’s earlier time frame. This year’s first primary, in New Hampshire, fell on Feb. 11 — by that date in 2004, several states had already held primaries. At the congressional level, states rarely hold primaries before March; Texas was near the beginning of the calendar this year, and in the past two midterms, it’s kicked off the congressional primary season by voting in the first week of March.
In 2004, Republicans received more votes in five states: Pennsylvania, Indiana, Nebraska, Montana and New Jersey. All five states held their presidential primaries in tandem with their congressional primaries, and all were held after the truly competitive portion of the Democratic primary race was over. Of that quintet, Pennsylvania and New Jersey may seem like curiosities: they would go on to back Kerry that fall. In the case of Pennsylvania, its placement makes more sense when we consider the down-ballot dynamics. That year, the late Sen. Arlen Specter — a moderate Republican who would eventually defect to the Democratic Party — was fending off a conservative primary challenge from then-Rep. Pat Toomey (who would later win the Senate seat in 2010). Bush campaigned for Specter and helped the incumbent to a hard-fought 51%-49% victory. New Jersey voted along with Montana on June 8, which made them the last two states to vote that primary season. Perhaps by then, Kerry’s inevitability dampened Democratic enthusiasm to the point of producing an essentially 50/50 partisan breakdown.
Though the 2020 presidential primary season won’t end for a few more months, the turnout increase on both sides is notable. While the rosters aren’t identical, the states listed in Table 2 cast just over 39 million votes this year, which equates to nearly a doubling of Table 3’s 21 million votes, from 2004. As the Republican side lacked serious competition in both years, it likely speaks well of the Trump campaign’s turnout operation that both the GOP and Democratic vote total rose commensurately between the years (we also have to remember that population sizes and the number of registered voters are also higher now than 16 years ago).
In this respect, New Hampshire, where the Trump campaign made a relatively strong debut at the onset of the primary season, seems emblematic. Compared to 2004, Republican turnout more than doubled in 2020: going from 68,000 votes cast up to 154,000. Perhaps just as telling was that Trump received 84% of the vote in that primary, a sign that his standing with the party was solid. In the past, unpopular presidents have been punished by their parties in Granite State primaries: George H. W. Bush took just 53% there in 1992, and Lyndon Johnson (though not actively campaigning and running as just a write-in candidate) was held to a 50%-42% edge there by Sen. Eugene McCarthy in 1968. Neither Bush nor Johnson would make it back to the White House for the next term: Johnson retired and Bush lost the general election.
Texas, with its early March primary, has a stationary position on the primary calendar. The electorate actually was more Republican-leaning in 2020 than in 2004. This year, Democrats outvoted Republicans there 51%-49% in the primary, which was down from their 55%-45% advantage in 2004. During that stretch, the total number of votes cast in the Lone Star State ballooned from 1.5 million to over 4 million. Granted, Texas has seen rather explosive population growth since 2004, which surely factored in to that increase; it had just over 12 million registered voters then, and that’s now around 16 million. Aside from the noncompetitive GOP presidential primaries, though, one constant in Texas was the flurry of down-ballot activity: both sides had multiple competitive congressional primaries this year, and in 2004, the Republicans had just (controversially) passed a new congressional map that replaced a Democratic gerrymander with a Republican one, which prompted a bevy of candidates to run in primaries.
There’s no shortage of moving parts when comparing presidential primaries over the years — trends in partisan registration, population shifts, and placement on the calendar, just to name a few — so what we have isn’t a perfect apples to apples comparison. But it’s clear that Trump is at least inspiring higher turnout among Republican partisans. While that may be a promising sign for the president’s reelection, he did only receive 46% of the vote in 2016. With the share of third parties likely to be down this year, the challenge for Republicans is to expand their vote share beyond that.
P.S. California House rating change
We already were bullish on the reelection odds of Rep. Josh Harder (D, CA-10), who defeated former Rep. Jeff Denham (R) in a swing district in California’s Central Valley in 2018. Ted Howze (R) did not appear to be a top challenger to Harder, and his fledgling candidacy was rocked recently by reports about offensive social media posts that have appeared on his accounts. He’s claimed that the posts were posted by others, but that is an increasingly difficult excuse to believe.
Late last week, the National Republican Congressional Committee removed Howze from its featured program for top recruits and House Minority Leader Kevin McCarthy (R, CA-23) rescinded his endorsement shortly afterward. Harder already had a huge money edge on Howze. Additionally, the combined two-party Democratic vote in this district was just a couple tenths of a point shy of 50% in the March top-two primary, and the Democratic vote share in this district has consistently increased from the primary to the general (we wrote about this in some detail last month, and following our publication of that article, late-counted votes pushed the Democratic share in CA-10 to 49.8%). Based on all of this, Harder should be fine this fall, and we moved CA-10 from Likely Democratic to Safe Democratic last Thursday in an announcement on Twitter.