KEY POINTS FROM THIS ARTICLE
— Potentially weak major party nominees paired with a long list of third party candidates could lead to a higher-than-usual level of third party voting in 2024.
— Recent third party performance has generally been strongest in western states and weakest in the South.
— The states that are most likely to decide the 2024 election have not had high average third party voting this century.
Where voters are most open to third party presidential candidates
We feel very confident in saying that the next president will be a Democrat or a Republican (I know what you’re thinking — the Crystal Ball sure is going out on a limb here!)
But we start with this blindingly obvious statement as we consider that the list of third party candidates may be long in 2024. Most recently, and most notably, vaccine skeptic Robert F. Kennedy Jr. switched from the Democratic primary to making an independent bid, and early polls have shown him getting considerable support (more on that momentarily).
In addition to RFK Jr., left-wing intellectual Cornel West is also running, most recently deciding to run as a true independent instead of seeking the Green Party nomination. No Labels, the third party group that Democrats see as a front for Republicans trying to hurt Joe Biden through the party’s potential candidacy, is also floating out there. And that doesn’t even mention the Green and Libertarian parties, the two most reliable sources of third party candidates in recent years, or anyone else who might run.
None of these candidates, individually, would have a prayer of winning barring some truly incredible change in American politics, nor are they even guaranteed to be on the ballot everywhere. Collectively, though, the level of support they get will be interesting to monitor, and it may be that the third party vote ends up disproportionately hurting one of the major party nominees over the other, although that is not certain. At least two recent polls, from USA Today/Suffolk and NPR/PBS NewsHour/Marist, showed Donald Trump doing better on the two-way ballot against Biden than if Kennedy was included (although the effect is more pronounced in the Marist survey). But after using Kennedy as a weapon against Biden in the Democratic primary, Republicans are switching gears as he now appears to threaten Trump more.
If the election is Biden versus Trump, there likely will be a sizable number of voters who hold negative views of each candidate: according to RealClearPolitics, Biden’s favorability is 41% favorable/55% unfavorable, and Trump’s split is 40%/56%. By definition, then, a significant slice of the electorate would have negative views of both candidates, as was the case with Hillary Clinton and Donald Trump in 2016. That year ended up producing the highest share of third party votes of the six elections this century, 6.1%. The other years were 3.8% (2000), 1.0% (2004), 1.5% (2008), 1.8% (2012), and 1.9% (2020). It seems reasonable to think that a Biden-Trump rematch would at least produce a third party vote more like 2000 or 2016 than like the other elections. Hmmm, 2000 and 2016? What could those elections possibly have in common? We suspect we don’t need to remind Democrats — which is why the panic over third party candidates seems more concentrated among Democrats than Republicans. Or at least that was the case before Kennedy flipped races.
Despite starting out in double digits in some surveys, we doubt that RFK Jr. would actually end up in the teens. Third party candidates often poll better than they perform, and antipathy to the two major party frontrunners may artificially boost his on-paper numbers. Just to cite one recent example, Libertarian Gary Johnson and Green Jill Stein were averaging 9% and 3% support, respectively, in the RealClearPolitics national polling average as late as September 2016. They ended up getting just 3.3% and 1.1%, respectively, when the votes were actually cast. But whatever Kennedy’s actual level of support may be, his true standing in the race may not reveal itself until very late in the campaign, if at all, in polls. So his presence, and the presence of other third party candidates, may make polling harder to decipher, with an artificially high level of support going to non-major party candidates for much of the campaign. And we will also at least have to entertain the possibility that the third party support is not actually inflated, even if that is what history generally suggests.
State-level third party trends
Across the states, third party performance can vary significantly — after all, the roster of third party candidates is different every cycle, and some individual candidacies can generate unique levels of support in a given state, which we’ll get into below. Also, it’s harder to get on the ballot in some places than others (Richard Winger’s Ballot Access News has a helpful rundown). There are some patterns from recent history, though.
As we noted above, the third party vote for the six elections conducted this century has ranged from a low of just 1% in 2004 to a high of 6% in 2016. The average national third party share over those six elections was 2.7%. Table 1 shows the states with the highest average non-major party vote shares from 2000-2020.
Table 1: Highest average third party presidential share, 2000-2020
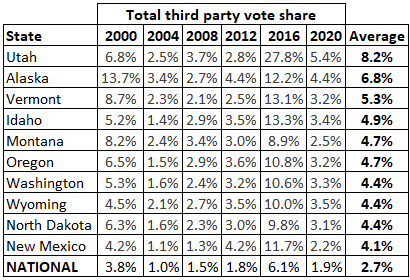
Source and note: Dave Leip’s Atlas of U.S. Presidential Elections; the percentages reported in Tables 1, 2, and 3 represent the share of all the votes cast for candidates other than the Democratic or Republican nominees.
The state that, on average, had the highest share of third party voting over the last six elections may be a bit of a surprise, although it also shows how using averages can skew things. This state is Utah: Its average third party share this century was 8.2%. However, that average is juiced by Evan McMullin’s anti-Trump Republican candidacy in 2016 — he got 21.3% in Utah that year, by far his best performance anywhere in the country and by far the best single third-party candidacy in any state this century (McMullin represented something of a Mormon insurgency against Trump, at least back then). The aggregate third party share in Utah that year was 27.8%, 21.7 points higher than the total third party national share — again, the highest of any state in any year from 2000-2020.
However, it’s worth noting that the third party share in Utah was higher than the national third party share in all six elections we looked at, so while 2016 was fluky and high, third party performance in Utah has otherwise been good in recent years. The same can be said of McMullin-friendly Idaho, where he got 6.7% of the vote (he did not break 2% anywhere else and was not on the ballot in several places).
More broadly, the West features 9 of the 10 strongest average third party states this century. The one exception among that group is Vermont, which also had a fluky performance of its own — write-ins predominantly cast as a protest vote for home-state Sen. Bernie Sanders (I-VT) made up 7% of all the votes cast statewide in 2016, contributing to an overall and robust 13.1% share for non-major party candidates in the state that year. But Vermont, like Utah, also had a higher third party share than the nation in each election this century, so it isn’t all driven by one fluky election. Alaska also unsurprisingly ranks high on this list, given its quirky politics, such as electing a one-term independent governor (Bill Walker) in 2014 and sometimes featuring cross-party coalitions in its state legislative chambers.
More generally, we also can see some logic behind the two consistently-balloted third parties — Greens and Libertarians — having greater appeal to, respectively, West Coast liberals and rural westerners.
New Mexico’s position on this list is largely because of former Gov. Gary Johnson’s home state overperformances in both 2012 and (especially) 2016 as the Libertarian nominee — absent those two elections, the third party share in that state is unremarkable compared to the nation. One thing to watch is whether an eventual third party candidate has some obvious connection to a certain state or region — it could be, for instance, that Kennedy does marginally better in the Northeast than some other places simply because of the family’s long history in the region (and despite some prominent members of his family rallying against him).
This western trend of higher third party voting may continue: A couple of recent national polls that tested Kennedy on the general election ballot included a regional breakdown: Marist had Kennedy doing best out west (22%), although his Midwest support was very similar (19%), with the South and Northeast lagging at 13% and 14%, respectively; the other, Suffolk, showed Kennedy basically doing the same across regions. So perhaps Kennedy won’t have some special appeal in the Northeast.
Just missing the top 10 list are three states that are Democratic-leaning states on the periphery of the competitive map: Colorado, Maine, and Minnesota. Higher-than-average third party voting in the latter two states allowed Donald Trump to come within a few points of carrying each in 2016, but the baseline Democratic partisanship of each reasserted itself in 2020 as the third party tide receded in each state. Third party defections from Biden would be an essential part of any Republican path to victory in Maine or Minnesota; the third state noted here, Colorado, has zoomed left in recent years and is probably an even harder slog for modern Republicans.
Table 2: Lowest average third party presidential share, 2000-2020
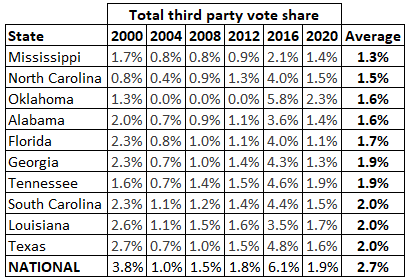
Meanwhile, the South dominates the list of lowest third party average performances this century (Table 2), with all 10 states on that list being part of the region: 9 of the 10 were part of the Confederacy during the Civil War, and the other was Oklahoma, which did not become a state until well after the war but fits in a modern definition of the South.
It’s hard to pinpoint exactly why third party presidential voting is lower in the South, although political scientist Julia Azari mentioned the region’s one-party tradition as perhaps part of it in an analysis of state-level third party voting she wrote during the 2016 cycle. There’s also the possibility that just as laissez-faire Libertarians and far-left Greens may be a good fit for the freewheeling West, they may be a poorer fit for the conservative South. Of course, some of the most historically noteworthy third party campaigns, like Strom Thurmond in 1948 and George Wallace in 1968, were segregationist insurgencies defined by Southern support (and Wallace remains the most recent third party candidate to win a state). But for whatever reason, more recent third party candidacies have generally been weak in the South — that includes Ross Perot in both 1992 and 1996, as many of his smallest vote shares came in the South.
Of greatest interest to us is whether we should expect the third party vote to be meaningfully higher or lower in the most important states in the Electoral College. Seven states were decided by 3 points or less in 2020: Arizona, Georgia, Michigan, Nevada, North Carolina, Pennsylvania, and Wisconsin — these states form the core of what we expect to be the competitive map in 2024. Their recent third party history is shown in Table 3.
Table 3: Average third party performance by closest 2020 states, 2000-2020
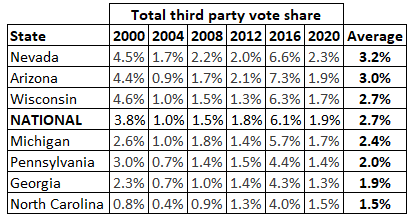
Georgia and North Carolina are already listed in Table 2 among the low-performing third party states.
Pennsylvania and Michigan are also on the lower end of the average — the Keystone State was just a couple hundredths of a point from being listed in the bottom 10 of average third party voting in Table 2. Wisconsin is basically right at the average, and Arizona is a little above average, with the big third party year of 2016 standing out as its strongest outlier year (and even then, the third party share was only a little over a point higher than the nation as a whole). Of these core swing states, Nevada has had the highest average third party vote in recent elections. Nevada offers voters an explicit “None of These Candidates” option, which likely contributes to the higher average: This option has gotten at least 0.4% of the vote in every election this century, and that’s about how much higher Nevada’s average third party voting is compared to the rest of the country. Arizona and Nevada being a little higher than average also just fits in with them being western states, given the heightened support that recent third party candidates have gotten in that region.
So, while there are a number of states that have a recent track record of clearly higher-than-average third party performances, the states most likely to decide the election are not really among them. That doesn’t mean third party votes in these states are necessarily unimportant: It just means that we shouldn’t expect the third party candidates to do better in them than they do nationally. It may also be that a common argument against voting third party — “go ahead, throw your vote away,” to quote a favorite Simpsons episode — is perhaps most persuasive in the top battlegrounds.