KEY POINTS FROM THIS ARTICLE
—As with our recent examination of the Republican primary, President Biden—like former President Trump—has won most of his contests easily, but some areas stand out.
—The Upper Midwest has been an interesting region in the Democratic primary where Biden has held up better in rural areas than in urban core counties.
—In some “ancestrally Democratic” states that have closed primaries, there has been a small but clear protest vote against Biden.
—Looking at Pennsylvania’s recent results in this context basically affirms some of its longer-term realigning movements.
Now, for the Democratic primary…
Last week, we considered Donald Trump’s performance in the Republican primary. Of course, Trump ended up dominating what was initially a crowded field and has been the presumptive nominee for more than a month. But when we went into the weeds in each state and looked at where his 2024 coalition was especially strong (or weak), some familiar patterns were present. Generally speaking, while Trump’s hold on rural America remains strong, there are clearly some signs that he’s continuing to struggle in many suburban counties.
So, for this week, we are doing something of a follow-up article and shifting our focus to the Democratic side. If the Republican primary was a lopsided affair this cycle, the Democratic primary has been even more of a cut-and-dry event: except for American Samoa’s caucus—where entrepreneur Jason Palmer, a former student of the Center’s Director, Larry Sabato, pulled an upset—President Biden has handily won each contest this year. That said, there has been a considerable amount of media interest in the “protest” vote against Biden, specifically over his foreign policy, in the context of several state contests, notably Michigan and Minnesota (we’ll get to those later).
In our analysis of the Republican primary, we treated the contest as if it were a two-way race between Trump and his strongest (and we are being somewhat charitable with that descriptor) rival, former Ambassador to the United Nations Nikki Haley. This was because Haley was Trump’s sole active competitor for much of the time that the primary was live, and a two-way format just made for easier comparisons across the board. Biden, though, lacked a Haley-caliber challenger. In most primaries, his two most visible challengers, Rep. Dean Phillips (D, MN-3) and self-help author Marianne Williamson, would claim a few percentage points each. In some other primaries, “uncommitted” would be the sole option aside from Biden. In New York, where voters lacked an “uncommitted” option, there was an effort by some Democrats to just leave their ballot blank as a form of protest—but as undervotes weren’t accounted for by our state source, we couldn’t consider them here.
So, with that in mind, for our analysis this week, we are looking at the Biden vs “Not Biden” vote, with the latter category encompassing all votes cast for someone other than Biden.
With that background, Map 1 considers how Biden performed in each county compared to his overall share in each state. In blue counties, Biden’s share was higher than his overall statewide share while the reverse was the case in orange counties. Map 1 excludes states that have held caucuses and includes every primary state where Biden faced at least some opposition except for Pennsylvania, which voted on Tuesday and is still processing votes (although we’ll have some brief comments and maps specifically for the Keystone State later on).
Map 1: Counties where Biden was over/under his total share in each primary state
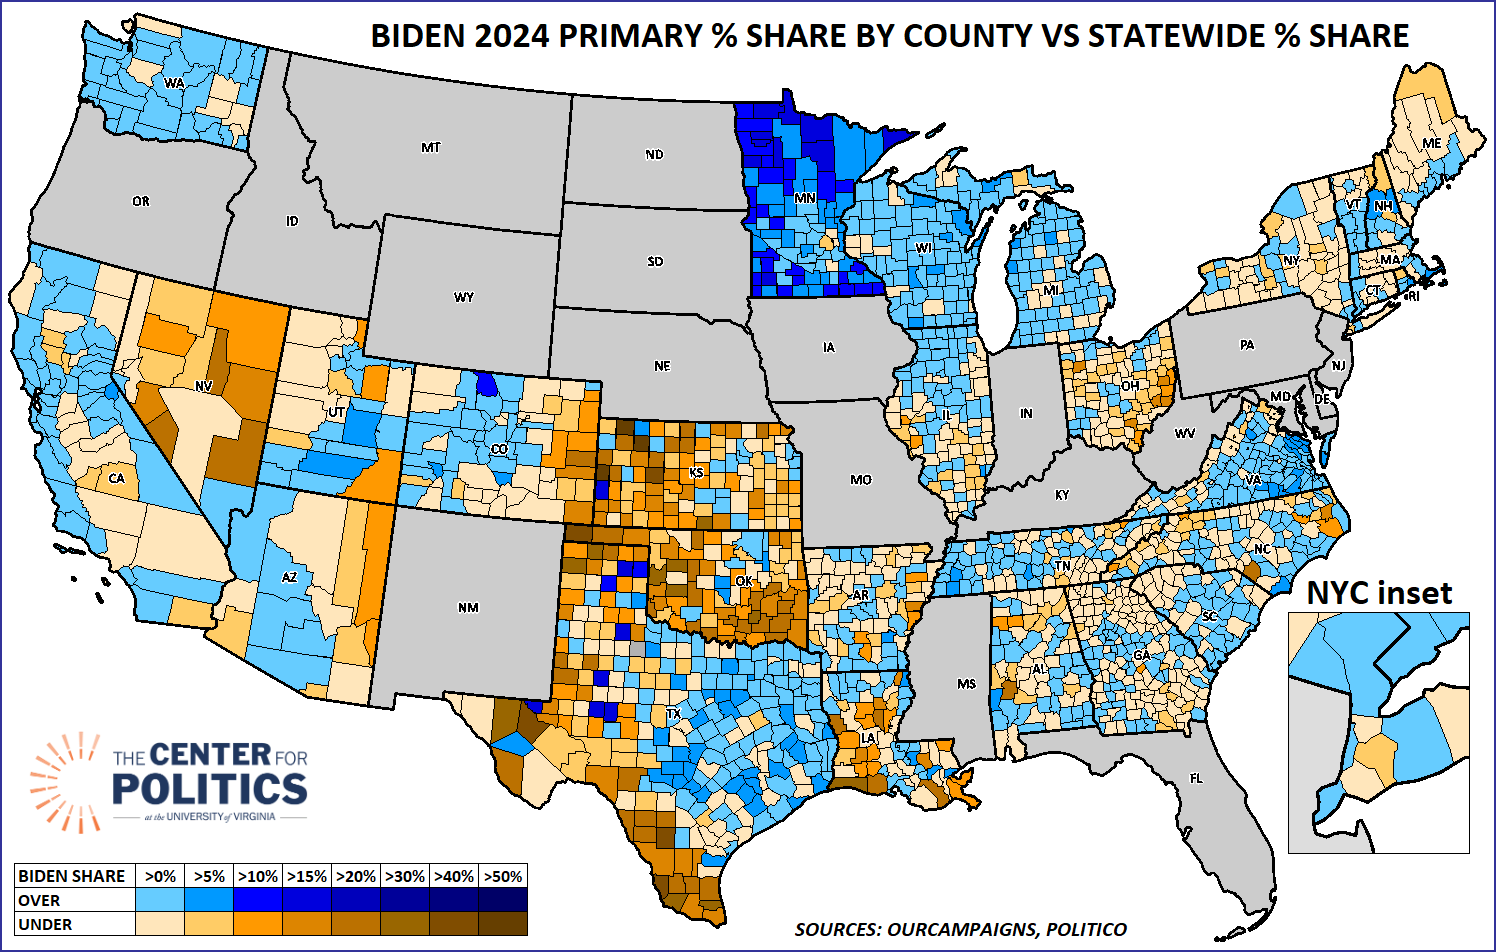
Before we get into our more specific observations, we would note again, thinking bigger picture, that the Democratic primary was hardly competitive. Biden’s vote share exceeded 90% in about one-third of the nearly 2,000 counties/equivalents that Map 1 considers—his share was at or above 85% in 60% of the counties. So Biden’s high starting point means that, in most counties where he did especially well, he just didn’t have that much room to beat his overall number in most states. This is one reason why there is so much more dark orange than dark blue on the map.
The one big exception to this rule, though, was Minnesota. Statewide, “Uncommitted” received almost 19% of the vote, and its support was concentrated in the core Twin Cities metro counties—in Hennepin County, for instance, it took 25% countywide and 37% in Minneapolis proper. Outside the immediate vicinity of the Twin Cities, the only county where Biden ran under his statewide share was Rice, which is near Carleton College, where the late Sen. Paul Wellstone (D) taught political science before his time in elected office. With a few counties effectively weighing down his statewide share, Biden was above his overall number in 83 of Minnesota’s 87 counties; he also ran at least 10 percentage points over his statewide share in 36 counties.
Some of the darkest blue counties in Minnesota were concentrated in the rural northwest—though she dropped out before her home state’s primary in 2020, Sen. Amy Klobuchar (D) also had some notable strength there. In fact, Klobuchar’s best county from 2020, Red Lake, was also Biden’s best county, in relative terms, nationally on Map 1. We’d also note that this doesn’t mean we expect Biden to actually carry these types of areas in the general election—Red Lake County was two-to-one for Trump in 2020, and Klobuchar could well lose it for the first time in her career later this year —but it does illustrate that the “urban” protest vote made these rural areas appear relatively more pro-Biden in the context of the primary.
One last note on Minnesota: it was, of course, Phillips’s home state. Phillips, who was still an active candidate when the state voted on Super Tuesday, performed several points better in his MN-3 than he did statewide—he took 14% in his district while pulling less than 8% overall. But because the Uncommitted vote was lower in MN-3 than in the adjacent MN-5, which has Minneapolis proper, Biden’s share in MN-3 (69.95%) about matched his overall showing in Minnesota (70.12%).
Though it was something of an extreme case, Minnesota’s fundamental dynamic was at play throughout the Upper Midwest. In Michigan, which had a more publicized, if ultimately less impactful, Uncommitted effort than Minnesota, Biden showed some relative weakness in urban areas. Some notable counties where Biden was under his state share were Wayne (Detroit and Dearborn), Washtenaw (Ann Arbor and the University of Michigan), Ingham (Lansing and Michigan State University), and Kent (Grand Rapids). Biden ran more than 5 percentage points above his overall share in a few rural counties in northern Michigan, and also overperformed in some large suburban counties, notably Oakland in suburban Detroit and Ottawa directly west of Grand Rapids.
In Wisconsin, Biden was similarly under his overall share in the state’s most Democratic counties, Dane (Madison and the University of Wisconsin) and Milwaukee. Interestingly enough, a few counties in the northwest, which share a media market with the Twin Cities, were also orange on the map.
With states like Minnesota and Michigan in mind, it does seem that Biden’s relative weakness in some big city/campus areas does dovetail with some polling showing him with softness among some key Democratic constituencies (namely, young people and nonwhite voters).
Looking at the primary returns in their entirety, an open vs. closed primary contrast seemed to materialize. Though there were some exceptions, states where the pro-Biden coalition was most “rural” tended to have open primaries while the pro-Biden vote was more “urban” in closed primary states.
This rule holds true for the three Upper Midwest states that we mentioned earlier—Minnesota, Michigan, and Wisconsin all have open primaries. We would also point to our state, Virginia. Though Biden showed some weakness along the Appalachian Blue Ridge mountains, most of Northern Virginia’s large localities are orange.
Just to our southwest, in Tennessee, which is also open, Biden was under his statewide share in three of the state’s four most populous counties. The sole exception, Memphis’s Shelby County, has the largest Black population, a group that has been perhaps Biden’s most loyal bloc in the primary.
Closed primary states where Biden was especially weak in rural areas included Louisiana and Oklahoma. Both states are overwhelmingly Republican in general elections, but the former is still plurality-Democratic by registration, and Republicans only claimed a registration advantage in the latter less than a decade ago. So both states retain noticeable “ancestrally Democratic” blocs—these voters have no intention of backing Biden in the fall, and as registered Democrats, voted against him in the primary. In 2016, Bernie Sanders benefitted from this dynamic: as he lost the Louisiana primary by almost 50 points to Hillary Clinton, he carried La Salle and Cameron parishes, both of which are dark orange on Map 1. Sanders also ran well in the traditionally Democratic parts of rural Oklahoma where Biden was well under his statewide share this year.
Elsewhere, some predictable trends appeared regardless of primary format. In Maine, which is effectively closed, Biden was weakest in Obama-to-Trump Aroostook County and in Texas, which is open, the heavily Hispanic southern part of the state, which swung to Trump in 2020, has some of the darkest shades of orange on the map. Biden was under his statewide showing in much of rural west Texas, but we suspect these sparsely populated counties are just “noisy”—this is probably the case for much of western Kansas. The South Texas results, meanwhile, do seem to square with Biden’s relatively poor showing in the region in 2020 (Biden was unopposed in the Florida primary, so we don’t have any results there to assess Biden in South Florida, another heavily Hispanic area where Biden did much worse than Hillary Clinton had performed in 2016).
Finally, we would be remiss not to touch on the most recent primary, Pennsylvania, given its significance in the Electoral College. Though we did not include it on Map 1—as it voted only two days ago, we figured its results would still be a little in flux—Map 2 looks at both the closed Democratic and Republican primaries in the Keystone State based on the results from mid-day Wednesday (keep in mind that both maps exclude write-in votes, which are not yet available from a statewide source, so the inclusion of those votes could impact the maps, especially on the Democratic side).
Map 2: Biden and Trump’s relative performances in the 2024 Pennsylvania primary
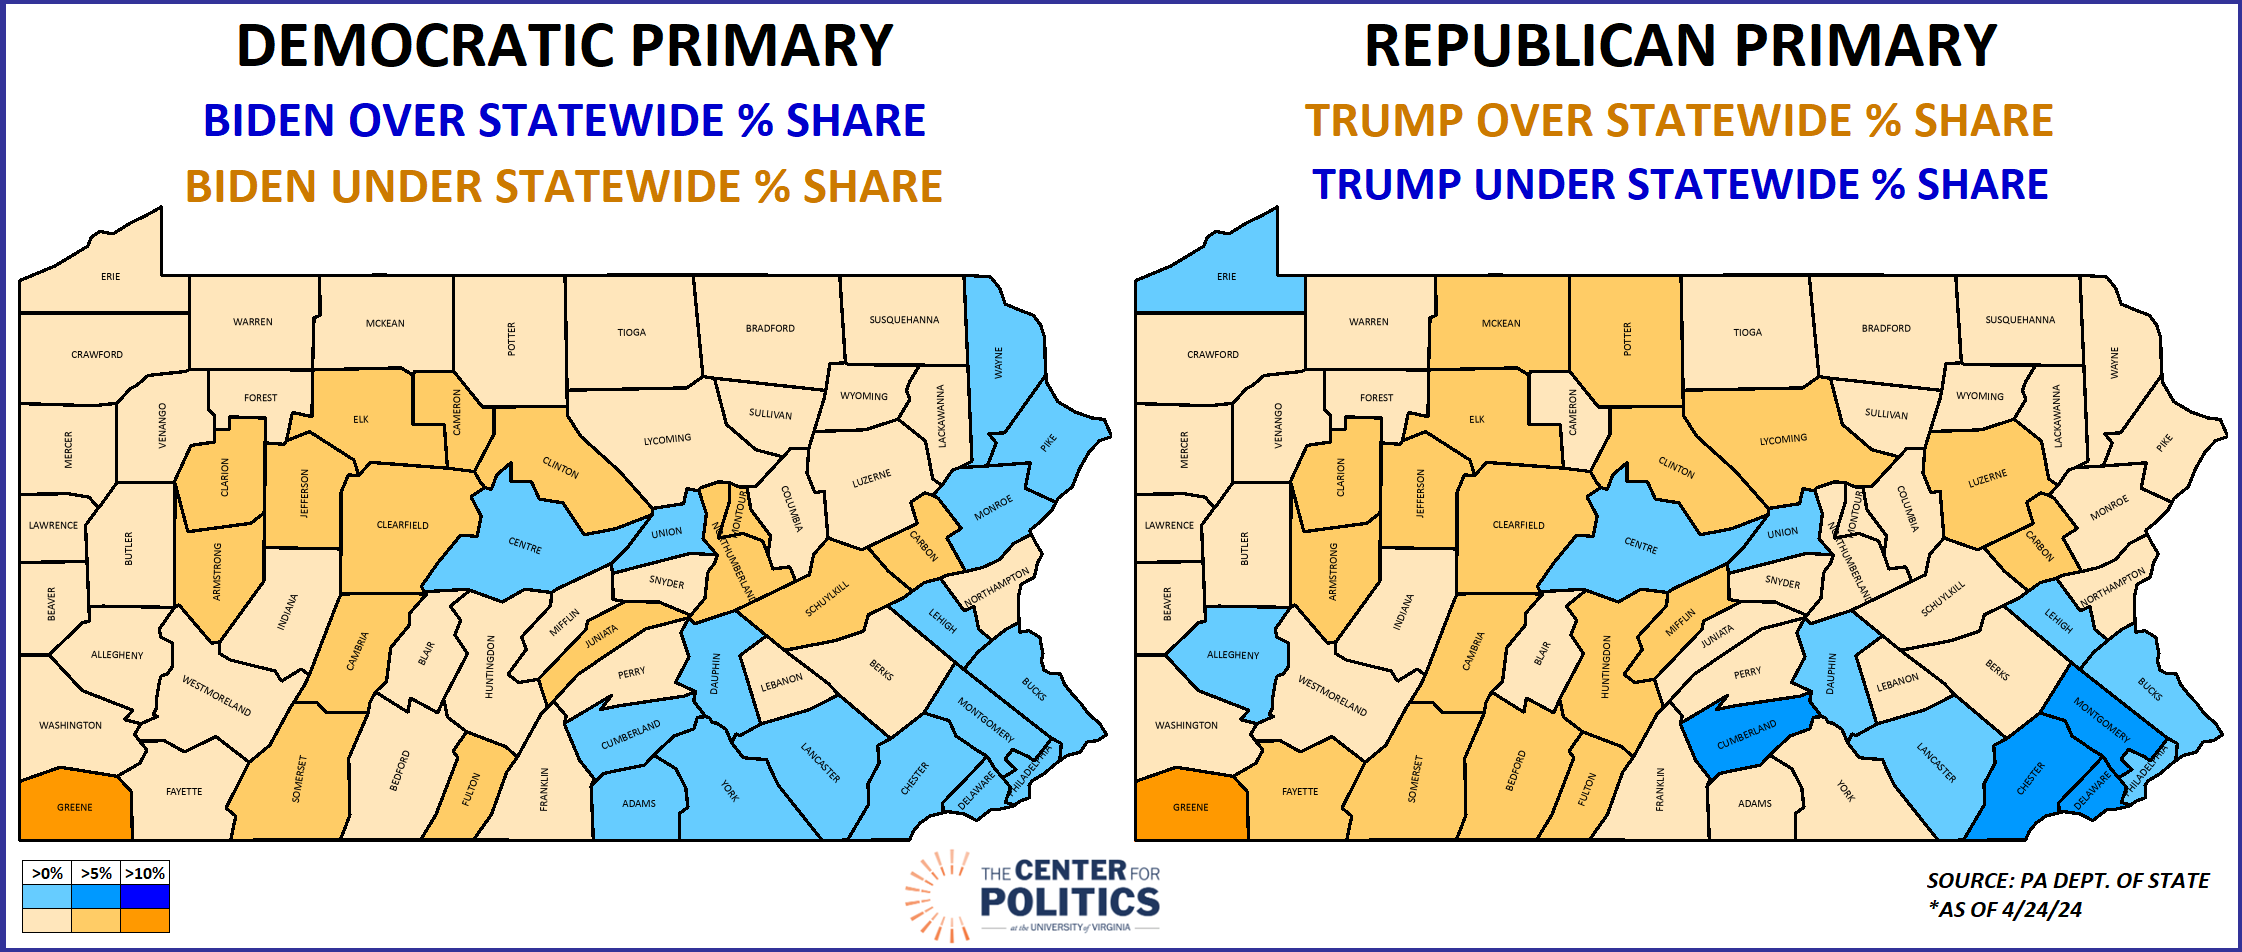
Not surprisingly, the two maps are nearly identical. As of yesterday, Greene County, a small county that makes up the southwestern corner of the state, was both Trump’s best and Biden’s worst county. Though it appears to have outstanding mail-in ballots, it may still retain its superlative status. Why? As with some of the examples from Louisiana and Oklahoma, this was a Democratic-leaning county in general elections until the early 2000s and likely still contains voters who are registered as Democrats—and thus participate in Democratic primaries—but vote as Republicans in general elections. Some other formerly-Democratic strongholds in the general vicinity that behaved similarly were Cambria and Fayette counties.
Meanwhile, the Philadelphia metro area and much of south-central Pennsylvania was relatively more pro-Biden and anti-Trump. Again, this basically mirrors some of the state’s longer-term general election shifts, and it’s also possible that there are “ancestral Republicans” in this part of the state who retain Republican registration but are functionally now Democrats in terms of general election voting. On a related note, yesterday, we moved PA-10, held by Republican Scott Perry, into a more competitive category. On the Republican map, Cumberland County, which is mostly in the 10th District, was Trump’s worst county outside of the Philadelphia Collar.
So what does all this mean going forward? Well, we’d emphasize that it would be hard to draw sweeping conclusions from such lopsided primaries. That said, in the general election, we wouldn’t be surprised if, using Pennsylvania as an example, Biden improves in the blue counties but loses ground in the orange ones (and vice versa for Trump).