KEY POINTS FROM THIS ARTICLE
— Despite a requirement that congressional districts have roughly identical populations within states, the number of raw votes cast in each district can vary widely, both within a state and across the country.
— In 2022, there was a nearly 300,000-vote difference between the lowest-turnout district (NY-15 in New York City) and the highest-turnout one (MI-1 in northern Michigan).
— Republicans won about two-thirds of the districts that cast the most votes (300,000 or more) while Democrats won about two-thirds of the districts that cast the fewest (less than 200,000).
The huge differences in House turnout
Over the years, voter turnout has often been measured in percentage terms — such as percentage of voting-age population (all U.S. residents 18 years of age and older), percentage of voting-eligible population (U.S. citizens only of legal age and who are eligible to vote), and percentage of registered voters.
But this look at voter turnout in 2022 takes a different tack. The measurement used here is the total number of ballots cast for the House of Representatives by congressional district (minus blank and void ballots). The U.S. House was the only office contested in 2022 in all 50 states. Using district-by-district votes allows a fairly simple way of comparing where people voted in 2022, and where they did not.
Since the Supreme Court in the 1960s mandated “one person, one vote” in congressional redistricting, districts within states have had to be as equal as possible in population at the time the lines are drawn early in the decade. While the “ideal” district size varies across states, in most states it’s somewhere between 700,000-800,000 people. But the turnout in these districts has still varied widely.
Last fall, nearly 107.7 million ballots were cast across the country for the House. Turnout ranged from a low of barely 90,000 in the New York 15th (represented by Democrat Ritchie Torres) to a high of nearly 390,000 in the Michigan 1st (represented by Republican Jack Bergman). That is a difference of nearly 300,000 votes from high to low. Nationally, the average turnout in 2022 was about 250,000 voters per district.
For the most part, the results confirmed the longstanding rule of thumb that Republicans tend to do better than the Democrats in high-turnout districts, many of them suburban and fairly affluent in nature, while Democrats tend to dominate in districts with low turnouts, often territory that is poorer, urban, and features a significant minority population. A caveat, though: Democrats have been steadily gaining ground in recent years in the suburbs as Republicans shed voters with their lurch to the right on cultural issues, from abortion to gun access.
Of the 91 districts where there was a high turnout in 2022 (measured here as more than 300,000 votes), 59 elected Republicans to the House. In contrast, of the 98 low-turnout districts (where the number of ballots cast fell below 200,000), 66 sent Democrats to Congress. Put another way, nearly two thirds of the high-turnout districts last fall sent Republicans to the House, and slightly more than two thirds of the low-turnout districts elected Democrats.
The rest of the districts were in a broad middle ground where between 200,000-300,000 votes were cast. Republicans held a modest edge there last fall, winning 129 House seats to the Democrats’ 115. (There were two other districts in 2022 where Republicans ran unopposed and no votes were cast.)
Table 1 shows the average people/voters per district based on categories such as total population and eligible voters. Table 2 categorizes these districts by party and region.
Table 1: Average population, eligible voters, and turnout by district
| In looking at voter turnout in the 2022 midterm elections, this article uses the district-by-district votes cast in House races across the country last fall and slices and dices the information into the material presented in this package of text and tables. Turnout rates, presented in percentage form — as a proportion of voting-age population (VAP), voting-eligible population (VEP), or registered voters — are the usual measurement of voter turnout. The actual district-by-district voting, though, offers another and hopefully simpler way of comparing where people voted in 2022, and where they did not. |
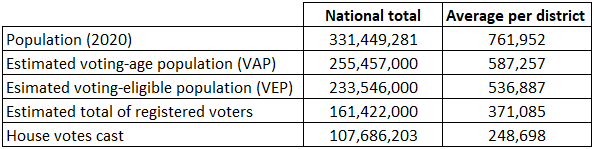
Note: The November 2022 House vote for all 435 districts (minus two districts in Florida and Louisiana where no vote was taken) was compiled by the author, who is responsible for what errors may lie within. Blank and void ballots are not included in the tallies, but write-in votes are.
Sources: The 2020 population totals are from the Census Bureau, as are the November 2022 estimated voting-age population (18 years and older), the estimated voting-eligible population (U.S. citizens only), and the estimated total of registered voters. Totals in all categories are based on nationwide tallies, including the District of Columbia, even though the latter does not have a voting representative in the House of Representatives. The “average per district” in all categories is based on 435 districts, except for the 2022 House vote, which is based on 433 districts. No congressional vote was recorded last fall in two districts.
Table 2: 2022 House turnout using actual vote by districts
| It has been a general rule of thumb concerning voter turnout that Republicans tend to run better in higher turnout districts, often in fairly affluent suburbs, while Democrats tend to dominate in lower turnout districts, many with a high minority population. That was largely the case again in 2022 in contests for the House of Representatives. The GOP won about twice as many high-turnout districts last year (measured here as more than 300,000 total ballots cast) than the Democrats (59 to 32), while the Democrats carried more than twice as many low-turnout districts (less than 200,000 total ballots cast) than the Republicans (66 to 32). The rest of the districts were in the broad middle, with a turnout of 200,000-300,000. Regionally, the West and the South had the largest proportion of low-turnout districts in 2022, while the Midwest posted the largest share of high-turnout districts. |
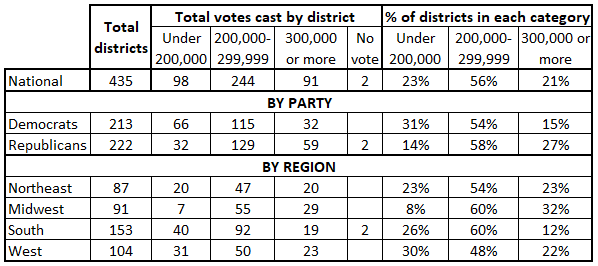
Notes: Turnouts by congressional district in 2022 are based on total votes cast, including write-ins but not void or blank ballots. Two Southern districts where there was no opposition to the winner and no vote was taken (the Florida 5th and the Louisiana 4th) are included in the total number of districts. As a result, the percentages for the South and for Republicans in general do not add to 100. The regions cited in this article include the following states:
Northeast (12 states): Connecticut, Delaware, Maine, Maryland, Massachusetts, New Hampshire, New Jersey, New York, Pennsylvania, Rhode Island, Vermont, West Virginia.
Midwest (12 states): Illinois, Indiana, Iowa, Kansas, Michigan, Minnesota, Missouri, Nebraska, North Dakota, Ohio, South Dakota, Wisconsin.
South (13 states): Alabama, Arkansas, Georgia, Florida, Kentucky, Louisiana, Mississippi, North Carolina, Oklahoma, South Carolina, Tennessee, Texas, Virginia.
West (13 states): Alaska, Arizona, California, Colorado, Hawaii, Idaho, Montana, Nevada, New Mexico, Oregon, Utah, Washington, Wyoming.
Source: Official 2022 House election results as posted on state election websites and compiled nationally and in categories by the author.
The highs and the lows
At first glance, it would appear that the partisan difference between high and low turnout districts would give the GOP a pronounced advantage in state-level races for offices such as president, governor, and U.S. Senate. But that is often not the case. Low turnout districts frequently produce large pluralities for the Democrats that rival in size the pluralities for the winners in more competitive higher turnout districts. Case in point: the average margin of victory for the victorious candidate in the 25 highest-turnout districts in 2022 was 22 percentage points; the average winning margin in the 25 lowest-turnout districts was 34 points.
In addition, Democrats over the years have been making steady inroads in high-turnout metro districts from Philadelphia to Phoenix, as well as holding firm in liberal bastions such as Boulder, CO, Madison, WI, and Seattle, WA, where voters indeed turn out to vote.
Democratic representatives from vote-rich constituencies in 2022 included Debbie Dingell, who represents Ann Arbor and parts of metro Detroit, Elissa Slotkin, who has a marginal Lansing-area seat (Slotkin has already announced her Senate candidacy for 2024), Joe Neguse from Boulder (who served on the panel of House Democrats arguing Trump’s guilt in the Jan. 6-related impeachment trial in the Senate), and Pramila Jayapal of Seattle (the chair of the House Progressive Caucus who was recently in the news for controversial comments about Israel). Turnout in all of these elections last year exceeded 338,000 votes.
Table 3: 25 highest-turnout 2022 House districts
| Voter turnout for the 2020 presidential election surpassed a record 158 million ballots, and reached 152.6 million for the House of Representatives. That resulted in 100 House elections that year posting turnouts in excess of 400,000, an extraordinarily high number of votes cast. In 2022, though, the nationwide House vote fell short of 110 million, and no districts reached a turnout of 400,000. While there were far more Republican than Democratic districts last fall where turnout exceeded 300,000, the 25 districts with the highest turnouts split nearly evenly between the two parties — 13 won by Republican House candidates, 12 by Democrats. The nine highest-turnout districts in 2022 were all located in Pennsylvania, Michigan, and Wisconsin, states with lively gubernatorial races, and in the case of Pennsylvania and Wisconsin, competitive Senate contests as well. Michigan, though lacking a Senate race, had a closely-watched statewide ballot issue that enshrined abortion rights into the state’s constitution. |
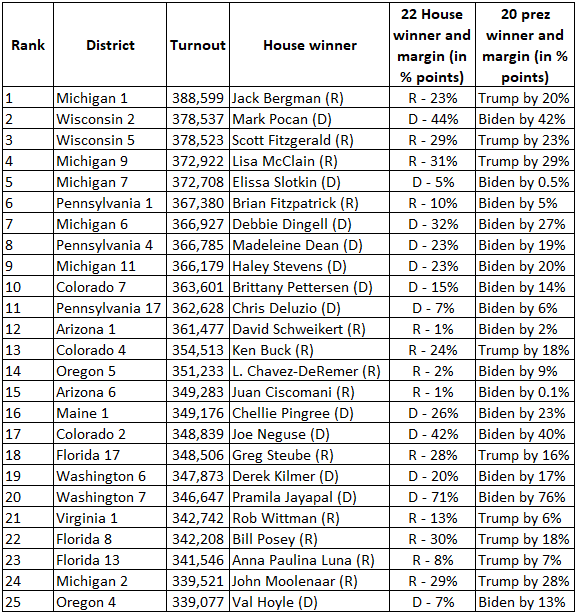
Note: Turnouts by congressional district in 2022 are based on total votes cast, including write-ins but not void or blank ballots.
Sources: Official 2022 House election results as posted on state election web sites, and computed and arranged into categories by the author. The 2020 presidential vote was compiled by Daily Kos Elections and reflects results from reconfigured congressional districts used for the first time in 2022.
Meanwhile, districts with the lowest turnouts last November elected some of the most famous and powerful Democratic members of the House. Alexandria Ocasio-Cortez, arguably the body’s most outspoken progressive, represents a New York City district that had the sixth-lowest number of House votes cast in 2022. Elsewhere in the city, new Democratic House Minority Leader Hakeem Jeffries won reelection in a district with the nation’s 23rd-lowest turnout. Across the country, new House Democratic Caucus Chairman Pete Aguilar took a Southern California district with the 17th-lowest number of total congressional ballots cast last fall.
And not too far to the north of Aguilar’s district, embattled Republican David Valadao won reelection by just 3 percentage points in a district with the third-lowest turnout in 2022. Valadao had irritated many Trump supporters by voting for his 2021 impeachment. Yet of the 10 House Republicans who did so, Valadao was only one of two who survived at the ballot box in 2022; Dan Newhouse of Washington was the other. Voter turnout in these races won by Aguilar, Jeffries, Ocasio-Cortez, and Valadao consistently fell below 140,000 votes.
Table 4: 25 lowest-turnout 2022 House districts
| Of the 25 congressional districts with the fewest number of House ballots cast in 2022, all were carried comfortably by Joe Biden in the 2020 presidential election, and all but two were won by House Democrats in 2022. Most of the lowest-turnout House districts last year were clustered in Southern California and the New York City area, both urban-oriented parts of the country with large minority populations. The latter includes the home bases of the new Democratic House Minority leader, Hakeem Jeffries, as well as the chamber’s most famous progressive, Alexandria Ocasio-Cortez. Meanwhile, new House Democratic Caucus Chairman Pete Aguilar represents one of the lowest-turnout districts on the “Left Coast.” |
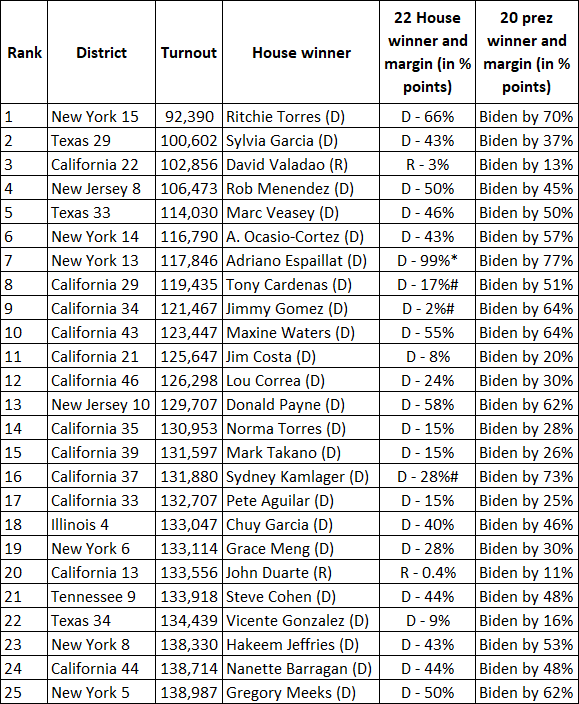
Note: An asterisk (*) indicates candidate had no major party opposition in 2022. A pound sign (#) denotes that the election was decided in a general election that featured two Democrats.
Source: Same as Table 3.
A nation of turnout differences
One of the most significant events in the history of House elections came in 1962, when the progressive Earl Warren-led court issued a decision that opened the door to the principle of “one person, one vote” being applied to congressional redistricting. The Supreme Court ruling was known as Baker v. Carr, and it was accompanied by subsequent, significant legal cases that changed the basic rules of district line-drawing. Before these actions, House districts could be of unequal population within a state, allowing for lightly populated rural districts to coexist with heavily populated urban districts.
After Baker v. Carr, districts within each state had to be as equal in population as humanly possible. In some cases, maps would be thrown out by the courts when the population variance between districts might be only a handful of people.
At first, both parties tended to extensively practice “incumbent protection,” carving out districts to ensure the political safety of their sitting House members. But as politics has become more conflictual and less accommodating, redistricting became more heavy-handed, with the dominant party within a state often pushing through maps that accentuated their strength. This “partisan gerrymandering” has resulted in districts that are virtually equal in population but contorted in shape. And they have done nothing to create constituencies that are anywhere close to equal in voter turnout.
Districts within a state are never more equal in population than immediately after they are redrawn, as was the case in 2022. Still, the difference between the highest and lowest turnout districts within a state last fall surpassed 200,000 voters in Arizona, California, New Jersey, New York, and Texas and fell between 150,000 and 200,000 voters in Florida, Illinois, Massachusetts, Michigan, and Pennsylvania. The closest to turnout equality came in two small states, New Hampshire (two districts) and Nebraska (three districts), with the turnout difference less than 4,000 votes in each state between the highest and lowest districts.
The geography of turnout
Where people voted
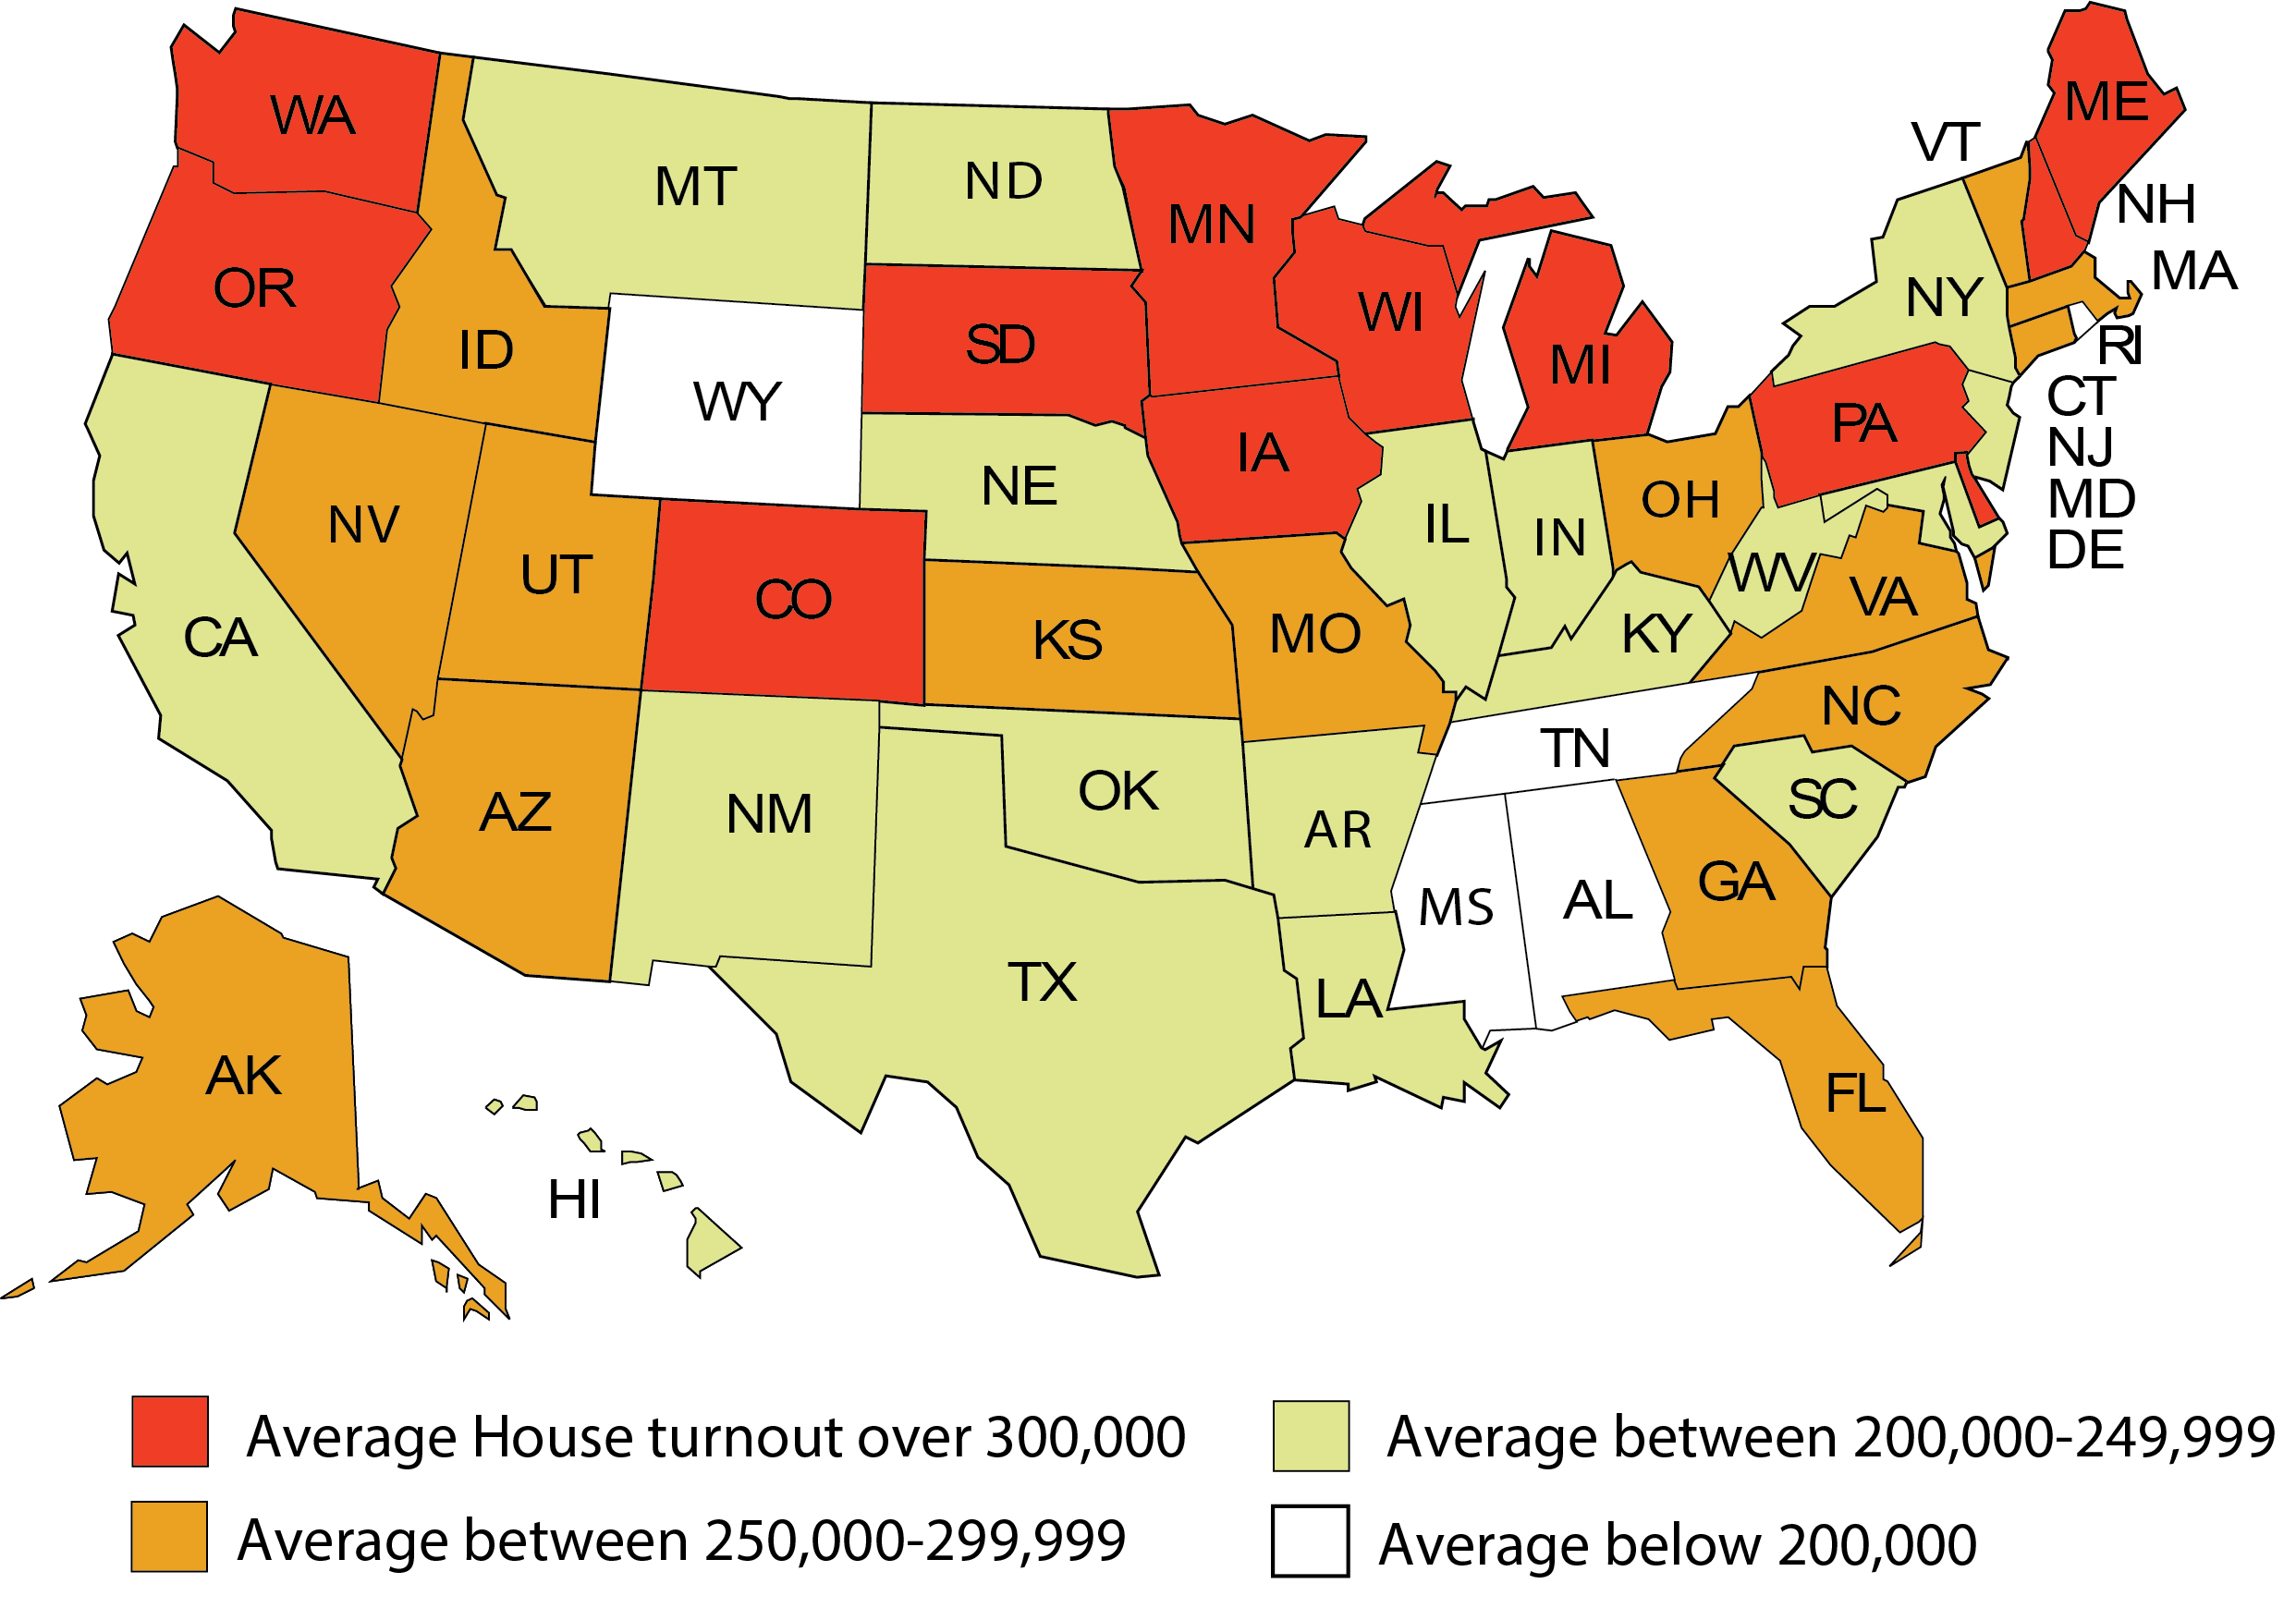
The highest-turnout states in 2022 lay across the Frost Belt, from Maine to the Pacific Northwest. In Michigan, 11 of the state’s 13 districts registered congressional vote totals in excess of 300,000; in Pennsylvania, it was 11 of 17; in Wisconsin, 6 of 8; in Minnesota, 5 of 8; in Colorado, 4 of 8; in Oregon, 5 of 6; and in Washington, 6 of 10. All of these states featured at least a statewide race for governor or Senate, and in many cases in 2022, both high-profile offices were on the ballot together. The presence of these contests no doubt helped to swell the vote in House races. So too did the basic demographics of these states, fairly affluent and well-educated, generally a combination that produces high voter turnout.
And where they didn’t
As for the other end of the turnout spectrum, the lowest turnout districts last fall were found in large numbers across the Sun Belt, from the Deep South west to California, plus a cluster of states in the Northeast anchored by New York and New Jersey. In these separate swaths of America, there was a large representation of districts where less than 200,000 votes were cast in 2022. Populations in many of these Sun Belt states tended to be racially diverse and lacked a tradition of high turnouts; as of 2019, California, Texas, Nevada, New Mexico, and Hawaii had populations that were majority minority, or less than 50% non-Hispanic white. (Maryland was the only other state in the country with similar status.) Remember, too, that House districts are apportioned by total population that does not take into account eligibility to vote (such as whether a person is a citizen). So districts that have a lot of newer immigrants/people who are not citizens may naturally produce a lower total of votes.
Ground zero for low turnout last year was in the heart of the South. The number of ballots tallied fell below 200,000 in 6 of the 9 districts in Tennessee, 6 of 7 in Alabama, and all 4 districts in Mississippi. Nearly half of the districts in a number of populous states also had turnouts that scraped the bottom of the list. In California, 25 of 52 districts had sub-200,000 vote turnouts. In Texas, it was 18 of 38; in New York, 10 of 26; and in New Jersey, 5 of the state’s 12 districts. California and New York both had gubernatorial and Senate races, but other than the unexpectedly competitive governor’s race in the Empire State involving the newly elevated Democrat, Kathy Hochul (who replaced Andrew Cuomo in 2021), the high-profile contests apparently did little to spur voter turnout in congressional elections.
Map 1 and Table 5: States ranked by average 2022 House ballots cast per district
| The populations of congressional districts around the country are never more equal than in election years that end with the number “2.” They are the first national election each decade after the new census figures reapportion each state’s number of seats, and new district lines are drawn within each state to create population equality between its districts. Still, there are wide variations in the district-by-district turnouts, which was reflected in 2022 in dramatic fashion. States with the highest average vote per district last fall were largely in the northern part of the country from Maine and New Hampshire to Oregon and Washington, with Michigan, Minnesota, and Wisconsin among the high turnout states in between. Among those states with the lowest average turnout were some of the nation’s most populous, including New York, New Jersey, Texas, and California. |
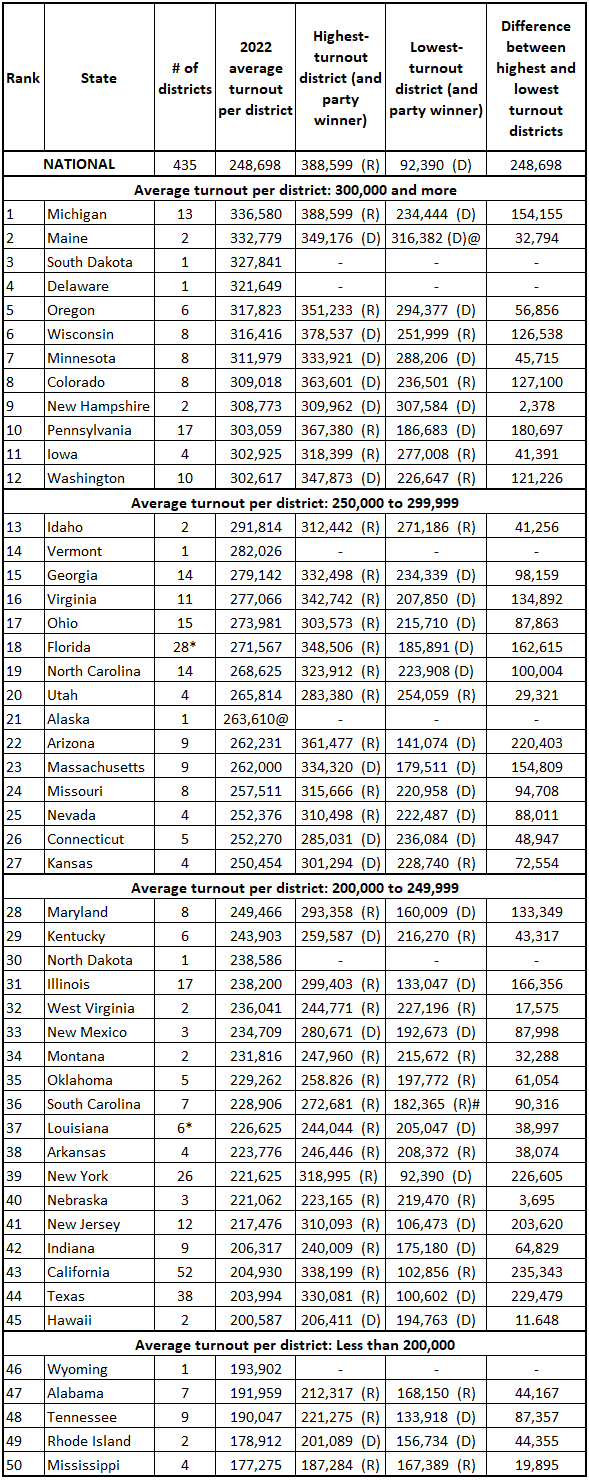
Note: A dash (-) indicates a single-member state with no highest or lowest congressional district per se. An asterisk (*) indicates there was no House vote tallied in 2022 in one district in Florida and one in Louisiana. In each of those states, the total number of districts are reduced by one to obtain the average turnout by congressional district. The icon “@” denotes that in the Alaska at-large and Maine 2nd districts, the number of House ballots cast is based on the initial tally before ranked-choice voting was employed to determine a winner.
Sources: Official 2022 House election results as posted on state election websites, and computed and arranged into categories by the author. The 2020 presidential vote by congressional district was compiled by Daily Kos Elections and reflects results from the reconfigured congressional districts used for the first time in 2022.
2024: Shades of 2020?
While a handful of states — such as Alabama, Louisiana, North Carolina, New York, Ohio, and perhaps others — may have new congressional district lines next year, the vast majority of states will have the exact same lines as they did in 2024. The main difference will be in the volume of voters. Turnout for presidential elections is much higher than for midterms. In 2022, for instance, there was not a single district where the number of ballots cast exceeded 400,000. In 2020, there were 100 such districts, which represented nearly one out of every four nationally. The 400,000-vote plus districts were found in 30 states and split about evenly in partisan terms, with 52 electing Republicans to the House and 48 selecting Democrats.
Altogether, there were about 152.6 million votes cast for the House of Representatives in 2020, fully 40% more than in 2022. Presidential elections tend to attract more marginal voters who are drawn to the polls every four years only by the race for president. These voters can be unpredictable but often skew Democratic, helping the party to win the popular vote in seven of the last eight presidential elections.
On the other hand, Republicans dominate most of the state legislatures nowadays and in many, congressional district lines have been crafted favorably to the GOP. In addition, since 2020 some Republican governors and legislatures — including those in Arizona, Florida, Georgia, and Texas — have scaled back early and absentee balloting, a method of voting that Democrats capitalized on in the pandemic-influenced election three years ago. Democrats have denounced the changes since then as “voter suppression.” Republicans hail them as providing “election integrity.”
But it is a long time until the 2024 election, and the political winds could blow back and forth a number of times before it is apparent which party they favor. Ultimately, it is possible that next year’s presidential campaign could be the most volatile in decades. Yet in the end, it will be decided, as elections always are, by who votes and who doesn’t.
| Rhodes Cook was a political reporter for Congressional Quarterly for more than two decades and is a senior columnist at Sabato’s Crystal Ball. He also publishes The Rhodes Cook Letter, a newsletter that focuses on electoral politics. |