KEY POINTS FROM THIS ARTICLE
— This article updates and applies the seats-in-trouble congressional election forecasting equations to the 2022 midterm elections.
— The goal is to use micro level (congressional district and state) competitiveness assessments in combination with their electoral history to statistically generate an accurate prediction of the election’s national outcome.
— The seats-in-trouble forecasts for the 2022 midterms are losses for the Democrats of 42 seats in the House of Representatives and 1 seat in the Senate.
The seats-in-trouble forecasts
With Americans bitterly polarized, the parties within a few seats of each other in the House, and the Senate evenly split, the 2022 midterm election is already one of the most contentious in American history. Across the ideological spectrum, Americans nervously await November’s collective verdict. This article attempts to provide some insight into what that verdict will be with the hope that it can be anticipated and more calmly accepted. Okay, you are right, that is not going to happen — but we can hope.
The basis for insight into the midterm is the seats-in-trouble congressional forecasting equations, a pair of hybrid statistical models predicting national party seat change in House and Senate elections. They are “hybrid” in that they combine the intensive assessments of individual House and Senate contests by independent expert analysts with a statistical analysis of historical partisan seat change data.
Unlike conventional aggregate models using purely national indicators, the seats-in-trouble equations are based on competitiveness ratings of individual elections produced by the venerable Cook Political Report. Cook’s race by race ratings take various local conditions (the candidates, local issues, how national issues are playing locally, and redistricting) into account as well as how national conditions (like presidential approval and the economy) are distributed across local and state elections.[1] And unlike national impressions of likely party seat change pieced together from district by district ratings, the seats-in-trouble model systematically aggregates those pieces of the national puzzle into indices and statistically estimates how those indices have been associated historically with actual election outcomes. The result is an accurate, historically grounded, simple, and systematic forecasting model of national congressional election outcomes (the macro perspective) based on intensive examinations of individual election contests (the micro perspective).
The seats-in-trouble model builds on the seat exposure idea explored by Bruce Oppenheimer, James Stimson, and Richard Waterman several decades ago and similar notions examined by others who recognized a basic fact of electoral change arithmetic: you can’t lose what you don’t have and you are more likely to lose a lot if you have a lot to lose. The seats-in-trouble model takes this idea to the next level. To get a better idea of whether a party is going to suffer heavy or light losses in an election, it helps to know how many of its seats are safely held and how many are tenuously held. It stands to reason that if many of a party’s seats are vulnerable, there is a greater chance they will lose more of them.
The seats-in-trouble forecast model’s purpose is purely prediction, but the model is consistent with prevailing electoral theories. The many influences on vote choices also influence ratings of individual congressional races: partisan predispositions, evaluations of the president’s record on important issues (the economy, immigration, crime, and so forth), reactions to the parties’ ideological perspectives, and confidence (or the lack thereof) in the parties’ leaders and candidates. Assessments of individual races take into account the distribution of these influences across congressional districts and states — a key sensitivity missing from forecast models based exclusively on national indicators (like presidential approval ratings, generic ballot polling, and economic growth rates).
The micro foundation of the seats-in-trouble forecast
The forecast equations are constructed from the competitiveness ratings of individual district or state races as determined by The Cook Political Report, now The Cook Political Report with Amy Walter. Since the mid-1980s, Charlie Cook and his colleagues have reported pre-election ratings of the competitiveness of individual congressional elections. Initially released in newsletters to subscribers, since at least 2008 they have been publicly posted on The Cook Political Report’s website. Based on careful analysis of a wide range of information, their analysts classify each congressional contest in 1 of 8 categories, 4 for each party’s pre-election seat holdings: solid, likely, or leaning “holds” for the Democrats along with their “toss-up” seats, and the same 4 ratings for seats held before the election by Republicans. The seats-in-trouble index distills these individual district or state (Senate) ratings into a national measure of party competitiveness.
Cook’s competitiveness ratings have a strong track record, which I explored in an earlier report on the seats-in-trouble model. I evaluated the individual outcomes in each of the rating categories in House elections and found the expected order of successful election rates for the party holding the seat before the election. The distribution of individual races (6,466 contests) in the 15 election years examined, as one would expect, heavily skewed toward the “safe” rating category: 74% safe, 12% likely, 9% leaning, and 6% toss-ups. The parties won nearly all of their “safe” (a mean of 99.8%) or “likely” to be held seats (means of 93% for Democrats and 96% for Republicans). Those “leaning” for their current party were more often “held” than not (means of 81% for Democrats and 86% for Republicans), but at rates significantly below the “safe” or “likely” rates and without the same consistency from year to year. Toss-up seats were just that. Democrats on average won 40% of their toss-ups and Republicans won 55% of theirs. As expected, the toss-up “hold” rates varied a great deal from one election to another. Overall, the ratings deserve very high marks and provide strong “micro” data on which to form national “macro” forecast indices for forecast equations. A similarly commendable quality is assumed for their Senate ratings.
From the ratings to an index to a forecast
With all the painstakingly researched assessments of congressional races in hand, 2 questions remain in constructing the forecast equations: (A) how should the ratings data be combined into a single national index or perhaps into multiple indices of a party’s overall competitive status in an election year and (B) what additional contextual variables might be included to improve the accuracy of the forecasts?
Since first devised for the 2010 House midterm election, I have experimented with plausible versions of the indices and equation specifications, using different cut-points for counting categories of seats as being “in trouble” (e.g., leaning or worse) and including additional predictor variables in the forecast equation (e.g., presidential approval, current number of seats held). While these variations may be useful in gauging the robustness of the forecasts, the most accurate forecasts are produced in a single predictor equation using a very simple index — the net number of a party’s seats rated as Toss-ups or worse. That is, for a 2-party analysis oriented for the Democratic Party, the seats-in-trouble index is calculated as the number of currently-held Democratic seats rated as toss-ups or are leaning, likely, or safe Republican minus a similar count for Republicans (toss-ups, or leaning, likely, or safe for Democrats). This index is expected to be negatively associated with the predicted variable (net seat change for the Democrats). The more seats in trouble compared to the opposite party, the more seats a party should be expected to lose.
Table 1 presents the net seats-in-trouble index values for the 18 national House elections for which ratings data were originally reported, the 2-party components of the index (the number of Democratic and Republican “toss-ups or worse”) and the associated net national seat change for these elections (computed from the official reported outcome of previous election year). To produce a forecast with a meaningful lead time before the election, a mid-August target was set to determine which release of Cook’s rolling updated releases of ratings were used. Since the release of ratings were not on a regular schedule, ratings used in some years were a bit earlier or later than mid-August. The 1986 and 1990 elections are excluded because ratings were not reported close enough to the mid-August target date. Timely data were available to calculate the seats-in-trouble index for 17 national elections through 2020. The dates of the reports used are included in the table’s note.
Table 1: The seats-in-trouble index of national party competitiveness in House elections, 1984-2022
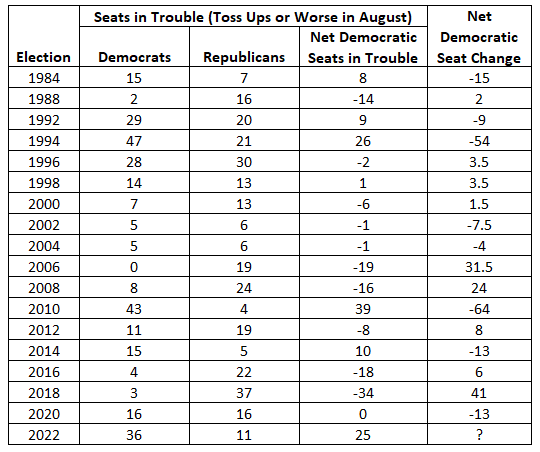
Note: The dates of the Cook Political Report used to calculate the number of seats in trouble in the parties are: 1984, 7/31; 1988, 8/17; 1992, 7/24; 1994, 8/19; 1996, 8/28; 1998, 8/28; 2000, 8/9; 2002, 8/7; 2004, 8/20; 2006, 9/1; 2008, 8/30; 2010, 8/17; 2012, 8/16; 2014, 8/14; 2016, 8/10; 2018, 8/17; 2020, 8/21; and 2022, 8/10. Half-seats in the seat change column reflect the election or departure from the House of independents — representatives unaffiliated with either the Democratic Party or the Republican Party.
The index values have a very broad range. The most unfavorable number of toss-ups or worse for Democrats was in 2010 (Barack Obama’s first midterm), when they had 39 more threatened seats than Republicans. The most unfavorable Republican year was 2018, when they had 34 more seats in trouble than the Democrats. As the far right column of actual seat change indicates, these elections were also each party’s worst showings in this series. Also, as the far right column indicates, actual seat change in these elections had an even broader range than the index, from a Democratic Party loss of 64 seats in 2010 to a gain of 41 seats in 2018.
Although the substantial differences between seats in trouble (the negative of) and seat change might leave a false impression that the index is not strongly associated with actual seat change, the plot in Figure 1 of August’s seats-in-trouble index against November’s election seat change is striking. Over the 17 pre-2022 elections in Table 1, the correlation between the seats-in-trouble index and the seat change produced more than 2 months later by the election is extraordinarily strong (r = .95). Since a few close calls in the ratings and a few late breaks in a few campaigns will always add some noise between an election predictor and the election’s outcome, this is a far stronger statistical relationship than one could reasonably expect.
Figure 1: Seats-in-trouble and seat change in House elections
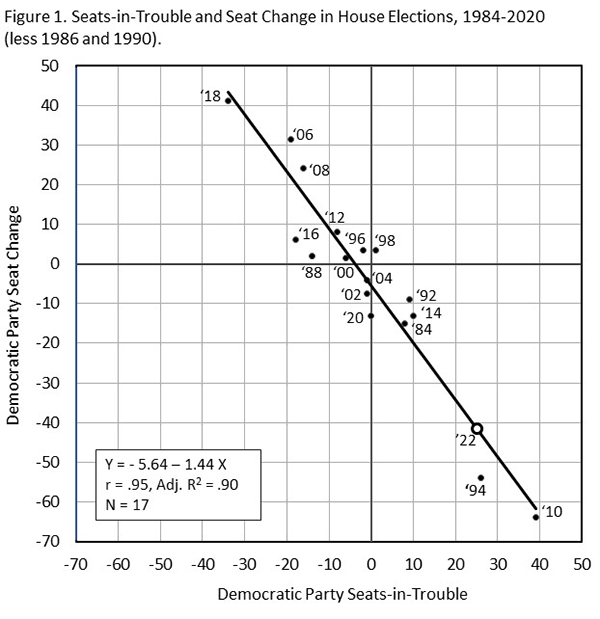
The displayed data plot in Figure 1 is presented in statistical terms in the regression estimated forecast equation (Equation 1) in Table 2. The regression explains the discrepancy between the seats-in-trouble index and the election results. The index is strongly related to the election outcomes, but not in an entirely party-neutral way (a constant of 0) and not on a literal one-to-one basis (a slope of 1). That is, every additional seat of a party’s that is classified as a toss-up or worse does not translate into 1 additional seat lost. It generally translates into more than 1 additional seat lost. The conversion rate is not 1 vulnerable seat to 1 seat lost, but 1 vulnerable seat to 1.44 lost. Cast in a more real world metric, every 10 additional seats in trouble for a party in August has generally been associated with a loss of 14 or 15 seats in November.
Table 2: The seats-in-trouble 2022 forecasting equations of Democratic Party seat change in the U.S. House of Representatives, 1984-2020
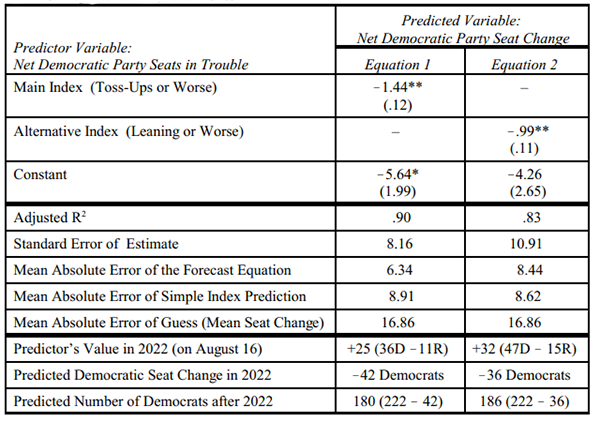
Notes: N=17. **p<.01, one-tailed. *p<.02, two-tailed. Standard errors are in parentheses. The equations are estimated using data from 1984, 1988, and the 15 national elections from 1992 to 2020. The seats in trouble count are from the Cook Political Report in or around mid-August of the election year. Reports in this time frame were not available for 1986 and 1990. The mean absolute error of the forecast equation are within sample estimates. The 2022 reading of the Cook Report with Amy Walter was of Aug. 16, 2022.
Equation 1 also indicates a second reason the seats-in-trouble index interpreted literally as a forecast differs from the actual extent of seat change. The equation’s constant (−5.64 and statistically significant) indicates a bit of a pro-Democratic Party tilt, between 5 and 6 seats. At an index value of zero, the election-based equation indicates Democrats still should expect to lose 5 or 6 seats. Put differently, if the ratings used to calculate the index increased the net count of vulnerable Democrats in each election by about 5 or 6 seats, the regression line in Figure 1 would be shifted upward and run through the politically neutral point where the two axes intersect (a constant of 0).
There are many plausible reasons why the conversion slope is greater in absolute magnitude than a one-to-one conversion as well as why there is a pro-Democratic tilt to the ratings on which the index is based. Analysts may be overly wary of rating more partisan races as toss-ups or those more solidly partisan districts may flip later in the campaign season than more normally competitive districts. The favorable tilt of the news media or local polls toward Democrats may affect how races are perceived. Whatever the reason(s), the difference in accuracy between a simple literal reading of the ratings and the historical forecast regression corrected reading of the ratings is worth noting.
As a result of the regression estimated equation taking the greater conversion rate (ratings index translated to actual change) and the tilt of the index into account, predictions calculated from the forecast equation are significantly more accurate than employing the index value directly as a forecast. The forecast regression error is, on average, about 30% smaller (6.3 points vs. 8.9 points) than a simple or literal forecast that seat losses would simply be the negative of the net number of seats rated as “toss-ups or worse.”
Equation 2 in Table 2 examines an alternative seats-in-trouble measure casting a broader net of seats vulnerable to being won by the opposite party. Rather than limiting the count of seats in trouble to “toss-ups or worse,” the alternative measure adds to the count seats rated as “leaning” to a “hold.” Overall, the “toss ups or worse” count of Equation 1 fares better than the “leaning or worse” count of seats in trouble (indicated by comparisons of proportions of variance “explained,” standard error of estimates, and mean absolute errors). Equation 2, however, does support a simple rule. A good guess of the extent of seat change in a House election is the net number of seats leaning or worse for a party (then shaving about another 4 seats from the Democrats) — not as accurate as a forecast from Equation 1, but much better than the loose conjecture often thrown around or random impressionistic guesses.
The Seats-in-Trouble Senate forecast model
The seats-in-trouble model is updated and applied to Senate elections in Table 3. With the exception of 1984 for which there were no Senate ratings near the mid-August target date, the Senate analysis uses the same elections and “toss-up or worse” criteria used in the House equation. The Senate seats-in-trouble index ranged from 8 fewer Democratic seats in trouble in 2008 to 6 more Democratic seats in trouble in 1994.
Table 3: The seats-in-trouble 2022 forecasting equation of Democratic Party seat change in the U.S. Senate, 1988-2020
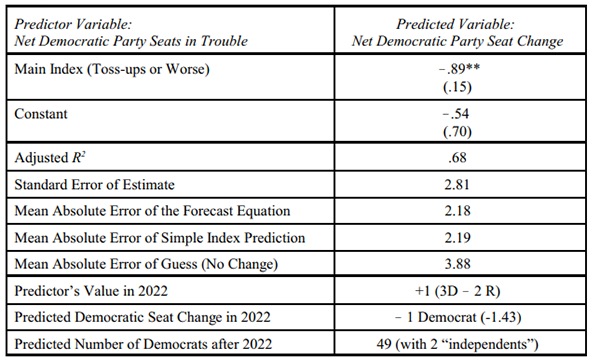
Note: N= 16. **p<.01, one-tailed. Standard errors are in parentheses. The seats in trouble count are from the Cook Political Report in or just before mid-August of the election year. Reports in this time frame were not available for Senate elections prior to 1988. They were also not available in 1990. The equations are estimated using data from 1988 and the 15 national elections (on-years and midterms) from 1992 to 2020. The seats-in-trouble index used in Senate forecasts counts a party’s seat as vulnerable if it is rated by the late summer Cook Political Report a toss-up or worse for the party currently holding the seat. The 2022 reading was of The Cook Report with Amy Walter as of Aug. 16, 2022.
The Senate version of the seats-in-trouble appears to make more of a contribution to forecasting Senate electoral change than it really does. Although the percentage of explained variance on first blush looks respectable (adj. R2 =.68), there is little difference between the equation’s optimized regression coefficients and simply using the unprocessed net “toss-ups or worse” index value (its negative) to predict Senate seat change. The conversion rate (-.89) is similar (within the usual range of the Senate index) to the implicit rate of a literal index forecast (-1.0) and the “tilt” of the forecast reflected in the constant is not significantly different from zero. In short, the historical-based regression analysis forecast is generally fairly close to the prediction that a party will gain (or lose) as many seats as the negative of its net seats-in-trouble index (net toss-ups or worse). The mean absolute errors of the regression estimates and the raw index predictions highlight their near equality. With either, the Senate forecast will be about 2 Senate seats off, on average, and either cuts the average error of a blind guess without the competitiveness ratings nearly in half (about 3.9 vs 2.2).
The 2022 House and Senate forecasts
Based on the seats-in-trouble House and Senate forecasting equations, what should we expect from the 2022 congressional midterm elections? As of Aug. 16, 2022, the Cook Political Report classified 183 Democratic held seats as safe, likely, or leaning in favor of being held by the Democrats. The Report rated 26 Democratic seats as toss-ups, 6 as leaning to the Republicans, and 4 likely to go to the Republicans. Combined, 36 seats currently held by Democrats were rated as “toss ups or worse.” On the Republican side, 188 seats were considered safe, 11 likely “holds,” and 5 leaning Republican. A total of 11 Republican seats were rated in trouble: 8 toss-ups and 3 leaning to the Democrats. The net difference was +25 (36 Democrat seats in trouble minus 11 Republican seats in trouble). A count from a similar rating by Sabato’s Crystal Ball on Aug. 16, 2022 (+26 more Democrats in trouble) is very much in accord with Cook’s count.
By the seats-in-trouble index of toss-ups or worse, House Democrats since 1984 have only been in worse shape in 2 elections: 1994 and 2010. With President Biden’s presidential job approval rating through July at only 38% and only 13% of Americans satisfied “with the way things are going in the United States at this time,” it would be odd if a great many Democratic seats were not in trouble. The election most comparable to 2022 in terms of the large number of vulnerable Democratic seats is the 1994 midterm. Vulnerable Democrats that year outnumbered threatened Republicans by 26 seats, just 1 more than this year. That election, 1994, was the breakthrough year for Republicans and they gained 54 seats and their first majority since the 1950s.
With 25 more seats in trouble than Republicans, if the 2022 election runs historically true to form as the seats-in-trouble forecast presumes (eq. 1 in Table 2), Democrats are looking at a net loss of 42 seats. Figure 1 depicts the anticipated big Democratic loss on its regression line. The predicted 42 seat gain for Republicans would leave Democrats with 180 seats and give Republicans control of the House with 255 seats. This would shatter the Republican’s 247 seat ceiling, the most House seats won by Republicans since the 1928 election, 94 years ago. The outlook of the weaker alternative seats-in-trouble index (eq. 2 in Table 2), adding leaning seats as vulnerable, is for Democrats to lose 36 seats with a House division of 249 Republicans to 186 Democrats. Using the ratings as of Sept. 7 (Democrats +23 “toss-ups or worse” and +30 “leaning or worse”) reduces predicted Democratic seat losses by only 2 or 3 seats (-39 for equation 1 and -34 for equation 2).
The election’s predicted outcome looks much tighter on the Senate side, in no small part to the greater number of Republican seats up for election (21 Republicans to 14 Democrats). Republicans have fewer targets of opportunity for gains and many of them are safely in Democratic majority states (e.g., California, Connecticut, Illinois, Maryland, New York, and Vermont). As of Aug. 16, 2022, Cook rated as toss-ups 3 Democratic seats (Arizona, Georgia, and Nevada) and 2 Republican seats (Pennsylvania and Wisconsin). Cook’s rating of Pennsylvania was recently changed to leaning Democratic, but this does not alter the toss-up or worse count. A similar rating system in Sabato’s Crystal Ball counts Democrats as having 2 more Senate seats in trouble than Republicans (with Wisconsin rated as a leaning “hold” for Republicans). Sabato’s current ratings (Nevada and Georgia as Democratic toss-ups and Pennsylvania as “leans Democratic” also total to 1 more Democratic seat in trouble than the Republicans). With a 2022 seats-in-trouble index value at plus 1 (or maybe 2), the forecast is a 1 seat loss for Democrats in the Senate. With the current Senate at 50-50 (2 “independents” counted as Democrats), a loss of a single seat for the Democrats puts the Republicans in the majority. However, with the average absolute error of the forecast a bit over 2 seats, control of the Senate appears to be a toss-up of its own — perhaps with a slight Republican edge. Too close to call, at least for now, before campaigning gets into the stretch run and before any September or October surprises.
[1] Thanks to Charlie Cook, Jennifer Duffy, David Wasserman, Amy Walter, and their colleagues at The Cook Political Report and now The Cook Political Report with Amy Walter for generously sharing their data. Thanks too, to Larry J. Sabato, Kyle Kondik, and the Crystal Ball team for promoting election forecasting research in political science.
| James E. Campbell is a UB Distinguished Professor Emeritus of Political Science at the University at Buffalo, SUNY. Beginning with the 1986 midterm, he has published numerous articles on presidential and congressional election forecasting. He is the author of Polarized: Making Sense of a Divided America (Princeton, 2016 and 2018). His previous books include The American Campaign, Cheap Seats, The Presidential Pulse of Congressional Elections, and Before the Vote. He is also the author or co-author of more than 80 book chapters and journal articles on American politics. |