| Dear Readers: We are pleased to feature an article written by Lucca Ruggieri, a student at Great Valley High School in Malvern, Pennsylvania who interned with us over the summer. A few weeks ago, Crystal Ball Managing Editor Kyle Kondik wrote about the 1978 and 1982 midterms. Lucca brings that history up to the present, by looking at what happened from 1986-2018. While the last 4 midterms all can be fairly classified as waves against the White House party, the several elections before that were often more muddled. The recent history provides a frame of reference for whatever happens in 2022, whether it’s a calm election, a ripple, or a wave.
— The Editors |
KEY POINTS FROM THIS ARTICLE
— Recent midterms have featured a mix of wave elections against the president’s party as well as calmer ones where there was much less change.
— The only real wave between 1986 and 2002 was the 1994 election.
— The Senate often moves in the same direction as the House, although 2018 was a notable exception, and this year could be as well.
Recent midterm history
Initially poised to suffer huge losses in the 2022 midterms, Democrats experienced a surge in their polling numbers since the Supreme Court overturned Roe vs. Wade. From late April to September, Democrats went from trailing Republicans by 5 points in RealClearPolitics’ national generic ballot average to being up by about a point — despite high inflation and President Biden’s approval ratings lingering in the low 40s. But since mid-September, Republicans have been steadily gaining momentum, and their lead in the generic ballot has regenerated. Will this just be yet another year where polls drastically underestimate Republicans, or will Democrats manage to defy logic and have a respectable showing in 2022? Only time will tell, but in this article, we’ll look back to past midterms to see what indicators differentiate between wave, ripple, and calm elections. Over the past 3 decades, we’ve seen midterms that fit into all of those categories.
Let’s define what wave, ripple, and calm elections look like during midterms. Wave midterms usually consist of the opposition party either gaining 20 or more seats in the House and/or winning the House popular vote by 5 or more points. Calm midterms usually consist of the incumbent party losing less than 20 seats in the House and keeping the overall House vote close. Ripple midterms end up being somewhere in between.
First, let’s take a look at House elections. Table 1 shows relatively smooth sailing for the incumbent party from 1986 to 2002, with the exception of 1994; but since 2006, the incumbent party has faced a large backlash.
Table 1: House election results in midterms, 1986-2018
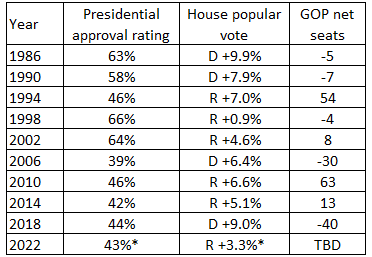
Note: Approval numbers for 1986-1998 are from Gallup; 2002-2018 approval is from RealClearPolitics average. *2022 numbers are from RCP’s presidential approval and generic ballot averages as of Oct. 20, 2022
Source: Gallup presidential approval rating, Brookings Vital Statistics on Congress, and RealClearPolitics generic ballot polling
Here are some key factors that influenced each election:
1986: RIPPLE. The Republicans only lost 5 seats in the House thanks to President Ronald Reagan’s high approval rating and a strong economy. Despite minimal gains in the House, Democrats flipped many seats in the Senate — albeit by small margins in many races — ultimately recapturing the chamber 6 years after Republicans had flipped the Senate on the same class of seats in the 1980 election.
1990: CALM. The Republicans only lost a small number of seats in the House as President George H.W. Bush had solid approval and as the Persian Gulf War loomed.
1994: WAVE. Republicans won the House for the first time since 1952 in a tsunami, largely due to President Bill Clinton’s low approval rating, itself mostly caused by a sluggish recovery from a recession and a string of legislative failures.
1998: CALM. Democrats were able to keep Republicans to a narrow House majority mostly due to the booming economy, the unpopularity of the impeachment inquiry over President Clinton’s affair with Monica Lewinsky, and the unpopularity of Republican Speaker of the House Newt Gingrich. This was the first time the presidential party had gained House seats in a midterm since way back in 1934.
2002: CALM. Due to President George W. Bush’s extremely high approval rating and Bush’s response to the Sept. 11 attacks, Republicans picked up seats, meaning that the presidential party gained in the House for the second straight midterm.
2006: WAVE. Democrats won a sizable House majority in 2006, largely as a result of George W. Bush’s unpopularity — caused by a string of scandals, a botched response to Hurricane Katrina, the unpopular war in Iraq, and other factors.
2010: WAVE. Republicans capitalized on a slow recovery from the Great Recession and backlash to Obamacare to make their largest net gain since 1938, flipping many rural seats in the South and Midwest that had previously been represented by conservative/moderate Democrats.
2014: WAVE. Though Republicans only gained a few seats on paper, they managed to build upon what was already a good-sized majority, giving the party their biggest House edge since 1928. They also flipped the Senate.
2018: WAVE. Democrats were able to win a large majority in a suburban backlash to President Donald Trump despite a strong economy, with traditionally Republican seats in the suburbs that had been red for decades flipping Democratic for the first time.
These results show a clear pattern: if the economy is strong and the president is popular, you’re most likely in for a calm election. If the president is unpopular or the economy is bad, you’re in for a wave election. Despite President Biden’s string of legislative victories in the summer, he remains very unpopular and the economy is teetering on the brink of recession.
Despite this, Democrats seem to be holding up OK given the circumstances. One possible reason for this could be that unlike in most elections, Republicans have been covered more in the media than Democrats thanks to events like the overturn of Roe vs. Wade, the FBI search of Donald Trump’s Mar-a-Lago, or some GOP candidate problems, giving Republicans much more negative coverage than the out-of-power party usually experiences. Could this potentially cause a ripple election, where similarly to 1986 we see the opposing party flip one chamber but make minimal or no gains in the other? Although the House can be quite turbulent, it moves in accordance with the national environment. The same is not always true for the Senate, as shown in Table 2.
Table 2: Senate election results 1986-2018
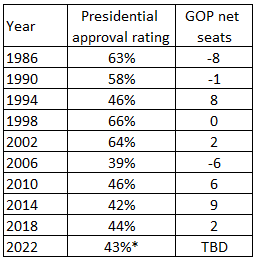
Note: Approval numbers at time of midterm for 1986-1998 are from Gallup; 2002-2018 approval is from RealClearPolitics average. *2022 numbers are from RCP’s presidential approval average as of Oct. 20, 2022
Some overall takeaways from Table 2 include:
— From 1990 to 2014, the overall net change in seats mostly reflects the changes in the House.
— 1986 is an example of a rare ripple election, where Democrats made large gains in the Senate despite minimal gains in the House.
— 2018 serves as an outlier, going against the national environment.
— Wave elections usually saw the non-incumbent party picking up 5+ seats, but this has changed with time.
As states have become less and less electorally elastic over the past few decades, the way that the Senate swings has changed drastically. As seen by comparing both tables, the Senate and House often shifted in the same direction. The most recent midterm, 2018, did not — largely due to the seats up for election that year.
Despite House Republicans suffering a landslide loss in 2018 — Senate Republicans picked up 2 Senate seats. How was this possible? The Class 1 Senate seats that were up in 2018 consisted of many seats held by Democrats in heavily Republican states like Indiana and North Dakota, which were no longer winnable for Democrats. This trend can be seen much earlier than 2018, like in 2006 when popular incumbents like Sen. Lincoln Chafee of Rhode Island — who was running as a Republican in a heavily Democratic state — lost their reelections as partisanship in their states solidified. This trend can be seen again in 2008 with Republican Gordon Smith losing reelection in Oregon, 2012 with Republican Scott Brown losing reelection in Massachusetts after a shocking special election win in early 2010, 2014 with Democrats Mark Pryor and Mary Landrieu losing in Arkansas and Louisiana respectively, and 2016 with Republican Mark Kirk losing in Illinois.
2022 doesn’t present any easy pickup opportunities for Democrats, but it also doesn’t offer any easy pickups for Republicans. Unlike years such as 2010 or 2018, the Class 3 Senate Seats don’t heavily favor either party. Because of this, both parties have roughly a 50/50 chance of winning the Senate.
So we have seen Wave, Ripple, and Calm elections in recent midterms. We’ll have to see where 2022 eventually slots in.