KEY POINTS FROM THIS ARTICLE
—Using data from Dave’s Redistricting App, we are looking at when each district has leaned most Democratic and most Republican, compared to the national popular vote, since 2008.
—By this metric, Biden’s 2020 performance represented the best Democratic showing since 2008 in a plurality of districts (145 of 435).
—Though his result was less impressive in raw terms, when adjusting for the national popular vote, John McCain was the best-performing recent Republican in 143 districts, the most on the GOP side.
—Some familiar trends, such as Mitt Romney’s strength in white collar areas and Hillary Clinton’s support from Hispanics, show up when comparing district voting across the years.
When each district leaned most towards either side
Over the past month, we have been diving into some newly-released election data from Dave’s Redistricting App. Recently, the site put out precinct-level data for most states that goes back to the 2008 election.
First, we looked at how each district changed from the 2008 to 2020 elections. Next, we considered district loyalty over the years. Now, we’ll see when each district was at its most Democratic and Republican points.
So wait, what exactly do we mean by that?
For an example, Table 1 considers how the median district by 2020 presidential performance on the 2024 House map, the Flint-centric MI-8, would have voted in presidential elections since 2008. The boxes are colored based on the two-party Democratic minus Republican percentage margins from each year.
Table 1: MI-8 vote compared to the national popular vote since 2008
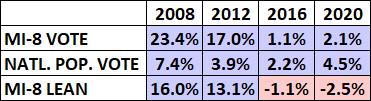
Though the district backed Democratic nominees in each of the 4 cycles that Table 1 considers, it was less Democratic than the national popular vote in 2016 and 2020 after being much more Democratic in 2008 and 2012. Going a bit further, even though Joe Biden performed a percentage point better than Hillary Clinton in the district, in 2020, MI-8 was not as Democratic vis-à-vis the national popular vote.
For this article, we’re keeping in mind the bottom row of Table 1, as it puts each district within the context of the larger national electorate. Michigan’s 8th District took on its most pronounced Democratic lean in 2008, while in 2020, it was at its most Republican. Another way to say this would be that Barack Obama, in 2008, was the best-performing Democratic nominee there, while Donald Trump, in 2020, was the best-performing Republican.
In what follows, we’ll apply this analysis at the national level, first looking at the Democrats, and then the Republicans.
On a bit of a programming note: we’ll also consider the current partisan breakdown of each district category based on its current representation in the House.
For the purposes of this article, we are making a few judgement calls to account for some recent mid-decade redistrictings. We are considering the new AL-2 and LA-6 (both of which are Black-majority) to be Democratic-held, while we are calling the newly redrawn NC-6, NC-13, and NC-14 Republican-held seats—had the newer state maps been in place for 2022, those districts would have likely elected members of those respective parties. Meanwhile, we are giving Reps. Don Davis (D, NC-1) and Brandon Williams (R, NY-22) the benefit of the doubt, both of whom were given tougher districts for 2024 (either could have lost if their new districts were in place for 2022). Additionally, Rep. Tom Suozzi (D, NY-3) is considered the incumbent in his seat, which flipped briefly to the GOP in 2022 before he recaptured it in a special election earlier this year. For a handful of currently vacant seats, we are considering the party that won them in 2022 to be the incumbent party.
THE DEMOCRATS
Map 1: Best-performing Democrat (compared to national vote), 2008-2020
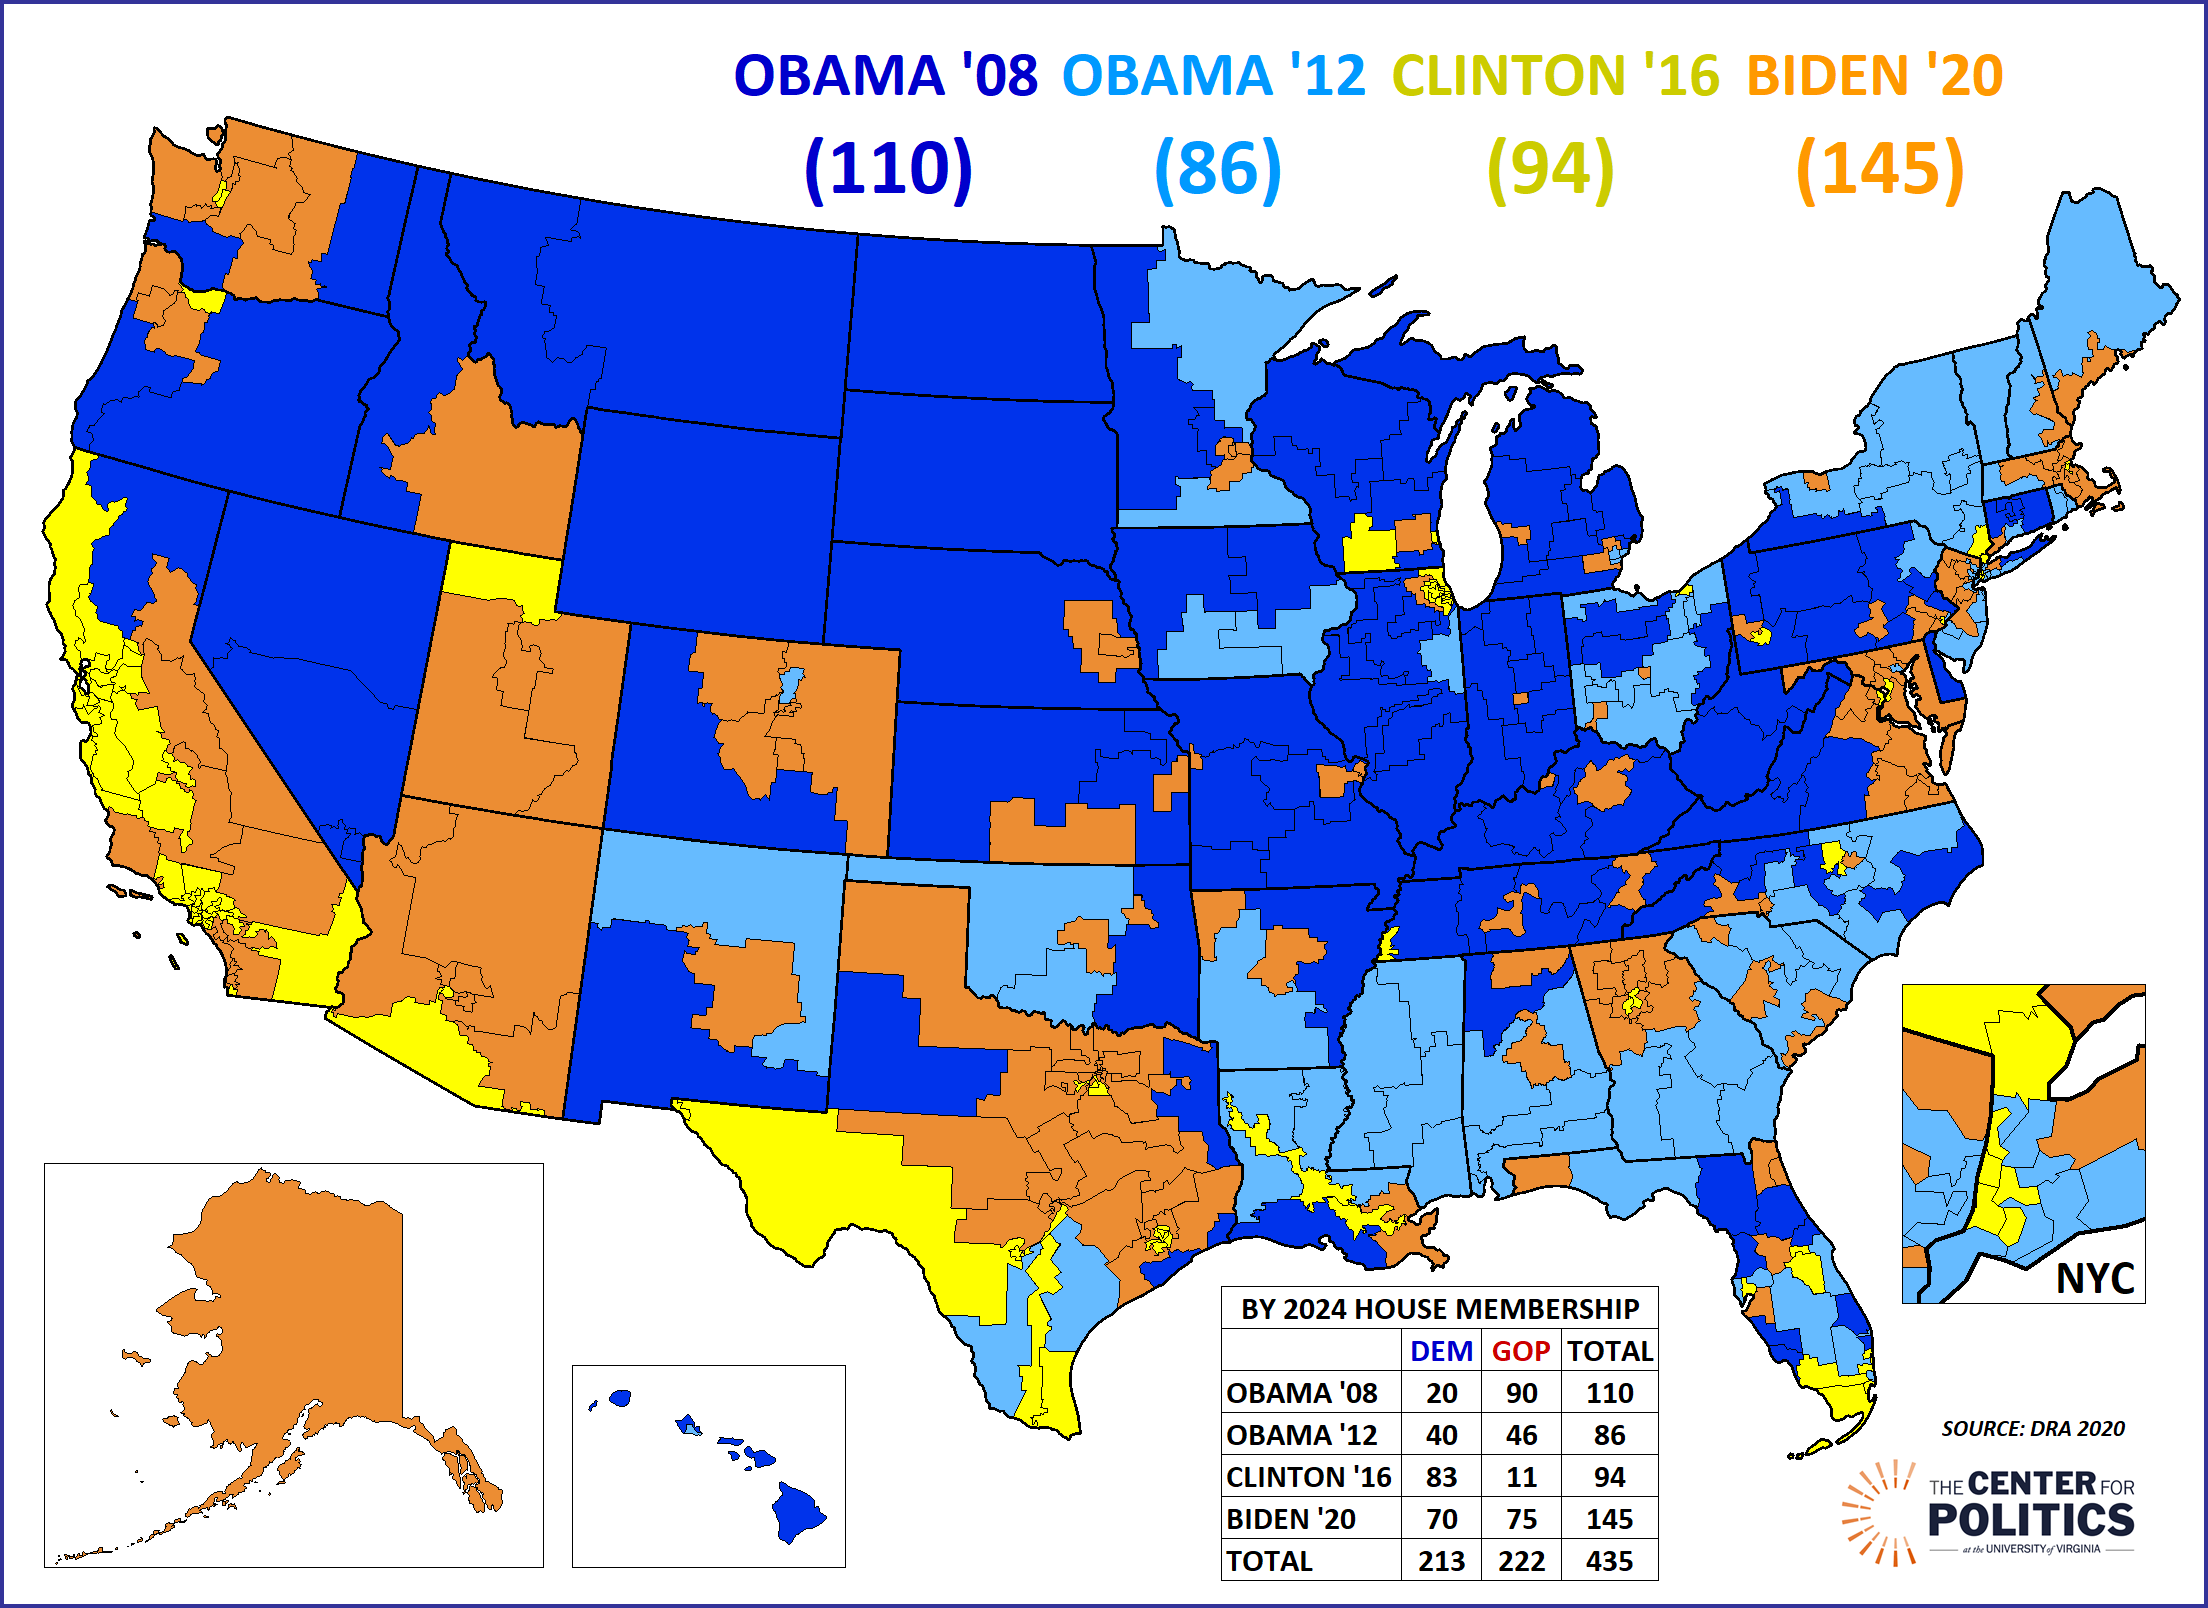
(right-click on the map for a larger version)
OBAMA 2008
Obama’s 2008 performance marked the Democratic high water mark in 110 districts. Though these blue districts take up much of the visual space on the map, this was only the second-most common Democratic category, behind those that most favored Biden in 2020. Obama’s 2008 strength was most apparent in the non-metro Rust Belt and Heartland districts. There are several examples are the electorally-critical trio of Michigan, Wisconsin, and Pennsylvania. That basic dynamic is also present in Obama’s home state, Illinois, and two states that border it on either side, Indiana and Missouri. In 2008, Obama kept the Great Plains states of Montana and the Dakotas within single-digits, and was the last presidential nominee to carry the perennially marginal Nevada by double-digits. Even when adjusted for the national vote, Obama’s 2008 strength in these states is obvious.
Of these 110 districts, the vast majority (90) are currently held by Republicans.
OBAMA 2012
86 districts on Map 1 were their most Democratic, relative to the national popular vote, when Obama was on the ballot for a second time, in 2012. These light blue districts are prevalent in the Deep South: every state in the region has at least two of them, and they are also common in the Outer South states of Florida and North Carolina. Part of why this region sticks out could be that Romney, a technocratic Mormon patrician, was simply a poor fit for the rural South. Obama also likely benefited from good Black turnout and support in some of these Southern districts. Romney’s profile apparently wasn’t well-suited to some working class parts of New England and the Midwest: ME-2 (northern Maine), MN-8 (Duluth), and PA-8 (Scranton) were all light blue on Map 1.
The 86 Obama 2012 districts are about evenly divided when it comes to their representation: Democrats hold 40 of them while Republicans have 46.
CLINTON 2016
Perhaps the most interesting set of districts on the Democratic side were the ones that leaned most to the left in 2016, the only election that we are considering where the Democrat lost in the Electoral College. The 94 yellow districts on Map 1 tended to skew nonwhite, and most of the districts in this group that are majority-white are also quite liberal. For example, the Clinton 2016 districts included all 3 of South Florida’s heavily Cuban seats, 4 of the 5 Texas border seats, and Arizona’s 2 Hispanic-majority seats. White liberal seats in this category included WI-2 (Madison), NC-4 (the Research Triangle), NY-17 (much of upscale Westchester County, which Clinton identified as her residence in her 2014 autobiography Hard Choices), and several Chicagoland districts.
We should also make a special note of Clinton’s strength in California: she was the best-performing Democrat in 39 of the megastate’s 52 districts, dominating both the Bay Area and the Los Angeles metro. This could be because broadly, Clinton held onto enough of Obama’s Hispanic support but also brought in a critical mass of soft Republicans (Biden would add more of that latter group to his coalition). A heavily Latino example in this category is TX-23, a sprawling El Paso-to-San Antonio district where Rep. Tony Gonzales (R) barely held on in a primary runoff on Tuesday night.
TX-23 is one of the relatively few Republican-leaning districts among this group: Democrats overall hold a lopsided 83-11 margin among this group of districts.
BIDEN 2020
Biden’s 2020 performance represented the best relative showing for Democrats since 2008 in the 145 orange districts on Map 1. Not surprisingly, given the broader trends that we often discuss, Biden had the most “suburban” coalition. With a few exceptions in some urban core areas, Biden held up especially well in northern Georgia, eastern Virginia, as well as much of Arizona and Colorado. If California could be considered Clinton’s largest “standout” state, we could say the same for Texas and Biden, although to a somewhat lesser extent: a small majority of Texas’s districts (21 of 38) were their most Democratic in 2020, although the South Texas districts are not among them, as Biden’s showing in that region was weak compared to previous Democrats.
Biden’s strength in three of the Philadelphia collar districts as well as in the Harrisburg-based PA-10 and suburban Pittsburgh PA-17 helps explain why we’ve—perhaps stubbornly—kept this very marginal state in the Leans Democratic category on our Electoral College map. Similarly, to us, the four orange districts that cover the Twin Cities metro speak to how hard a climb Minnesota is for Trump, despite some recent polling suggesting a close race.
Republicans actually hold a slight 75-70 advantage in this 145-seat category. This split could be because many of the orange districts—such as the aforementioned seats in Texas and Georgia—could broadly be described as “Republican-leaning but Democratic-trending.”
We would also include Utah as something of a final note here. Though Clinton would have been the best-performing Democrat in more than just a single district there if we included all parties, Biden’s showing in the state looks better in our two-party format.
THE REPUBLICANS
Map 2: Best-performing Republican (relative to national vote), 2008-2020
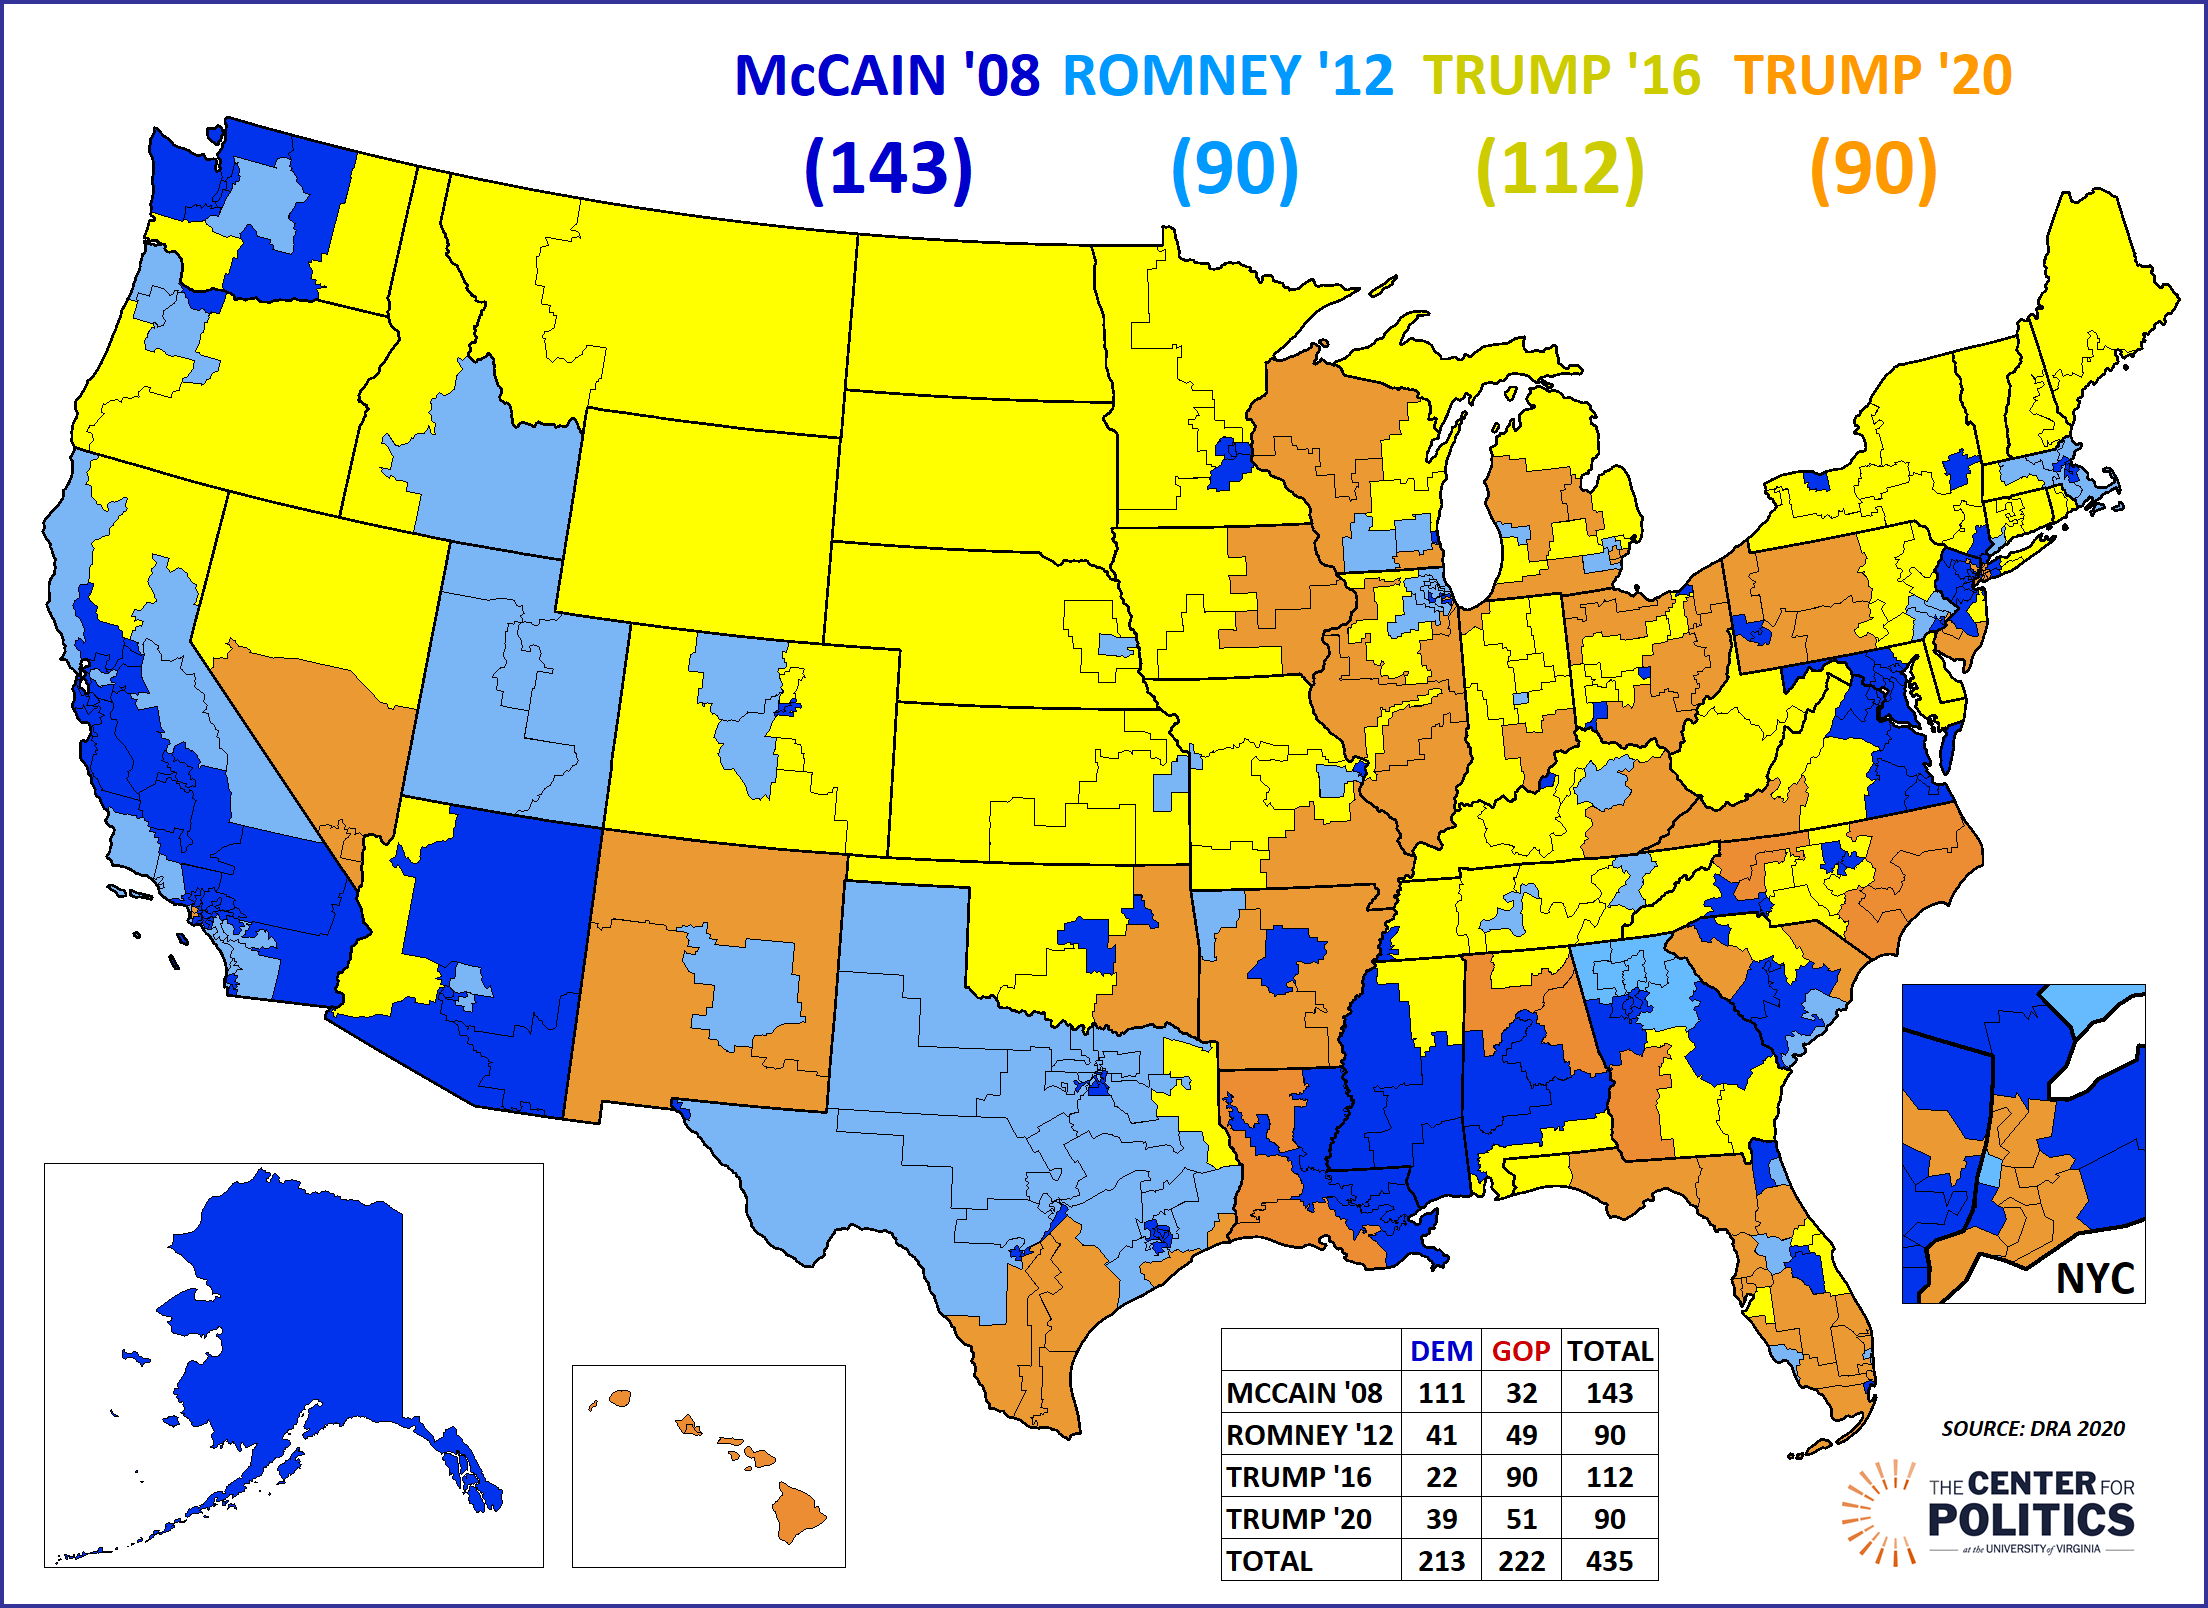
(right-click on the map for a larger version)
McCAIN 2008
When considering recent Republican candidate performance, 143 districts leaned furthest to the right in 2008. John McCain’s coalition had some overlap with Biden’s, on the Democratic side: this makes some sense, because McCain’s districts, by definition, were most Republican during the least recent election that we’re considering. Both McCain and Biden performed well in Mid-Atlantic suburbs, with the trio of Virginia, Maryland, and New Jersey standing out.
Elsewhere on the map, McCain’s strength showed up in California, where the fact that his showing represented the GOP’s high-water mark speaks to how tough the state has gotten for Republicans since. McCain fared similarly well in Black-majority districts across the South—a little ironic, considering the historic nature of his opponent’s candidacy that year.
The McCain districts are overwhelmingly represented by Democrats, who have a 111-32 advantage in the group.
ROMNEY 2012
If Biden had the most “suburban” Democratic coalition, Mitt Romney had a comparable coalition on the Republican side. Key Romney strongholds on Map 2 included the northern and western (read: whiter) suburbs of Atlanta, much of Chicagoland, and the Philadelphia collar. Though Romney may have gotten a bit of a home state boost in Massachusetts, he seemed to be, at least temperamentally, the best-suited Republican for the Bay State anyway. A majority of Texas’s districts (22 of 38) were also in the Romney coalition—these districts tended to be outside the urban core districts and north of the Rio Grande Valley. And, of course, as the first Mormon presidential nominee of a major party, Romney’s strength in Utah and eastern Idaho is hard to miss.
Interestingly enough, the partisan composition of the Romney 2012 districts tracked closely to that of their same-year counterparts on the Democratic side (Obama’s from 2012): They are currently represented by 41 Democrats and 49 Republicans.
TRUMP 2016
112 districts leaned most Republican during Trump’s first run, in 2016. Generally, these districts were something of a hodgepodge, although some areas that stand out are the Great Plains and the Northeast. In the latter case, Trump made some substantial gains over Romney’s 2012 performance, but much of this relatively secular region snapped back against him in 2020—the same conservative governance that likely endeared him to more partisan Republicans may have alienated some Trump-curious northeastern voters.
By their current representation, the Trump 2016 districts have the most markedly pro-GOP skew of the four groups: the 112 districts break 90-22 in favor of House Republicans.
TRUMP 2020
Compared to the 112 Trump 2016 districts, the 90 Trump 2020 districts tended to be more ethnically diverse. These orange districts are commonplace in Florida, New York City, and Nevada. New Mexico provides a bit of an illustrative case here: Districts 2 and 3, which are plurality-Hispanic by composition, both are in the Trump 2020 group while NM-1, which is plurality-white, was in the Romney category.
Several archetypically “ancestrally Democratic” districts fall into this category, as well. Examples include eastern Oklahoma’s OK-2, rural Arkansas’s AR-1 and AR-4, and southwestern Louisiana’s LA-3. These districts have essentially trended Republican over the last few decades regardless of the national environment.
Perhaps because of their more diverse nature, the Trump 2020 districts have more partisan balance in the House than the Trump 2016 set. The orange districts on Map 2 send 39 Democrats to the House and 51 Republicans.
Conclusion
While some of the patterns that show up in the maps here are not very shocking, it’s easy to find a district or two in each category that doesn’t really line up with expectations. If we were doing this survey again a year from now, it would be instructive to see how Biden, and Trump, perform compared to recent cycles.