KEY POINTS FROM THIS ARTICLE
— Most districts in the House, 379 of the 435, have exclusively backed nominees from only one of the major parties in presidential elections since 2008.
— This leaves 56 districts that have voted at least once for both parties.
— Districts that backed Barack Obama twice and then did the same for Donald Trump make up the most numerous non-straight party group, and most of those districts have Republicans in Congress.
— Democrats, however, hold four of the five “bellwether” districts that have backed the winners of the last four presidential elections.
District loyalty since 2008
Last week, we took a look at some longer-term district-level trends—our analysis was made possible by Dave’s Redistricting App (DRA), a free program that recently released presidential precinct-level data for most states going back to the 2008 election. This week, we are going to dig a little deeper.
Of the 435 districts in the House, the vast majority of districts have voted straight party since 2008—this should not come as a huge surprise to our readers. All told, 379 districts started in 2008 by backing the nominee of either party and have not deviated since. Democrats, though, start off with a bit of a higher “floor” than Republicans: 203 seats have voted straight Democratic over the four elections we’re considering while 176 have only backed Republicans.
While there are certainly several of these straight-party seats that are important in the overall fight for the House—some of them have stayed with one party by consistently narrow margins, for instance—the cross-party districts have also played an outsized role in determining the chamber’s majority.
If 379 districts have been continually partisan, that leaves 56 districts that have backed either party at least once. Map 1 highlights these districts (click on the map for a larger version).
Map 1: Non-straight party districts, 2008-2020

Note: The Alaska At-Large and Hawaii districts were straight-party, so are omitted from the map.
Additionally, Table 1 lists the 56 non-straight ticket districts by their current representation in Congress.
Table 1: Non-straight party districts, 2008-2020
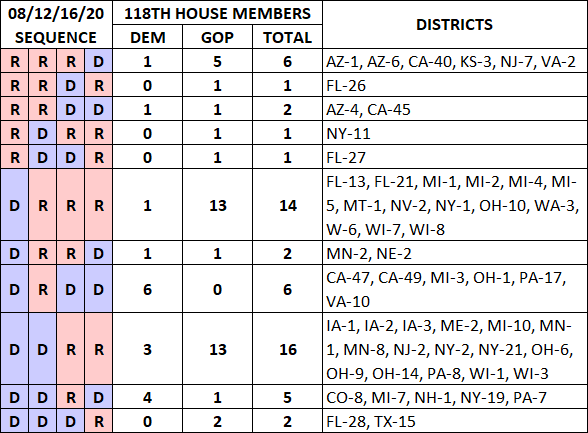
As Table 1 shows, each of the 56 non-straight ticket districts all fall into 1 of 11 categories, with some obviously being more numerous than others. In what follows, we’ll go into each category and consider the districts that they contain.
On a bit of a programming note, the tables that follow all reflect the two-party Democratic minus Republican percentage point margin of a given district each year. The source is, of course, DRA.
D/R/R/R (“One term of Obama was enough, thanks”)

The first group of districts we’ll discuss are the ones that went for Obama in 2008 but have since been in the Republican column. This was one of the larger categories in Table 1, with 14 districts total. This is not too shocking, considering Obama’s 2008 showing, at a very broad level, represented the modern high-water mark for Democrats at the national level—so it would stand to reason that they were not able to win back several districts in subsequent elections that were less lopsided.
Last week, we flagged Wisconsin as the “poster child” for Obama’s overperformance in his home region, the Midwest. With that, 3 of the Badger State’s 8 seats are in this group: Districts 6, 7, and 8. All three are north of Interstate 94 (an stretch we singled out last week), so they cover the non-Madison, non-Milwaukee parts of the state. Aside from Obama’s own strengths in 2008, the backlash to the Iraq War likely worked against Republicans in an area that has been anti-war in some key historical elections.
Obama’s 2008 Midwestern mojo was also evident next-door in Michigan, where he posted the best result of any Democratic nominee since Lyndon Johnson in 1964. Four Michigan districts are in this category: Districts 1 and 5, which take up the northern and southern extremes of the state, respectively, as well as Districts 2 and 4; the former is a large rural seat while the latter runs south of the Grand Rapids area. Though the 4th, where Biden performed better than Obama did in 2012, may be a legitimate Democratic target in the not-so distant future, the other three should remain double-digit Republican seats.
The only Democratic-held seat in this group is WA-3, where now-Blue Dog Coalition Co-Chair Marie Gluesenkamp Perez won in upset against a weak Republican, far-right veteran Joe Kent, in 2022—a rematch appears likely this year.
Other relatively marginal districts in this category include Long Island’s NY-1 and OH-10. The former was a narrow Biden-won seat before a recent mid-decade redistricting, and in the latter, long-serving Rep. Mike Turner (R) typically overperforms fundamentals in this Dayton-based seat.
Obama would have carried Montana’s 1st District in 2008 and Biden came closer to carrying it than Obama did in 2012. Though we have Rep. Ryan Zinke (R) as a favorite, his 2022 win in what was then a newly-created seat was not impressive, and Sen. Jon Tester (D) seems likely to carry this seat as long as his race remains competitive.
Staying out west, Obama carried Nevada’s 2nd District by less than half of a percentage point in 2008. This district, which has never sent a Democrat to Congress, is now a double-digit Republican seat—despite the presence of blue-trending Washoe County, NV-2 includes most of the state’s rural “cow counties.”
Finally, Florida, a state that will be making some other appearances later on, had two districts in this category. District 13, a subtly gerrymandered seat, is entirely within Pinellas County but avoids many of St. Petersburg’s Black precincts. We have the seat as Likely Republican. Rep. Anna Paulina Luna (R) won an open seat race only by single-digits in 2022, a banner cycle for Florida Republicans. District 21 pairs the northern extreme of the state’s Gold Coast with parts of the Treasure Coast—the latter of which has a more working class flavor. Democrats held this seat in 2012 and 2014, but Rep. Brian Mast (R) has since been comfortably reelected.
R/R/R/D (“Republicans until we got sick of Trump”)

In what is essentially the opposite category of our first group, six districts voted only for Republicans until 2020—although, like the first group, Democrats currently hold just one of these seats.
In Arizona, Obama would have lost Districts 1 and 6 by double-digits each time he was the Democratic nominee. Hillary Clinton lost each by about 5 points, but by 2020, Biden very narrowly carried them. Both seats are held by Republicans who prevailed in a similarly close fashion in 2022. We have had AZ-1, which includes part of Phoenix proper and all of Scottsdale, as a Toss-up all cycle and we recently moved AZ-6, which is a Tucson-area seat, into our most competitive category.
NJ-7 (based in the state’s Skylands region) and VA-2 (Virginia Beach) both have first-term Republicans who we currently peg as slight favorites. Both seats had Democratic incumbents before 2022, but each got less blue in redistricting—enough to help enable now-Reps. Tom Kean (R, NJ-7) and Jen Kiggans (R, VA-2) to prevail.
In 2021, New Jersey and Virginia both held gubernatorial elections, where the two aforementioned districts seemed to diverge, at least when considering longer-term trends. Many of NJ-7’s core municipalities trended blue from 2013 to 2021, while during the same span, Virginia Beach/Hampton Roads was Virginia’s most red-trending metro area.
CA-40, which is held by Rep. Young Kim (R) and includes much of western Orange County, is a Likely Republican seat that does not seem like an especially promising Democratic target. This 51%-49% Biden seat is just redder down the ballot: Gov. Gavin Newsom (D), for instance, fell just under 45% there in both 2018 and 2022.
The only Democratic-held seat in this group is KS-3, held by three-term Rep. Sharice Davids. The core of this district is Johnson County, which includes Kansas City’s suburbs and has a 57% college attainment rate. In a seat would have matched the national popular vote almost exactly in 2020, Davids was reelected by 12 points in 2022.
D/D/D/R (“Democrats for Trump’s reelection”)
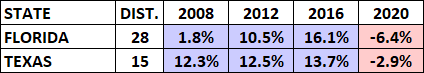
Two districts backed only Democratic nominees before flipping to Trump in 2020. Both are heavily Hispanic, and we have mentioned each at least a few times over the past few years: FL-28 and TX-15.
FL-28, one of three heavily Cuban districts in South Florida, began as a marginal Obama-won seat. As Obama’s numbers improved with Hispanics in 2012, he carried it by more than 10 points. Trump’s unpopularity with Cubans pushed the district even more Democratic in 2016. Then, as with Miami-Dade County overall, FL-28 shifted hard to Republicans.
TX-15, a South Texas seat, was remarkably stable from 2008 to 2016, always giving Democratic nominees somewhere between a 12-14% margin. In 2020, Trump flipped the current district by 3 points, although we would note that before redistricting, the version of the district that was in place for 2020 would have narrowly backed Biden.
Republicans hold both of these districts.
D/D/R/R (“Obama-to-Trump”)
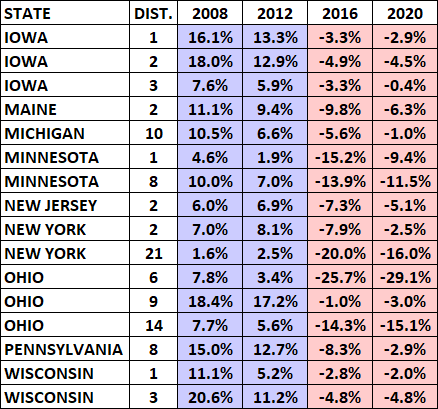
The largest category of the districts we are considering in this article is the D/D/R/R group—these are the true “Obama-to-Trump” seats. Republicans currently hold a 13-3 advantage in this set.
We’ll start with the three Democratic-held seats, all of which we’ve mentioned multiple times in recent cycles and all of which have veteran members by this point. Reps. Matt Cartwright (D, PA-8) and Jared Golden (D, ME-2) both hold seats that we rate as Toss-ups. Meanwhile, we have Rep. Marcy Kaptur (D, OH-9), who won by an unexpectedly large margin against a poor-quality opponent in 2022, as a slight favorite for a 22nd term.
The 13 remaining districts have an overwhelmingly Midwestern orientation, though three exceptions came in New Jersey and New York. NJ-2, held by the party-switching Rep. Jeff Van Drew (R) is, in terms of its trends, the opposite of the aforementioned NJ-7. On Long Island, NY-2 has remained a relatively marginal Obama-to-Trump seat while NY-21, the “North Country” seat, has shifted considerably rightward since the Obama era. The latter is held by House Republican Conference Chairwoman Elise Stefanik, whose ideological trajectory has been in sync with that of her district.
This group also includes three Iowa seats, one from Michigan, and two apiece from Minnesota, Ohio, and Wisconsin. Still, all these districts are not equally competitive. For instance, we highlighted OH-6, which saw the largest swing between 2008 and 2020 of any district, last week as a seat that should be Safe Republican going forward. Districts like OH-14 and MN-8 also stand out as probably “gone” for Democrats, at least until the next realignment. But it’s possible that Biden may be able to carry the Des Moines-based IA-3 or Macomb County’s MI-10 this year—both of which he would have lost by less than a percentage point in 2020.
R/R/D/D (“Former Republicans”)

Arizona’s 4th and California’s 45th, the only two districts that voted “double Republican” and then “double Democratic,” are a pair of Sun Belt seats that took somewhat different paths to the same category.
Of the two, AZ-4, held by Democrat Greg Stanton, is probably the district that, altogether, better fits the profile of a historically GOP seat that has moved more Democratic. This majority-white seat takes in parts of several communities just east of Phoenix, notably Mesa, Chandler, and Tempe. In 2008, it backed its senator, John McCain by 7 points, and four years later, Mitt Romney did slightly better. Then, in 2016, Hillary Clinton carried it by a few points before it saw another acute blue swing, giving Biden a 10.5-point margin.
CA-45, by contrast, is a diverse Orange County seat that is plurality Asian by composition and is represented by Republican Michelle Steel. The constituency that most accounts for this district’s movements over the years may be the sizable Vietnamese bloc in the cities of Garden Grove and Westminster. After McCain carried the district by nearly 5 points, Romney came close to losing it in 2012. Precincts in those two cities swung heavily against Romney—perhaps McCain’s war service against the Vietcong carried weight here. Then, in 2016, most CA-45 precincts swung Democratic, as Clinton won the seat by 14 points. But by 2020, Biden carried CA-45 by less than half of Clinton’s margin—he hemorrhaged support in the Garden Grove and Westminster portions of the seat.
It is not hard to imagine a scenario in 2024 where AZ-4 continues to get bluer while CA-45 reddens.
D/R/D/D (“#OnlyMitt”)

Six districts supported Obama in 2008, briefly lurched rightward in 2012, then returned to the Democratic column for both 2016 and 2020. These “only Romney” seats are all upscale suburban seats and are all held by Democrats.
Staying in Orange County, CA-47 and CA-49 both hug the coast and flipped in 2018. Two other seats in this category that have been in the Democratic-held since 2018 are PA-17, which includes many suburbs immediately north of Pittsburgh, and VA-10, a Northern Virginia seat that we discussed last week.
The members from MI-3 and OH-1, which take in Grand Rapids proper and Cincinnati proper, respectively, represented two more recent additions to the Democratic caucus. Reps. Hillary Scholten (D, MI-3) and Greg Landsman (D, OH-1) both won in 2022 with help from redistricting, although Democrats did not control the process in either state.
R/D/R/R (“Obama’s Sandy boost”)
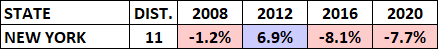
Only one district falls into what could be called the “anti-Romney” category, as it has backed Republicans in three of the four presidential elections we’re considering, with the exception coming in 2012.
New York’s 11th District, which contains all of Staten Island and a selection of Brooklyn precincts, was a marginal McCain-won seat before it flipped to Obama in 2012. The main reason probably has to do with Obama’s response to Hurricane Sandy, which flooded much of New York City shortly before the 2012 election—so, an “anti-Romney” designation may not be entirely fair, as Romney himself, as the non-incumbent, was not in a position to aid voters here (the storm may have also impacted turnout patterns in such a way that Obama benefitted).
All that said, Trump, a brash New Yorker, was a much better fit, at least temperamentally, for the district than Romney. In the last two presidential elections, this district has given Trump high single-digit margins. Democrats, at least for 2024, also seem to have much better targets in the state than Rep. Nicole Malliotakis (R).
D/D/R/D (“The Bellwethers”)

Five districts have picked the correct Electoral College winner since 2008. Despite their status as the minority party in the House, if only by a small margin, Democrats actually hold all but one of these “bellwether” seats—we use that term a bit loosely because none of these districts were actually in place during the last four presidential elections (remember, we’re using the current congressional maps, created in advance of 2022 for most states or, in a few instances, are brand-new for the 2024 cycle).
In the only Republican-held district (NY-19), first-term Rep. Marc Molinaro got a little help in the state’s mid-decade redistricting but still has a seat that would have been very slightly left of the national vote in 2020.
In 2022, Democrats defended three of the remaining four seats with incumbents who were initially elected in 2018: MI-7 (Lansing), NH-1, and PA-7 (Allentown). They also won the then-newly created CO-8, which appeared north of Denver, in one of the closest results of the cycle.
If 2022 had been more of a “normal” midterm, it would not have been hard to envision a world where Republicans came out of the election holding all five of these seats. We currently rate NH-1 as Likely Democratic, but we put the other four in either the Toss-up or Leans columns, making this a group very much worth watching this year.
R/R/D/R (“The Contrarian”)
If there have been five districts that have been presidential bellwethers since 2008, there has only been one “contrarian” district during that time: South Florida’s FL-26.
Held by Rep. Mario Diaz-Balart (R), who is now the longest-serving member of the Florida delegation, FL-26 is the most Republican-leaning of the three heavily Cuban seats in the Miami area. Hialeah, the largest city that is basically entirely contained within the district, is instructive. In 2008, McCain carried this nearly all-Cuban city 64%-36%. Romney posted a weaker 54%-46% result and by 2016, Trump came within 200 votes of losing it the city. But South Florida saw a sharp redshift four years later, and Trump’s 2020 margin in Hialeah was even better than what McCain posted.
Despite Clinton’s impressive showing here in 2016, Diaz-Balart has sometimes run completely unopposed and he is not a realistic Democratic target.
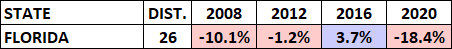
R/D/D/R (“Prodigal Republicans”)
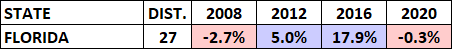
Another South Florida seat that has had a unique trajectory was the next-door FL-27, held by two-term Rep. Maria Elvira Salazar (R). For Republicans, this could be considered the “prodigal son” district: after beginning in the red column, it wandered over to the Democratic side for two elections before returning to the GOP nominee in 2020.
The basic movements in the 27th were similar to the 26th. The biggest difference is just that the 27th is fundamentally a more Democratic seat: 26th pairs Cubans in Miami with conservative whites in the Naples area while the 27th is entirely within the Miami area and has more of a white liberal component.
In 2020, Trump’s strong showing in South Florida was only barely enough for him to carry the current 27th. That said, Salazar ran a couple of points ahead of Trump in 2020, and we rate her as a clear favorite this year.
D/R/R/D (“Prodigal Democrats”)
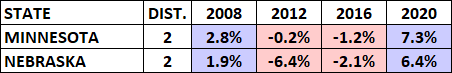
The final category of our series features two districts that have been, at least in presidential races, polar opposites of FL-27. MN-2 and NE-2 backed Obama, switched to Republicans for 2012 and 2016, then returned to the Democratic fold in 2020.
Hled by Democratic Rep. Angie Craig, MN-2 is based in Dakota County; just south of the Twin Cities metro area, the county’s 44% college attainment rate is 10 percentage points higher than the nation as a whole. As an interesting aside, though it retained all of Dakota County and was generally similar to the current version, if the seat that Craig was first elected to in 2018 were still in place, it would have backed Obama in 2012, putting it in the “Bellwether” category.
The last district we’ll visit here is one that we’ve mentioned quite a bit in recent years: Nebraska’s 2nd. In 2008, Obama snagged this Omaha-area seat and its single electoral vote by a few points. After Democrats fell short in the two next elections, Biden carried it by 6 points. Still, Rep. Don Bacon (R) has managed to defy the pro-Democratic trend in his district, although he is in a Toss-up race this year.
Our expectation is that Biden will carry NE-2 again, which helps explain why Trump, and some state Republicans, have pushed to scrap the state’s district-level electoral vote allocation format.
Conclusion
While some of the 56 districts mentioned here will not be in play in this year, both sides have categories where they will need to perform well. To flip the chamber, Democrats would probably like to continue holding most of the “Bellwether” seats. On the flip side, Republicans will want to hold serve in the set of districts that voted for all their nominees up until Trump in 2020.
One broad takeaway here could be that states that are gerrymandered tend to have fewer non-straight party seats.
Under a fair map, Utah, for instance, would almost certainly have a compact, Romney-won seat in Salt Lake County that would have leaned Democratic after 2012. But Republican mappers split Salt Lake County four ways. It is also easy to see Oregon, where Democrats drew the map, having at least one district highlighted on Map 1 if it had a less gerrymandered plan.
This is not to say that all districts in gerrymandered states voted straight-party. Florida, which has a plan that we have dubbed the “DeSantimander,” has several districts on Map 1, though all of them ended up supporting Trump in 2020.
This article also serves to reinforce just how narrow the playing field is: the 56 districts mentioned in this article make up just 13% of the total seats in the chamber—but in a time of close majorities, they will likely have an outsized impact.