KEY POINTS FROM THIS ARTICLE
— Joe Biden outran Hillary Clinton in 73 of 75 large suburban counties, an indicator of the suburban strength that carried him to the White House.
— In Georgia, Colorado, and Minnesota, Biden’s performance in the major suburban areas served as bellwethers for his statewide performance, as he used strong improvements in these counties to pad his statewide margin and carry himself to victory.
— The link between education and voting tendencies is only getting stronger, with a heavy correlation emerging between Biden’s vote share improvement and the county’s four-year-degree rate.
Biden’s suburban swings
As Donald Trump became the first incumbent who lacked a serious primary challenger to lose re-election since 1932, Mitch McConnell noted, “We need to win back the suburbs.” An early analysis gives credence to McConnell’s theory; across 75 counties around major metro areas with over 105,000 presidential votes cast, Biden outran Hillary Clinton in 73 of them and Barack Obama in 66 of them.
The demographics, geography, and local politics of these areas may vary greatly, but whether in a strong Republican area like Waukesha County in Wisconsin or a Democratic stronghold like Ramsey County in Minnesota (which contains the city of St. Paul and can really be classified as both urban and suburban), one thing was consistent: in suburban areas, Biden significantly improved on Clinton’s 2016 margins, and these gains paved his path to the White House. In this article, we will examine Biden’s suburban performance in three key 2020 states that provide a microcosm of the trends observed at large: Georgia, Minnesota, and Colorado. Georgia flipped from Trump 2016 to Biden 2020, while Biden carried Clinton states Minnesota and Colorado by markedly larger margins than Clinton did four years ago.
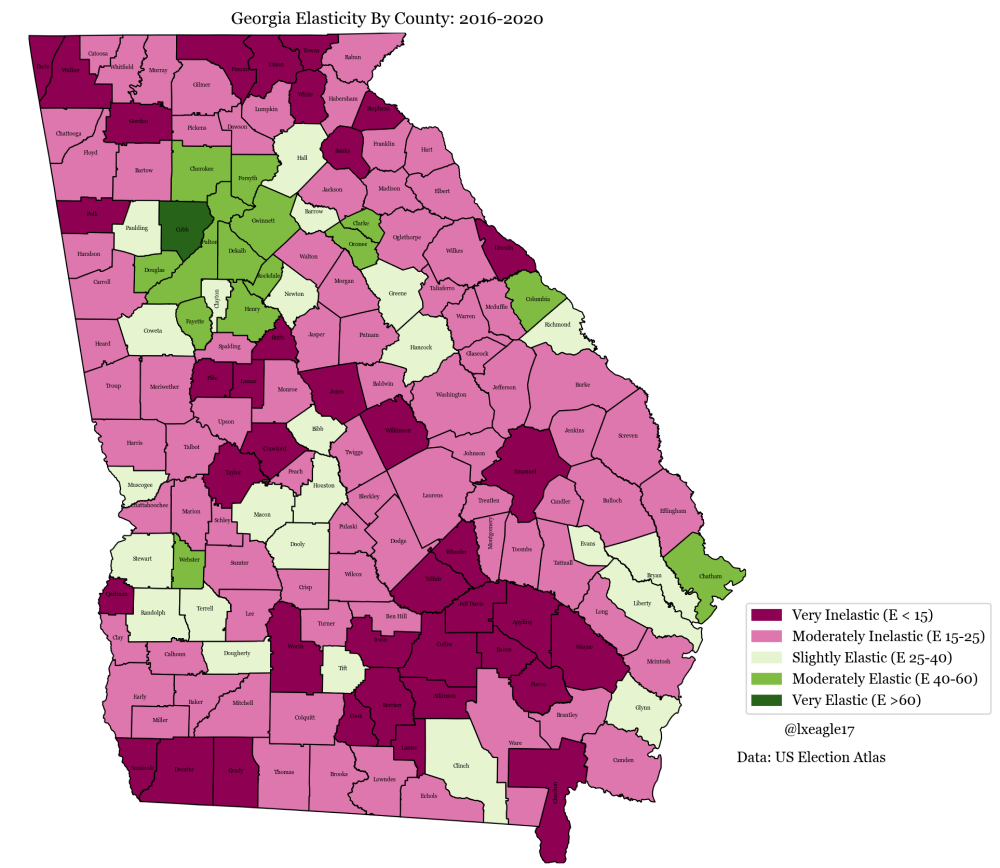
A few of the aforementioned counties electorally doomed Trump, but perhaps none are as devastating as the ones in the Atlanta metropolitan and suburban areas. Georgia as a state is politically very different from even what it was four years ago, and nothing illustrates this better than the elasticity[1] of the state, which shows us the vote variation of an area over a period of time.
As shown below, the overwhelming majority of the state is extraordinarily inelastic, with little shift in margins between Clinton’s 2016 loss, Stacey Abrams’ (D) 2018 gubernatorial loss, and Biden’s 2020 win. However, there is one major pocket of elastic voters, and it is located in the Atlanta metro area, which dominates the population of the state and constitutes an outsized proportion of Georgia’s voters. Joe Biden took an overwhelming share of the swing voters in these elastic areas, improving on Clinton and Abrams’ margins in suburban and exurban areas like Cobb, Gwinnett, Douglas, and Forsyth by immense amounts and setting himself up for victory.
Maps 1: Georgia elasticity, 2016-2020
Map 2: Georgia presidential swing, 2016-2020
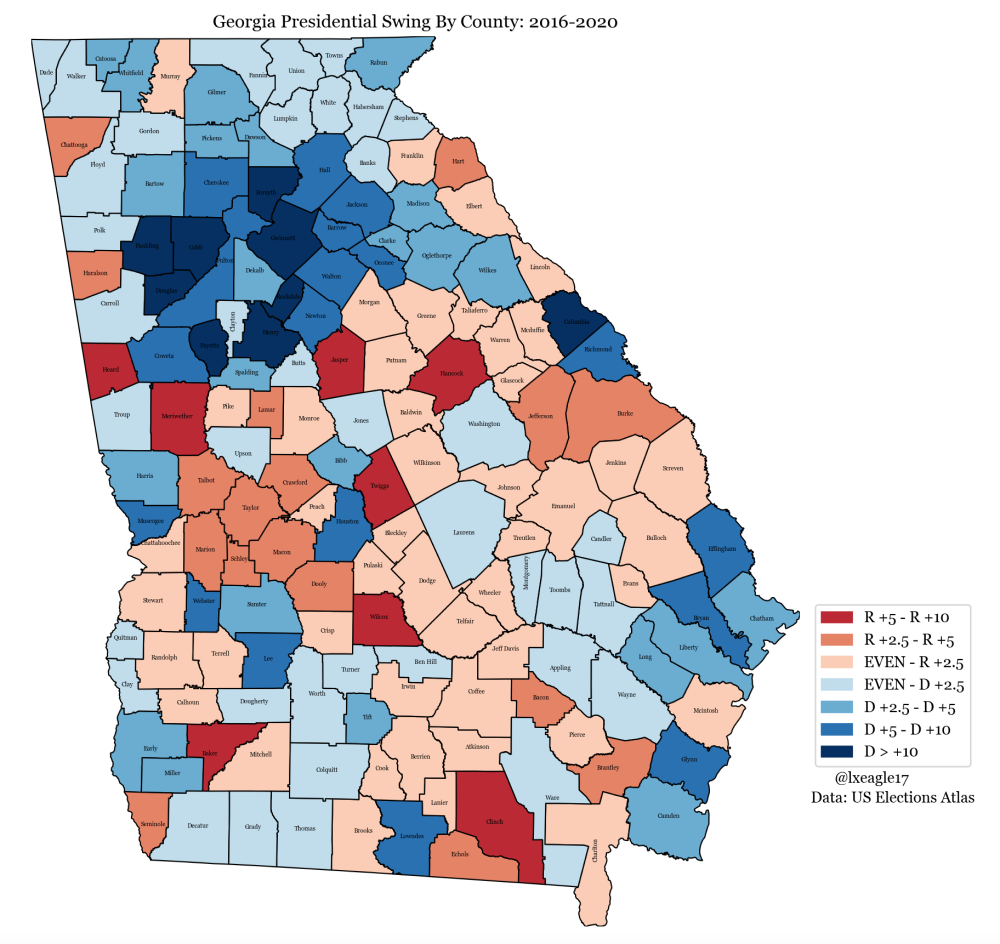
A sparkling example of the suburban leftwards swing in Georgia is found in the counties of Gwinnett and Cobb. In 2012, President Obama earned 44.6% of the vote in Gwinnett County. Four years later, Clinton earned 50.2%. And four years after that, Biden earned 58.4% of the vote, improving on Clinton’s vote total by about 75,000 votes. Meanwhile, in Cobb County, Biden ran 13.6% better than Obama did in 2012 and picked up over 60,000 more votes than Clinton. Biden won Georgia by nearly 12,000 votes, but if Trump had shaved just 10% of Biden’s gains in those two counties, he’d have won the state. As it is, Biden’s victory came almost entirely on the back of his strength in suburban Atlanta.
The Georgia shift coincided with the party’s strength at the presidential level among college-educated whites and Black voters. While Trump made some gains with Black voters in exit polling (though the reliability of those numbers, especially in the days after the election, should be limited), Biden still won 88% of Black voters in Georgia. Additionally, he earned the support of 57% of college graduates, including 44% of college whites, which far exceeds Clinton’s 28% total in the 2016 exit polls. Both Cobb (46.5%) and Gwinnett (36.1%) have rates of education well above the national 33% average of adults that completed a four-year degree. Moreover, each county is at least 29% Black, per the 2018 Census estimate.
These two factors — a high number of Black voters and a high number of college graduates — explain why the two counties swung further toward the Democratic presidential candidate between 2012 and 2020 than any other suburban county in the nation did. Had Trump stemmed the bleeding of votes a bit and picked up just a few more percent of the votes in either of those two counties, he’d have extended Georgia’s Republican presidential streak to seven elections. As it is, Joe Biden rode his gains in Gwinnett and Cobb to the first Democratic victory at the presidential level in Georgia in nearly 30 years.
The theme of suburban victories keyed by winning over college-educated voters was also perhaps the biggest story behind the shift in Minnesota, which saw one of the largest pro-Biden shifts among the 2020 battleground states. Although Obama won the state by 7.7% in 2012, Clinton won it by a mere 1.5% in 2016, and both campaigns thus considered Minnesota a key battleground in 2020. However, Biden carried it by an impressive 7.1%, earning over 350,000 more votes than Clinton and swinging critical areas of the state his way.
Map 3: Minnesota presidential swing, 2016-2020
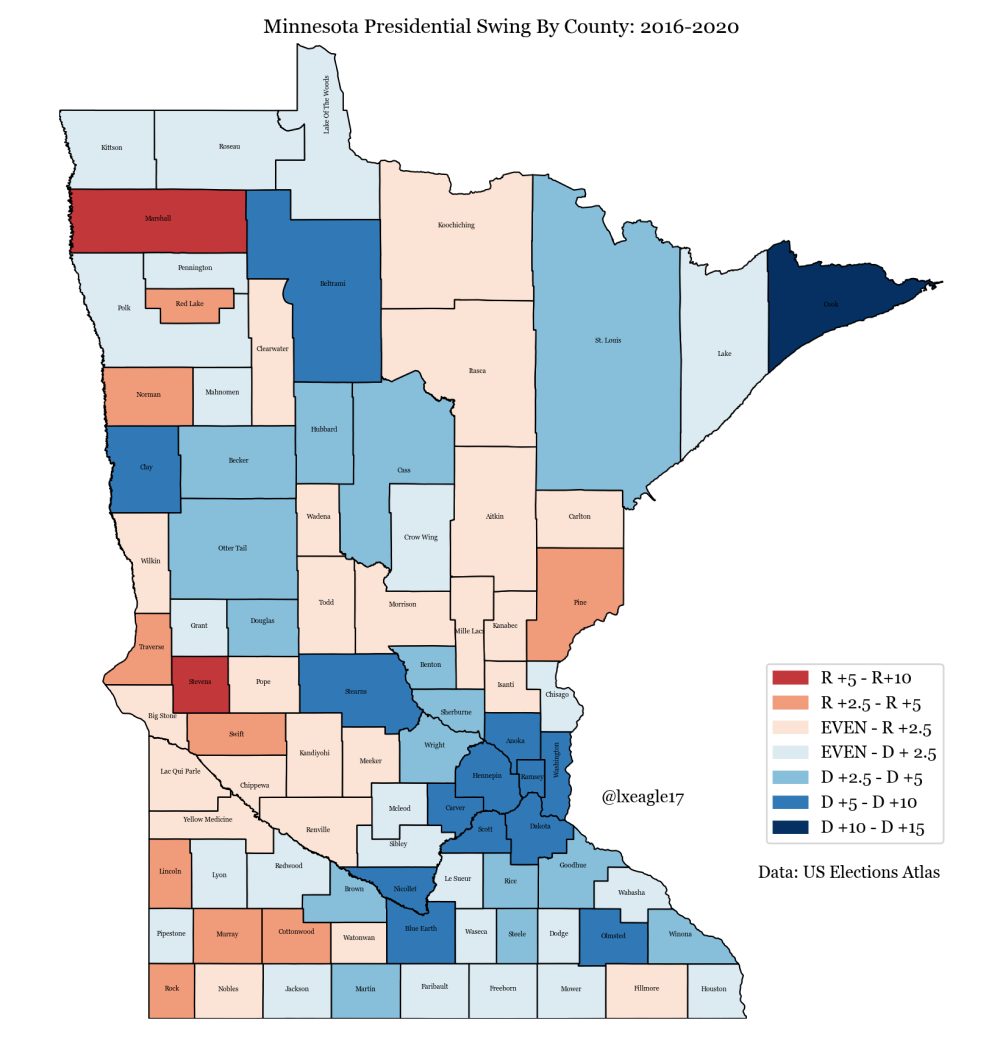
Looking under the hood a bit, we see that Biden’s Minnesota performance was keyed by gains in Hennepin (Minneapolis) and the four large surrounding suburban counties: Anoka, Ramsey, Washington and Dakota, all of which cast over 170,000 presidential votes apiece. In 2020, Biden ran at least a half-dozen points ahead of Clinton’s margin in all four counties; more concretely, he gained 25,000 votes in Anoka, 34,000 in Ramsey, 22,000 in Washington, and 35,000 in Dakota. These counties made up over a third of Biden’s vote increase from Clinton’s performance. Of these four counties, three went for Biden, and all three of those (Ramsey, Washington, and Dakota) have at least a 41.8% bachelors’ degree rate among their adult population.
This trend is even more visibly obvious in Colorado, which is second only to Massachusetts in percentage of residents with a bachelor’s degree. A pillar of the Republican’s Electoral College “lock” decades ago, Democrats have now won it in four straight elections, thanks to their gains with suburban voters. Based on two-party vote share, Crystal Ball Managing Editor Kyle Kondik found Colorado shifted 4.2% toward the Democrats from 2016 to 2020 in terms of two-party Democratic vote share, which was 0.5% greater than any other state.
Map 4: Colorado presidential swing, 2016-2020

Diving into the vote details, we see that the state’s leftward swing was fueled by immense suburban gains. Boulder, with a 62.1% bachelor degree rate for people over the age of 25, was the most educated county of the 75 suburban counties, and here, Biden ran 6.8% better than Clinton and 7.6% better than Obama did in 2012. In Jefferson County, which has a bachelor’s degree rate of 44.1%, Clinton ran around 2.4% behind Obama’s 2012 share. But Biden improved by around 9% on Clinton’s 2016 share and by around 6.6% on Obama’s 2012 win.
The trend continued across the Denver suburbs. Biden vastly improved in the counties of Arapahoe (42.8% college-educated) and Douglas (58% college-educated), as he ran over eight points ahead of Clinton’s margins and beat Obama’s vote share by 7.8 and 9.2 points, respectively. Interestingly enough, his suburban gains persisted in this state even as education levels dipped; for example, in Adams County, which has a degree rate of 24.8%, Clinton ran 6.2% behind Obama, but Biden reversed her shortfall there by finishing 6.8% ahead of Clinton’s vote share.
These large gains are key to understanding Biden’s incredibly strong victory in Colorado. Hillary Clinton won the state by a little over 136,000 votes, while Biden won it by around 440,000. But tellingly, in the five suburban counties surrounding Denver, Biden more than doubled Clinton’s vote margins. The strength of the suburban swing meant Colorado went blue by double-digits for the first time in over 50 years.
The trends we see in Georgia, Colorado, and Minnesota are, to some degree, a microcosm of what we find nationally and a reflection of a pattern emerging over the last decade. In counties where Biden ran behind Obama, education was a highly influential factor. Below, we can see that across all 75 suburban counties considered, there is a high degree of correlation between education rates and the net change in vote share between Biden and Obama; essentially, the more educated the county, the better Biden did.
Figure 1: Biden 2020 vs. Obama 2012 in big suburban counties

It’s worth noting that while the signs of educational polarization in voting emerged even more strongly in 2020, it certainly did not begin there; in fact, signs of it were visible in 2016. Clinton lacked Biden’s suburban strength and ran behind Obama in 36 suburban counties, but it’s worth noting that 23 of those counties where Clinton lagged had four-year-degree rates of fewer than 40% among voters, again showing the increasing correlation between voting preferences and education levels.
Whether Biden’s gains in the suburbs are durable is the difficult question for the Biden coalition (and, indeed, for the Democratic one at large). His strength across America’s well-populated and well-educated suburbs might portend a path for the Democratic Party to build a durable coalition with more regular turnout rates, which may bode well for them in midterm elections. Alternatively, it might be a reminder of the fleeting nature of political coalitions; after all, less than a decade ago, Mitt Romney won several of these very counties. As Georgia proved this year, streaks last until they don’t.
Footnote
[1] Elasticity is described in this Crystal Ball article. The set considered is the 2016 presidential race, the 2016 senatorial race, the 2018 gubernatorial race, and the 2020 presidential race.
| Lakshya Jain is a software engineer who recently graduated from UC Berkeley with a Masters’ in Computer Science, with a focus on machine learning. His data-centric background and political interest led him to analyze elections in his spare time. More of his analyses can be found at politicalsalad.com or on Twitter @LXEagle17.
Kendall Kaut is an assistant district attorney, sports editor, and freelance writer. He can be followed on Twitter @kendallkaut and analyzes elections at https://kendallkaut.substack.com/ |