KEY POINTS FROM THIS ARTICLE
— For all of the focus on redistricting, the overall political environment matters for House elections too, and President Biden has shown some signs of weakness in recent weeks.
— As we continue our redistricting series, we analyze several small-to-medium-sized states in the Interior West and Heartland.
— One of the overall things to watch in the region is the degree to which Republicans are aggressive in redistricting, even in a state — Iowa — known for a nonpartisan system.
A few words on Biden’s recent troubles
As we hope we’ve communicated in this ongoing series on congressional redistricting, the district lines are quite important in House election outcomes. Political trends in recent years — such as the decline of the incumbency advantage, more predictable partisanship, less ticket-splitting, and perhaps even technological advances — have all raised the stakes on redistricting, as we noted in the first part of this series.
But the maps are not quite everything. The political environment matters too, and it’s toward that which we’ll briefly turn before continuing our state-by-state analysis.
Even before this weekend’s sad developments in Afghanistan, in which the U.S.-backed government collapsed like a house of cards, President Biden’s approval rating had been falling a bit. He’s currently at a roughly 49% approve/44% disapprove spread in the FiveThirtyEight average. That’s not much different from earlier this summer, but it is marginally worse: the 49% approval is the lowest of his presidency so far, and the 44% disapproval is the highest. Biden’s approval had been at least 10 points higher than his disapproval in the average for much of his presidency prior to August.
What’s driving Biden’s weaker numbers? It could be any number of things — the public’s perception of inflation, crime, illegal immigration, and/or COVID-19 — or maybe it’s all of these things coming together. It may be that Biden’s numbers also take a hit from what happened in Afghanistan, although we doubt the American withdrawal, specifically, will be a major focus of next year’s midterm election. When South Vietnam collapsed in spring 1975, that blow to American prestige was not really a big issue in the 1976 presidential campaign, and that conflict touched the lives of a much larger percentage of Americans than Afghanistan has. President Gerald Ford, who was president at the time, actually saw his approval rating improve in the weeks following the fall of Saigon, as our friend Ed Kilgore noted in New York magazine.
This is important to monitor for the midterm. Democrats are already on thin ice in the House, for a number of reasons. Republicans should be strengthened by redistricting on balance (as we’ve been documenting in this series). The president’s party often struggles in midterms. This cycle’s candidate announcements have generally been better for Republicans than Democrats — the GOP has had many more narrow losers from 2020 already announce they are running again next year. Retirements have hurt Democrats more than Republicans: Reps. Cheri Bustos (D, IL-17) and, now, Ron Kind (D, WI-3), two of the seven Democrats in Donald Trump-won seats, are heading for the exits. Some signs of a lack of Democratic engagement, which bedeviled the party in their midterm debacles of 2010 and 2014, are emerging. For instance, to the extent that Gov. Gavin Newsom (D-CA) is in trouble in next month’s recall vote — and there are several signs that the race is indeed close or at the very least competitive — it’s because polling indicates that Newsom is doing worse among likely voters in polls than the larger universe of registered voters, a sure sign of an enthusiasm problem that Newsom will be spending the next four weeks trying to correct.
We bring all this up in the context of redistricting just to say that while the lines matter, the circumstances of the election matter too. While line-drawers hold a good deal of power over who wins and who loses, that power is not absolute in every race for every district. For instance, one of the states we discuss this week is Kansas, where Republicans may or may not try to draw Rep. Sharice Davids (D, KS-3) a much more competitive seat in the Kansas City suburbs. It’s possible that they’ll decide not to dramatically alter her district. However, with the right challenger and in a bad enough environment for Democrats, it’s not out of the question to think she could lose as her district is currently drawn. The district did vote for Biden by 11 points, which gives Davids considerable cushion, but Democrats flipped a half-dozen districts in their own 2018 wave that voted for Donald Trump by a similar margin or more.
While it is true that redistricting could be enough on its own to win Republicans the House, they very well could win the House by significantly more. The political environment, driven by perceptions of the president, will play a significant role in whether that occurs. This is why the big-picture political environment matters even though the focus right now, particularly after the release of the 2020 census information last week, is on the granular details of redistricting.
This week, we’re looking at eight states in the Interior West and Heartland: Colorado, Idaho, Iowa, Kansas, Missouri, Montana, Nebraska, and Utah. None of these states are large — the biggest delegations, with eight members for this decade, are in Colorado and Missouri — but mappers in almost all of them face consequential choices.
COLORADO
Number of seats: 8 (+1 from 2010s)
Party breakdown in 2012: 4-3 R
Current party breakdown: 4-3 D
Most overpopulated district: CO-4 (Eastern Colorado)
Most underpopulated district: CO-3 (Western Slope/Pueblo)
Who controls redistricting: Commission
2012 control: Split
Colorado is one of the states where Democrats are kicking themselves for getting behind an independent/nonpartisan redistricting process last decade. Because Democrats now control state government, they could have gerrymandered the state, grabbing the state’s new, eighth seat and otherwise working to expand their current 4-3 edge in the delegation. But Colorado has a commission now, and it is really the only state so far where there’s already a working draft of the map. We analyzed this map in great detail when it was released, so for those who want to know more about the Colorado details, just look back at that piece. This map would, in most years, result in a 5-3 Democratic delegation. However, it will at the very least have to be tweaked slightly, because the map was drawn based on census estimates, not the actual census numbers. As political scientist Michael McDonald noted, the map draft likely has too much population deviation among districts to pass judicial muster.
We’ll continue to follow developments in Colorado, but let’s move on to other states that don’t have draft maps already.
IDAHO
Number of seats: 2 (no change from 2010s)
Party breakdown in 2012: 2-0 R
Current party breakdown: 2-0 R
Most overpopulated district: ID-1 (Western Idaho)
Most underpopulated district: ID-2 (Eastern Idaho)
Who controls redistricting: Commission
2012 control: Commission
Even though Idaho is one of the most Republican states in the Union, Democrats will have a seat at the table in redistricting thanks to the state’s commission system. The commission consists of three Republicans and three Democrats.
The commissioners will have to shift population from the growing 1st District, which contains the state’s distinctive northern panhandle, to the slower-growing 2nd District. The current plan splits Ada County, home to a bit more than a quarter of the state’s population and the state’s capital, Boise. Joe Biden came within four points of carrying the county — the closest any Democrat has come since World War II. But even a radically-remade Idaho congressional map that united Ada County still would need to add considerably more population, and the county is surrounded by considerably redder counties. In any event, we wouldn’t expect the lines to change much, and both districts are heavily Republican: ID-1 voted for Donald Trump by 37 points, and ID-2 voted for him by 24 points. So even as ID-2 seems likelier to take on more of the Boise area to balance out the population of the two districts, it should still be a Safe Republican seat. Trump won Idaho overall by 31 points, his fifth-best state (neighboring Wyoming was his best).
Idaho is the nation’s second-fastest-growing state, and it’s not out of the realm of possibility that it could add a third seat in the 2030 reapportionment. Randy Stapilus, a former Idaho newspaper reporter, speculated in a May column about what a three-district Idaho map might look like. One possibility would be to combine Ada with neighboring Canyon County, both fast-growing counties that together could have roughly the proper population size if the state had three districts. But Trump would have carried that hypothetical district by 13 points, which is a good illustration of the GOP strength in Idaho even in its most populated area.
IOWA
Number of seats: 4 (no change from 2010s)
Party breakdown in 2012: 2-2 split
Current party breakdown: 3-1 R
Most overpopulated district: IA-3 (Des Moines, Southwest Iowa)
Most underpopulated district: IA-4 (Northwest Iowa)
Who controls redistricting: Republicans
2012 control: Split
Iowa typically has one of the cleanest redistricting processes in the country. The state’s nonpartisan Legislative Services Agency drafts the maps, and the state legislature can either accept them as drawn or ask for a second draft. The legislature then decides on the second draft from the LSA, which it can accept or reject but not modify. Only if the legislature rejects a third draft can legislators modify the maps themselves.
This process has been in place since the 1980 census, but Republicans control state government and hypothetically could gerrymander — there is a strong norm in Iowa toward nonpartisan redistricting, but norms are not legally binding. The LSA should have the first map drafts in place by Sept. 16, which means the state appears as though it will miss a state constitutional deadline for finalizing the maps. However, there are indications that the Iowa Supreme Court, which is tasked with drawing the maps if the state misses the deadline, will allow the usual process to unfold. Iowa law also requires the state’s maps to be compact, to the extent possible, and the state preserves whole counties in congressional redistricting (Iowa, along with West Virginia, is the only state with more than one House district that does not have any split counties among its districts).
The current map has featured consistent competition. Three of the state’s four districts (IA-1, IA-2, and IA-3) changed hands at least once last decade, and even the fourth, IA-4, which is markedly more Republican than the others, has been competitive, thanks in part to the weakness of controversial former Rep. Steve King (R), who lost a primary in 2020. Democrats won three of the four districts in 2018. Republicans won two back last year, boosted by another strong performance by Donald Trump in Iowa. One of those two victories was by just six votes in IA-2.
Trump carried IA-4 by 27 points, but the other three districts are marginal: Trump’s margins in IA-1 and 2 were 3.5 and 4 points, respectively, and only a couple tenths of a percentage point in IA-3, held by Rep. Cindy Axne (D), the lone Democrat in the state’s congressional delegation.
IA-3 is the only one of the state’s four congressional districts that is overpopulated (by roughly 60,000 people). The most underpopulated district is IA-4, which covers the northwestern part of the state and is the state’s most Republican district. It needs to add about 30,000 people, and the two eastern districts, IA-1 and IA-2, each need to add roughly 17,000 and 12,000 people, respectively. Des Moines (Polk County) and its most populous surrounding county, Dallas (a growing, Republican-but-Democratic-trending part of the Des Moines area), form the core of IA-3. They have, combined, close to 600,000 residents, about three-quarters of the roughly 800,000 needed for one of the four Iowa congressional districts.
So one possible outcome is that IA-3 sheds some of its sparsely-populated and Republican rural counties. It would still be a swing district, but it wouldn’t take much to turn it into a Biden-won seat. Democrats probably would be happy if two neighboring eastern Iowa Democratic counties, Linn (Cedar Rapids) and Johnson (Iowa City/University of Iowa), were united in the same district (they are currently split between IA-1 and IA-2). Republicans, meanwhile, should reasonably believe they would have a good chance of a 4-0 delegation, at least in 2022, if the maps don’t change all that much. IA-4 is solid with new incumbent Rep. Randy Feenstra replacing the outrageously offensive King, first-term Reps. Ashley Hinson (R, IA-1) and Mariannette Miller-Meeks (R, IA-2) have a decent chance to hold Trump-won seats in a midterm environment with a Democrat in the White House (although Hinson has drawn a credible challenger), and IA-3 should be among the most vulnerable Democratic districts next year absent a significant assist from redistricting.
If Republicans end up drawing the maps, they could try to improve their chances of winning a 4-0 edge or, if they wanted to be conservative, could try to lock in a durable 3-1 delegation by creating something of a Democratic vote sink, perhaps connecting Des Moines to Iowa City while strengthening the new Republican incumbents in the eastern districts.
KANSAS
Number of seats: 4 (no change from 2010s)
Party breakdown in 2012: 4-0 R
Current party breakdown: 3-1 R
Most overpopulated district: KS-3 (Kansas City suburbs)
Most underpopulated district: KS-1 (Rural west)
Who controls redistricting? Republicans
2012 control: Republicans
When it comes to congressional redistricting, Kansas may be to Republicans what New Mexico is to Democrats. In these small states, the party that controls redistricting may go after the delegation’s lone minority party member — but doing so can be risky, and an aggressive plan may have some cumbersome logistical hurdles.
During the first decade of the 2000s, Democrats held KS-3, in the Kansas City suburbs, with veteran Blue Dog Dennis Moore (D, KS-3) and, for a term, rented the adjacent KS-2. In 2006, Rep. Jim Ryun (R, KS-2) seemed blindsided by the anti-Republican tenor of the cycle, as Democrat Nancy Boyda beat him 51%-47% to represent a seat that contained wide swaths of eastern Kansas. The next cycle, Republicans made the race a priority; in a reversal of 2006, state Treasurer Lynn Jenkins ran against Boyda and won 51%-46% — this was one of House Republicans’ few pickups in an otherwise grim cycle. Republicans have held KS-2 since then, and in 2010, as Moore retired, his KS-3 fell into Republican hands.
Though some conservative Republicans pushed for an aggressive map, they ran into resistance from some in their own party, as well as Democrats — over the last decade, warring between moderates and conservatives has defined Kansas Republican politics. When the situation ended up in the courts, a map that avoided large-scale changes was enacted (though they redrew KS-3, which favored Barack Obama 51%-48% in 2008, into a seat that gave John McCain a slight edge).
While the ultimate map was tamer than what some conservative partisans had pushed for, during the first three cycles of the decade, it still worked out fine for Republicans. Between 2012, 2014, and 2016, all GOP congressional nominees won by double-digits each cycle. In fact, some of the most-watched congressional races in Kansas were internecine. In 2014, Rep. Mike Pompeo (R, KS-4) easily beat back a primary challenge from his predecessor, Todd Tiahrt. Then, in 2016, and with help from the Farm Bureau, first-time candidate Roger Marshall primaried then-Rep. Tim Huelskamp (R, KS-1), a Tea Party bomb thrower who was an irritant to GOP leadership. (Marshall just won election to the Senate last year.)
After the 2016 election, Pompeo was tapped to serve in the Trump Administration. In a nationally watched April 2017 special election, then-state Treasurer Ron Estes held Pompeo’s Wichita-area seat by only a 52%-46% margin — that result was down markedly from the 27-point spread Trump posted in the district, and, with the midterms on the horizon, was seen as a harbinger of Democratic enthusiasm.
Ironically, Estes ended up being fine in the 2018 regular election, but Democratic gains materialized elsewhere in the state. As the suburbs soured on Trump, Democrats regained KS-3: Democrat Sharice Davids ousted then-Rep. Kevin Yoder (R, KS-3) by nearly 10 points. Democrats also only narrowly missed out on KS-2 — though the district contains the blue cities of Lawrence and Topeka, it has about two-dozen counties that are considerably redder. In 2020, no seats changed hands.
On paper, Republicans hold veto-proof majorities in the state legislature, and some of their members have entertained the idea of a 4-0 GOP map. Democrats have some leverage, though. Some Republicans may balk at a map that is too aggressive — in other words, a replay of last decade may be in the cards. There could be enough GOP defections to defeat a plan targeting Davids, or to sustain Gov. Laura Kelly’s (D-KS) veto of such a plan. Moreover, five of the seven justices on the state Supreme Court were appointed by Democratic governors, so Republicans may not find a sympathetic audience if their plans end up in court.
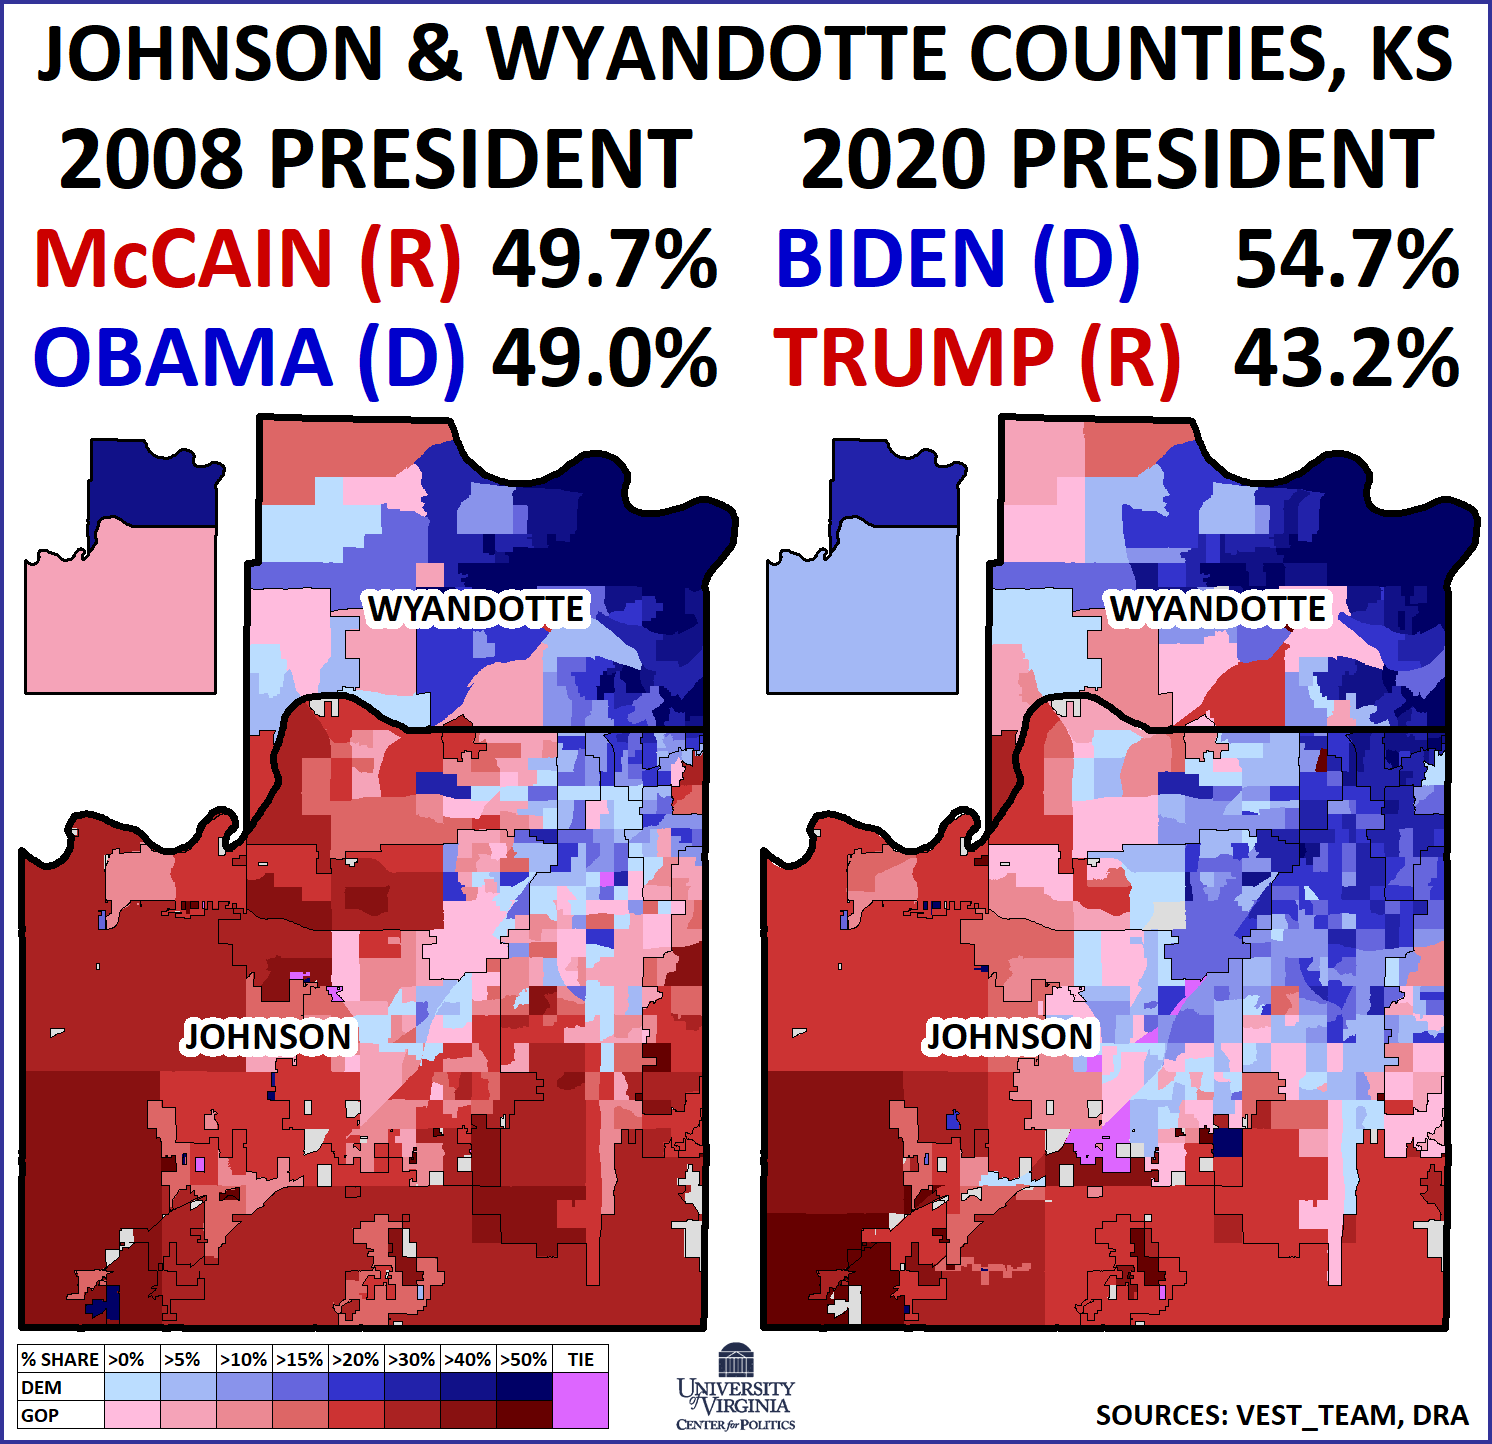
Given the demographic and electoral trends in KS-3, Republicans may be best served keeping the district as a Democratic sink, anyway. Since 1982, KS-3 has contained both Johnson and Wyandotte counties in their entirety — the former includes populous suburbs like Olathe and Overland Park, while the latter takes in a part of Kansas City proper. A decade ago, the pair was just 12,000 residents short of a full congressional district (so KS-3 picked up a few precincts in Miami County, to the south), and they went for McCain by a 49.7% to 49.0% margin in 2008. Today, the Johnson/Wyandotte pair is 45,000 residents *too large* for a single district, and together they supported Biden by nearly 12 points in 2020.
Map 1: Johnson and Wyandotte counties, KS
Whether Republicans target KS-3 or not, they could insulate their own incumbents by unpacking the “Big First.” Based out in western Kansas, KS-1 is the reddest district in the state. Seven of Kansas’ 10 most recent senators have come from within the borders of the existing KS-1, including its current pair and former Senate Majority Leader Bob Dole (R-KS). The Big First has been losing population for decades and will need to take in more territory regardless — in fact, many counties in western Kansas have fewer residents today than they did in 1920.
Southwestern Kansas (contained the Big First) is home to a growing Hispanic population, but this has not necessarily translated into Democratic gains. By composition, Grant County is now 52.5% Hispanic, up from 44% a decade ago — but two-thirds of registered voters there are white, and Trump claimed over three-quarters of the vote there each time he was on the general election ballot.
Republicans could give Topeka (Shawnee County) to KS-1, to boost first-term Rep. Jacob LaTurner (R, KS-2); in that case, both districts would give Trump over 60% of the vote. But even with Topeka, something like the current KS-2 would still have given Trump a share somewhere in the mid-50s — considering parts of southeastern Kansas have trended GOP anyway, LaTurner may not want to take on too much new territory.
Finally, under a 3-1 map, KS-4 will probably stay somewhere around Trump +20%. Sedgwick County (Wichita), which makes up about 70% of a district, gave Trump a 54%-43% margin, while its rural counties are even redder.
If Republicans wanted to push their luck, there are any number of ways the Kansas City area could be diluted among the other districts — but we’ll have to see if they actually take the plunge.
MISSOURI
Number of seats: 8 (no change from 2010s)
Party breakdown in 2012: 6-2 R
Current party breakdown: 6-2 R
Most overpopulated district: MO-3 (St. Louis exurbs/Jefferson City)
Most underpopulated district: MO-1 (St. Louis proper)
Who controls redistricting? Republicans
2012 control: Split
In Missouri, redistricting may be more straightforward this cycle than a decade ago. In 2011, as the state lost a seat, a Republican-controlled legislature overrode the veto of Gov. Jay Nixon (D-MO), with help from a handful of Democrats, to pass a plan favorable to then-Rep. Lacy Clay (D, MO-1) and Rep. Emanuel Cleaver (D, MO-5). While those two Democrats were given comfortable seats, another Democrat, then-Rep. Russ Carnahan, saw his MO-3 dismantled, and six Republican seats were preserved.
The first goal of Missouri Republicans this cycle will be to strengthen five-term Rep. Ann Wagner (R, MO-2). The majority of MO-2 comes from St. Louis County, while it takes in about half of St. Charles County, to the north, and a few more working-class neighborhoods of Jefferson County, to the south. From 2012 to 2016, Wagner won by over 20% each cycle. In 2018, Democrats saw some positive signs in the district: though then-Sen. Claire McCaskill (D-MO) was ousted, she carried MO-2 by about 2.5 points, and Wagner was held to a 51%-47% margin.
Encouraged by the close 2018 race in MO-2, Democrats landed a strong recruit in state Sen. Jill Schupp for the 2020 cycle. But in the suburbs, most non-incumbent (and many incumbent) Democrats ran behind Biden — this was the case in St. Louis. As Trump narrowly held the seat (it was split almost exactly 50/50), Wagner won by a 52%-46% margin. This was an impressive showing, to be sure, but it was not the type of landslide margin that defined Wagner’s earlier races.
Population dynamics will make the GOP mappers’ jobs easier: next door, MO-1, held by first-term Democratic Rep. Cori Bush, will need to pick up nearly 50,000 residents. This shrinking majority-minority seat can expand to take in Democratic-leaning precincts from MO-2. While it may be hard to sustain MO-1 as a true Black-majority seat (our estimates show that it will likely fall to about 49% Black, by composition), it is not in the GOP’s interest to radically alter it.
Though MO-2 can easily pick up redder rural areas, Wagner may want the district to retain its St. Louis-area focus, as too much new territory may give an opening to a primary challenger. Map 2 shows a potential new MO-2: like the 2002 to 2010 version of the district, it reaches back up to Lincoln County. About 60% of the hypothetical MO-2 is in Wagner’s existing seat, and McCaskill would have lost it by over six points.
Map 2: Hypothetical Republican MO-2 gerrymander

On the other side of the state, Republicans could theoretically target Cleaver, in the Kansas City area — in fact, to its south, both the ruby red MO-4 and MO-7 are open seats (their incumbents are each running for Senate), so legislators could move more Democrats into those seats without having to worry about protests from incumbents. Unlike MO-1, MO-5 is majority-white, so racial considerations would take on less salience. Still, Cleaver, as demonstrated during the last round of redistricting, seems to have a good enough rapport with the legislature, and Republicans could choose to turn his MO-5 into more of a Democratic vote sink. This is one of several blue islands in otherwise Republican states to watch as a measure of how collectively aggressive Republican gerrymandering efforts are.
While Missouri voters approved some redistricting-related changes in 2018 and 2020, congressional redistricting will still be controlled by legislative Republicans, although legislative redistricting will be handled by a bipartisan commission.
MONTANA
Number of seats: 2 (+1 from 2010s)
Party breakdown in 2012: 1-0 R
Current party breakdown: 1-0 R
Most overpopulated district: N/A
Most underpopulated district: N/A
Who controls redistricting: Commission
2012 control: N/A
For Montana, 2022 will mark a return to the 1980s: after a 30-year hiatus, the state’s 2nd District will be making a return. Montana was admitted to the Union in 1889, and for the first two decades of statehood, it sent one at-large member to the House. Then, after the 1910 census, it was awarded a second district, which it kept until the 1990 census.
Historically, Montana’s politics fell along an east-versus-west axis: ranchers, who settled the east, favored Republicans while the west, where the mining industry gave way to a tradition of organized labor, favored Democrats. The state’s 1990 congressional results — this was the last year before it went down to one seat — reflected this split. In MT-1, then the western seat, Democratic Rep. Pat Williams had an unshakable rapport with the state AFL-CIO, while out east, MT-2’s Rep. Ron Marlenee was a mainstream Republican who tended to agricultural interests. Though Williams won the contest for the at-large seat in 1992, he retired in 1996, and Republicans have held the seat since.
Though Republicans captured the governor’s mansion last year to claim a governmental trifecta, redistricting in the state is handled by a bipartisan commission. If Republicans had sole control over the process, they’d probably favor two districts running horizontally across the state — this way, both districts would be fairly reflective of the statewide vote, and would thus be reliably Republican.
The commission could theoretically take a similar approach, but given the state’s cultural and political history, an east/west pair seems more logical. Essentially, any western district that contains the cities of Missoula and Butte would, in all likelihood, have favored Trump last year by single-digits, though such a district may be open to down-ballot Democrats. Virtually any eastern seat would be notably redder than the state as a whole.
Conveniently for the GOP, an east/west split could very well precipitate a two-Republican delegation. Republican Rep Matt Rosendale, who was elected to the at-large seat last year, is from Dawson County, which is just miles from the North Dakota border — he could easily win an eastern seat. Former Rep. Ryan Zinke, who represented the state for a term before serving as former President Trump’s Interior Secretary, is eyeing a comeback. Zinke hails from Flathead County, which is not far from the Idaho border, and would be a formidable candidate for a western district.
So the bottom line for Montana is that, an eastern district would start out as Safe Republican while the Crystal Ball would probably rate a western-based seat as Leans or Likely Republican.
NEBRASKA
Number of seats: 3 (no change from 2010s)
Party breakdown in 2012: 3-0 R
Current party breakdown: 3-0 R
Most overpopulated district: NE-2 (Omaha)
Most underpopulated district: NE-3 (Rural west)
Who controls redistricting? Republicans
2012 Control: Republicans
In Nebraska, the unicameral legislature is nominally nonpartisan, but it’s generally considered that a clear majority of its members lean Republican. Though a status quo map may ultimately get passed, presidential politics may weigh on the minds of legislators: Nebraska, along with Maine, is one of two states that allocate its electoral votes based on congressional-level returns.
One of the biggest surprises of the 2008 election was that then-candidate Barack Obama carried the Omaha-based NE-2. During the redistricting process, the legislature tinkered with NE-2’s borders, so that the new seat would have given Obama a reduced margin in 2008, but the district was still one mostly based in Omaha’s Douglas County. In 2012, as Obama lost Douglas County overall by three points, NE-2 wound up in Mitt Romney’s column. Though Hillary Clinton carried Douglas County by two points in 2016, the district contains a chunk of neighboring Sarpy County, to the south — these precincts are redder and provided Trump’s 47%-45% margin in the district. But by 2020, powered by gains with college-educated whites in Omaha, Biden carried the district by almost seven percentage points.
Though Biden carried NE-2, Rep. Don Bacon (R, NE-2) held on by a similar margin — he was also a survivor of the 2018 Democratic wave. Though Bacon has generated impressive crossover support in recent cycles, if mappers want to keep Douglas County whole, it will be hard to shore him up. Douglas County alone now makes up about 87% of a full district, up from 85% last decade — so to meet the population requirement, the legislature would have to append fewer red precincts from Sarpy or any other adjacent county. Under an aggressive plan, Omaha’s majority-minority precincts could be moved into other districts, creating a Trump-won NE-2, but such a plan may trigger litigation.
Out west, Nebraska’s 3rd, like Kansas’s 1st, is a geographically vast seat that has been steadily depopulating. As an aside, though it is solid red today, NE-3 saw competitive races in three of the last four instances it was open. In 1974, when the GOP faced backlash over Watergate, Virginia Smith held the seat by just half a point — when she retired, in 1990, as their statewide candidates were running well, Democrats came up only 2% short in NE-3. Current Rep. Adrian Smith (R, NE-3) won the seat 55%-45% in 2006, as then-President Bush carried it 3:1 two years earlier. Though once elected, each of its Republican members became entrenched, they fought their races on expanding terrain: when Virginia Smith was first elected, NE-3 only extended a few counties east of Grand Island, the largest city in the district — it now shares borders with Iowa and Missouri.
In between districts 2 and 3, NE-1 will have to shed a few thousand residents. As it is, about half the district comes from Lancaster County, which includes the state capital, Lincoln. Romney and Clinton each carried the county by a few hundred votes apiece, but Biden’s nearly 8-point margin there was the best showing for a Democrat since Lyndon Johnson. Still, the rest of NE-1 is overwhelmingly GOP, and any similar district would likely favor Trump by anywhere from 12 to 15 percentage points. If the legislature cracks Douglas County, mappers would be wise to avoid putting too many Democrats in NE-1.
So in Nebraska, the big question seems to be whether or not Douglas County gets cracked. The legislature could theoretically create three Trump-won seats, but if Democrats come to view a redrawn NE-2 as a lost cause, Nebraska may become completely irrelevant in presidential politics. One other wrinkle in Nebraska is that Republicans do not quite have the two-thirds legislative majority required to override a Democratic filibuster, which Democrats could use to try to combat a Republican gerrymander.
UTAH
Number of seats: 4 (no change from 2010s)
Party breakdown in 2012: 3-1 R
Current party breakdown: 4-0 R
Most overpopulated district: UT-4 (Salt Lake City suburbs, Central Utah)
Most underpopulated district: UT-3 (Provo, Southeast Utah)
Who controls redistricting: Republicans
2012 control: Republicans
One feature of the Republicans’ better-than-expected performance in the 2020 elections was them capturing some seats that they may have been able to use gerrymandering to target in 2022. A good example is UT-4, which over the course of the 2010s was the only competitive district in the state. Democrats won it in 2012 and 2018, while Republicans won it in 2014, 2016, and 2020, when now-Rep. Burgess Owens (R) defeated then-Rep. Ben McAdams (D) by a percentage point. Owens’s victory restored a 4-0 Republican House delegation in Utah — meaning that there’s no way for Republicans to do better than that in 2022.
Now, instead of targeting McAdams for defeat in 2022 — much as Republicans tried to do to Democrat Jim Matheson in 2012 — the Republican focus will be on protecting Owens and trying to ensure the 4-0 GOP edge endures throughout the decade.
Despite being the clear minority party in Utah, Democrats have often competed credibly for Utah House seats. Over the last six decades, going back to 1962, Utah has elected at least one Democrat to the House in 19 of 30 elections, and Democrats held a majority of the state’s seats in the early 1970s and early 1990s. Fast-growing Utah added a third House seat in the 1980 reapportionment, and a fourth in the 2010 reapportionment after very narrowly missing out on it in the 2000 census (that seat went to North Carolina instead, as Utahns complained that Mormon missionaries abroad were not counted).
In 2018, Utah voters narrowly voted to create an independent redistricting commission. However, this commission does not have final authority on the maps — rather, the state’s Republican-controlled legislature does. That’s why our expectation is that they will work to protect Owens, the only member who sits in a competitive district.
A common issue in Utah redistricting is what to do with Salt Lake County, home of the state’s capital and roughly 35% of the state’s population. Like many other big counties, Salt Lake has taken a turn toward the Democrats in recent years. In 2008, Barack Obama was the first Democrat to carry the county for president since Lyndon Johnson in 1964, albeit only by about a tenth of a percentage point. Mitt Romney, who like the majority of Utah residents is a Mormon, then carried the county by 20 points. But Donald Trump was a weaker GOP nominee for Utah, and Salt Lake County voted for Hillary Clinton by nine and Joe Biden by 11.
A guiding principle of Utah Republican redistricting strategy, for decades, has been that all of the state’s districts should contain both urban and rural portions. That position, particularly now, has become politically self-serving, as Democrats would likely win and be able to hold a district that was included entirely in Salt Lake County. As it stands now, all four of the state’s districts contain at least some of the Salt Lake metro area. In the 2012 redistricting round, Utah accommodated its fourth seat by further splitting Salt Lake County, which was designed to knock out the aforementioned Matheson. Surprisingly, Matheson held on in 2012, but he retired in 2014. The district has featured competitive races since then, but Democrats only broke through in 2018.
One thing that could aid Republicans in their quest to lock in a 4-0 delegation is that last week’s census release revealed that deeply Republican Utah County, the state’s second-most-populous county and home to Brigham Young University in Provo, was growing faster than the state as a whole. Utah County’s growth is especially impressive because Utah, which grew by over 18% over the past decade, was the fastest-growing state in the Union. Meanwhile, Salt Lake County was growing slower than the state as a whole. On the other hand, UT-4 itself, as currently drawn, is the only one of the state’s four districts that is overpopulated, while the other three need to gain population. Republicans also need to be mindful of preserving their strength in UT-2, the district that actually covers most of Salt Lake City proper: Donald Trump won UT-2 by 16 points, and UT-4 by nine. Weakening Republican performance in UT-2 to shore up UT-4 could hypothetically make it competitive under the right circumstances. Fortunately for Republicans, the state’s other two districts are much more deeply Republican: Trump won northern Utah-based UT-1 by 33 points and the central/southeastern-based UT-3 (which includes Provo) by 25 points.
The current Utah districts are sometimes compared to pizza slices or even spokes on a wheel. Turning the wheel a little bit might do the trick for Republicans, although there may come a time in the future where the party cuts its losses and just draws a Democratic vote sink covering most of Salt Lake County. Had McAdams won, maybe they would have considered that. But with a 4-0 delegation, they should be OK just by modifying the current districts.
Conclusion
Collectively, this group of eight states leans Republican: Donald Trump carried seven of the eight, losing only Colorado. Democrats should be able to pick up the new seat there, but they otherwise probably will remain disappointed that they aren’t drawing the lines themselves. Republicans likely will compensate by winning the new seat in Montana, although a western seat likely will be competitive and perhaps winnable for Democrats under the right circumstances. Otherwise, the story in many of the other states involves whether Democrats can hold onto seats in places like Des Moines and Kansas City, and how much harder (or easier) redistricting makes that task.