KEY POINTS FROM THIS ARTICLE:
— Given that Democrats only hold a single-digit majority in the House of Representatives, the 2022 midterms will be extremely competitive.
— The generic ballot is the best tool for forecasting the House popular vote, and is especially useful in cycles without presidential races atop the ballot.
— From 2004 to 2020, a 1% increase in a party’s share of the generic ballot has translated to an average 0.87% bump in the House popular vote.
The 2022 midterms begin
The 117th Congress was sworn into office just over a month ago, and yet the 2022 midterms are already underway. Some defeated incumbents have already announced that they want a rematch in 2022, and candidates in competitive districts will soon start calling donors and building out their campaign staff.
After a surprise loss of 13 seats in the House of Representatives this November, congressional Democrats will need to break one of the most reliable trends in electoral politics if they are to hold their House majority. The president’s party almost always gets crushed in midterms and has lost an average of 33 seats over the last 40 cycles. Given that Democrats only won a 222-213 majority in the 2020 elections, they will have little room for error.
Pollsters will soon pivot to 2022
Once the dust has settled from Biden’s first weeks in office, pollsters will turn their attention to 2022. In presidential election cycles, the top of the ticket can be a go-to indicator of how the parties will fare down-ballot — in 2020, the 50.8% share that House Democrats earned was close to Biden’s 51.3% popular vote share. It may also be worth noting that, on Election Day, both Biden and House Democrats earned margins that were several points below their national polling projections. But in midterms, there are no presidential polls to extrapolate from. Instead, pollsters and pundits have to rely on the House generic ballot.
The generic ballot tries to measure the House popular vote — the cumulative share of the popular vote that each party will win in down-ballot House races. To do this, pollsters ask respondents to choose between a nameless Republican and Democrat for Congress. Gallup phrases it this way: “If the elections for Congress were being held today, which party’s candidate would you vote for in your congressional district — the Democratic Party’s candidate or the Republican Party’s candidate?” It measures national support for the two parties without some of the baggage carried by their polarizing national figures (think Donald Trump, Joe Biden, Mitch McConnell, Nancy Pelosi, Alexandria Ocasio-Cortez, etc.).
Two caveats
Keep these two caveats in when looking at the generic ballot:
1) The makeup of the House of Representatives is not determined by the popular vote. Seat apportionment, gerrymandering, demographic and partisan sorting, and other structural imbalances mean that a party’s share of the national House vote can differ substantially from the share of seats they actually win. If you’re interested, I covered that in this Crystal Ball article from September 2019.
2) The data below is from polls taken within a few days of the elections. We’re still 22 months away from November 2022, and a lot can change in that time. Consider, for example, that two years ago, none of us had heard of COVID-19 and wouldn’t for another year.
Still, we won’t get individual polls from each of the nation’s 435 House districts, and we can’t fast forward to November 2022, so we settle for the generic ballot.
The generic ballot is pretty accurate…and getting better
Despite polls missing the mark again this year (although some pundits, including FiveThirtyEight’s Nate Silver, argue that they were pretty normal), they’re still our most powerful tool for forecasting elections.
Table 1 compares the Democratic lead in the generic ballot to their actual margin in the House popular vote. The generic ballot data from 1968 to 2000 is from Gallup’s final pre-election poll and only includes presidential years. The data from 2004 to 2020 is from the RealClearPolitics final generic ballot average before the election.
Table 1: The generic ballot versus the two-party House popular vote (1968 – 2020)
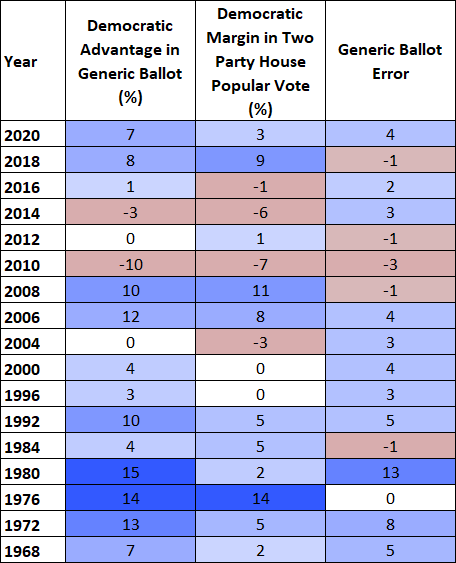
Source: 1968 – 2000 Gallup, 2004 – 2020 RealClearPolitics
Notes: Gallup’s generic ballot data from 1968 – 2000 is sometimes based on registered voters and sometimes a likely voter model. There was no final generic ballot poll from Gallup in 1988. When possible, the likely voter model was used. But for some years, only the registered voter poll was available. All data is rounded to the nearest whole number.
Figure 1 is a linear regression showing the same data from Table 1.
Figure 1: The generic ballot versus the two-party House popular vote (1968 – 2020)
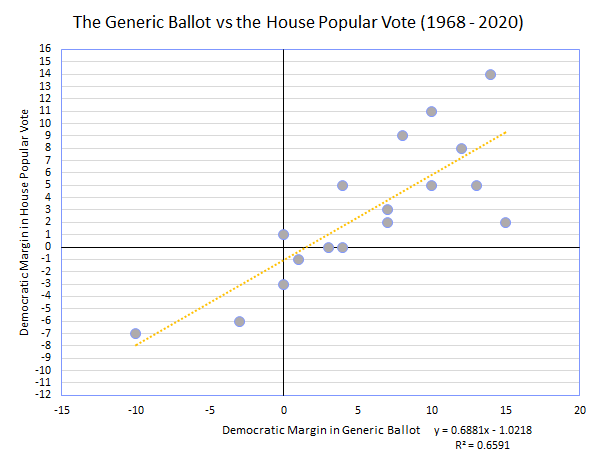
Source: 1968 – 2000 Gallup, 2004 – 2020 RealClearPolitics
Since 1968, the generic ballot has missed the real House popular vote by an average of 4%, and until 2008, it consistently overestimated Democratic support. Pollsters have mostly fixed both of these problems, and the generic ballot has been more accurate and balanced since the mid-aughts.
A party that performs better on the generic ballot will generally earn more votes in the election. The R-squared in the bottom right corner indicates how much of the variance in the dependent variable (Democratic Margin in the Two-Party Vote) can be explained by variance in the independent variable (Democratic Margin in Generic Ballot). In plain English: R-squared shows how well Variable 1 can explain or predict Variable 2. Here, R-squared comes out to 0.66, meaning that the generic ballot predicts about two-thirds of the variance in the popular vote.
Looking at the equation on the graph above the R-squared value, the trendline has a slope of 0.69. This means that, in general, a 1% increase in a party’s margin in the generic ballot translates to about a 0.69% bump in the House popular vote. There is still plenty of variation (see how the data points are not clustered too closely along the trendline), and this is an average, so it is not always true for any individual election.
The generic ballot since 2004
The generic ballot data has been even more accurate since RealClearPolitics began aggregating polls in 2004. This data is shown in Table 2 and Figure 2 below. The average error in these nine elections was only 2% and the R-squared — again, how well the generic ballot predicts the House popular vote — rose to 0.86. Just as significant is the slope of the line in Figure 2, which bumped up to 0.87. This shows that from 2004 to 2020, a 1% increase in a party’s share of the generic ballot has translated to an average 0.87% bump in the House popular vote. 2020, however, was a relatively bad year for the generic ballot: it overestimated the Democratic share by 4%, the biggest miss since the 2006 midterms.
Table 2: The generic ballot versus the two-party House popular vote (2004 – 2020)
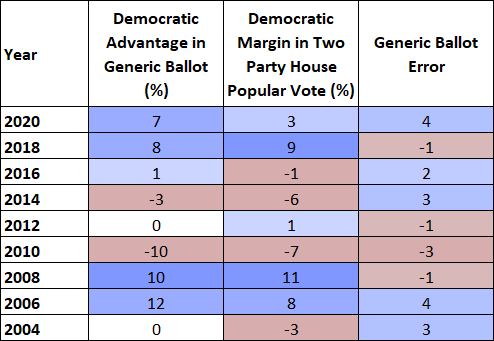
Source: RealClearPolitics
Figure 2: The generic ballot versus the two-party House popular vote (2004 – 2020)
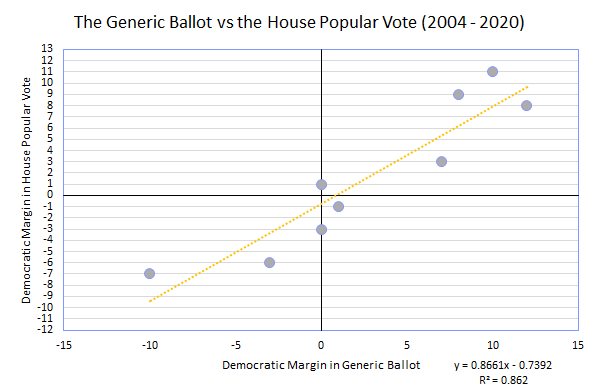
Source: RealClearPolitics
Finally, if we narrow the data even further to only midterm elections since 2004, as shown in Table 3 below, the polls have been similarly on target. Of course, a sample size this small introduces a high degree of uncertainty. However, taken along with the larger set of data going back to 1968, it’s clear that the generic ballot correlates with success in the election, and that relationship appears to be getting stronger.
Table 3: The generic ballot versus the two-party House popular vote in midterms (2006 – 2018)
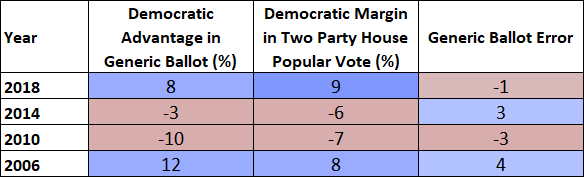
Source: RealClearPolitics
We haven’t seen any polling for the 2022 cycle yet, but it’s likely on its way. The first generic ballot polls for 2020 came in December of 2018, and the first ones for 2018 came at the start of 2017.
If history repeats itself, generic ballot polls will start to trickle out soon. And when they do, election-watchers should take note. Polls may be out of fashion after yet another rough presidential cycle, but they’re still the best tool we have.
| Seth Moskowitz is an elections analyst and freelance journalist. He also managed a Democratic California State Assembly campaign in 2020. You can read his nonpartisan analysis by subscribing to his free newsletter, Infinite Monkeys, and by following him on Twitter at @skmoskowitz. You can also email him at [email protected]. |