KEY POINTS FROM THIS ARTICLE
— While increasingly salient issues like abortion could change the political environment, Republicans still appear on track for a strong showing in the U.S. House.
— Recent midterms have hollowed out the presidential party’s holdings of districts where the president either did the same or worse than he did nationally — or only a little better.
— Republicans likely will have trouble winning districts where Joe Biden won more than 55% of the vote, but that still leaves them dozens of Democratic-held targets below that mark as redistricting is finalized.
Where midterm waves hit
Immediately following Republicans’ strong showings in the New Jersey and Virginia gubernatorial races last November, House Minority Leader Kevin McCarthy (R, CA-23) suggested that the results indicated that any district where Joe Biden won by 16 points or less would be competitive this year. He was referring to the margin Biden won in New Jersey in 2020, 57%-41%; a year later, Gov. Phil Murphy (D-NJ) won by just a little more than 3 points.
If this midterm looks like the previous 4, it may be that McCarthy wasn’t dramatically overstating things — not necessarily because Republicans will carry all those seats, but rather that Republicans, broadly speaking, could compete in many such seats if there’s a backlash against the president.
We are now less than half a year from the 2022 midterm elections. Our usual caveat is that a lot can change in that amount of time, and sometimes new developments can alter the political dynamic. The Supreme Court’s looming decision on whether to throw out Roe vs. Wade is certainly one of those. But along with that caution, there’s also the possibility that not much will change in the electoral environment between now and November. After all, 6 months ago — around the time of those aforementioned gubernatorial races in New Jersey and Virginia — President Biden’s approval rating, per the FiveThirtyEight average, was 43% approve/51% disapprove. Today it’s 42%/52%, slightly worse.
If the Democrats’ position does not improve, 2022 likely will be the fifth midterm in a row in which the non-presidential party has enjoyed a strong electoral environment. In those years, the opposition party won a clear House majority in each election: Democrats won 233 and 235 seats, respectively, in 2006 and 2018, and Republicans won 242 and 247 in 2010 and 2014, respectively (a majority is 218 seats). Republicans won 213 House seats in 2020, a high starting point for an opposition party trying to recapture the House majority in a midterm.
With all that said, and with McCarthy’s comments from several months ago in mind, we thought we’d take a look at those past midterms and assess the potential size of the House battlefield.
Those elections provide some clues as to how big a Republican wave, if it materializes, might be. What follows is a look at how the composition of the House changed in those 4 elections compared to the House results in the previous (presidential) election year. The primary question we’re trying to answer is this: In a wave-style midterm environment, as all 4 of the past midterms effectively were, how high can the wave go? What kinds of seats are truly vulnerable? With redistricting mostly but not entirely finished, we can take a closer look.
First, an explainer. The tables that follow categorize House districts by presidential performance. We used whatever share of the vote the presidential winner received nationally as effectively the midpoint for the tables, and then we included all the districts where the president did either a point better or a point worse than he did nationally along with it. Another term for this is what we call presidential deviation. Basically, this means how much more Democratic or Republican a district was compared to the nation in a given election, expressed in a whole number. So, for instance, Joe Biden got 51% nationally in 2020. A district where he got 53% would be D+2, and one where he got 49% would be R+2. These figures are also expressed in the tables. So the midpoint of each table is the R+1 to D+1 range (or 50%-52% Biden in 2020).
We then looked at districts where the president did 2-4 points better or 2-4 points worse than he did nationally, and so on and so forth until we reached districts where the president did either more than 10 points better or more than 10 points worse than he did nationally. In recent years, those kinds of districts have not been plausible targets for the other party. And districts that are a bit more competitive than that often aren’t plausible targets for the other side in a wave, either. The district-level data we used to compile the tables are primarily from Daily Kos Elections, which keeps an excellent history of presidential results by congressional districts. The data for the new districts completed this redistricting cycle are from Dave’s Redistricting App. There are a few other housekeeping notes included as an endnote below. [^]
With that, let’s take a look at what happened in 2006, 2010, 2014, and 2018.
2006
Table 1: House results by presidential margin, 2004 vs. 2006
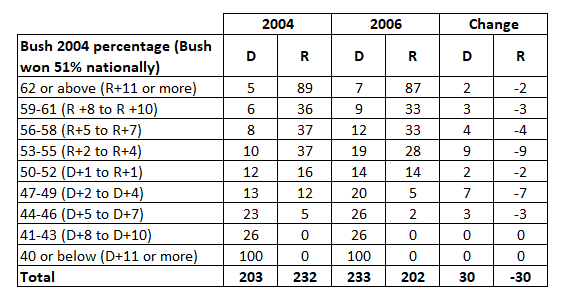
Even though this election was only about a decade and a half ago, the political landscape in the House was markedly different in 2006 than it is now. Democrats still retained a superior ability to win in unfriendly districts, both in the South — the one-time preserve for House Democrats — and elsewhere. For instance, Democrats won both at-large seats in the Dakotas in 2004, even as George W. Bush easily won each state.
Still, even in this different era, the bulk of Democrats’ 2006 midterm gains — 21 of 30 — came in districts where Bush won 55% of the vote or less (or less than R+5). Meanwhile, Democrats won 172 of the 179 districts where Bush received less than 50% of the vote, even as Republicans remained resilient in the districts that most closely matched the presidential vote, losing only 2 seats among that evenly-divided group. One striking feature of 2006 was that the Republicans held up reasonably well in some of the most competitive seats, but they easily lost the House anyway. This helped set up some of the Democratic gains in 2008.
2010
Table 2: House results by presidential margin, 2008 vs. 2010
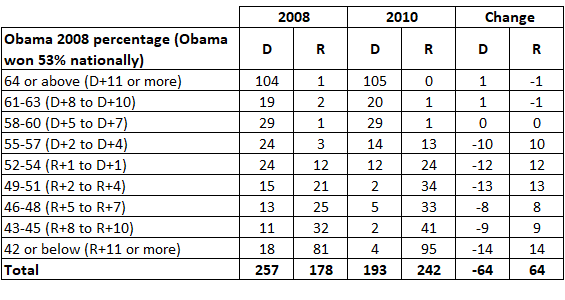
Republicans netted an impressive 64 seats in 2010, rebuilding quickly from their lopsided losses in 2006 and 2008. A lot of what happened in 2010 was realignment, as Democrats from very Republican-leaning seats were largely wiped out. About a third of the Republican gains (23 of 64 net) came in districts where Barack Obama won 45% of the vote or less: That includes the aforementioned Dakota seats, and many others in conservative-leaning turf. Those kinds of seats are basically sorted out now by presidential preference and are not compelling targets for either side.
Republicans did not flip any seats where Obama won 58% of the vote or more; the 2 they won in that election were districts they already held: Robert Dold (R) successfully defended IL-10 in the Chicago suburbs as an open seat, and Rep. Jim Gerlach (R, PA-6) defended his district in the Philadelphia area. Neither are in the House anymore, and Democrats hold versions of their old districts. Republicans did, however, flip 10 seats in the Obama 55%-57% range, although remember that Obama won 53% of the vote, so those seats were a little bit closer to the median than they would be now, because Biden won just 51% of the vote. Overall, the Republican wave crested at the D+4 mark.
2014
Table 3: House results by presidential margin, 2012 vs. 2014
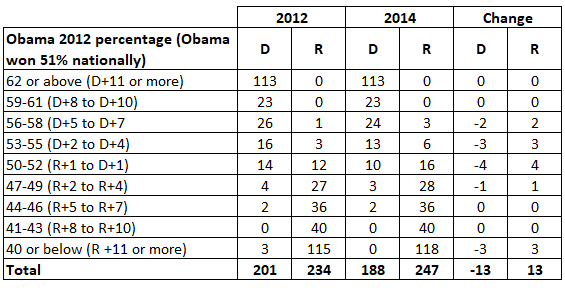
This midterm perhaps didn’t feel like a wave because Republicans only netted 13 additional seats compared to the previous election. But they also were starting from a high point (234 seats won in 2012) and the majority they did win, 247 seats, was the biggest the party had won since right before the Great Depression. Still, Democrats did not lose any seats where Obama got 59% of the vote or more — although they had a couple of very close calls — and Democrats only lost 9 where Obama got between 53%-58%. Otherwise, Republicans eliminated all the Democrats in seats where Obama got 43% or less, and they won all but 5 of the 227 districts where Obama won less than 50% of the vote. That there were so many of those districts — Obama got less than 50% in a clear majority of House districts despite winning 51% of the popular vote — speaks to the strength of the Republicans’ gerrymandering power in the post-2010 redistricting cycle, although court interventions would weaken the Republican edge in subsequent years.
2018
Table 4: House results by presidential margin, 2016 vs. 2018
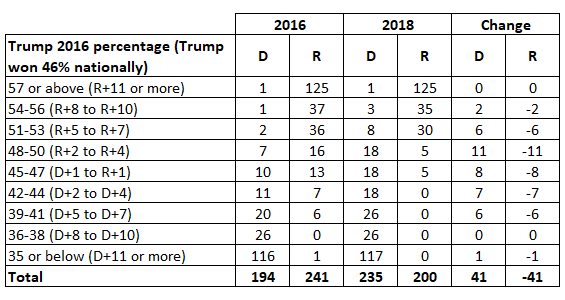
This table looks a little bit different than the others because the midpoint is lower — Donald Trump won just 46% of the vote in 2016, whereas the winners in the previous 3 elections won between 51%-53%. So the Trump 45%-47% range is the midpoint here. Still, what we see is that the Democratic gains came almost entirely in districts where Trump won 53% of the vote or less. Just 2 of their 41 net gains came in seats where Trump did better; Democrats also defended Rep. Collin Peterson (D, MN-7) in a district where Trump won 62%. He is the real outlier here, and he would lose in 2020. The “fake” outlier, as it were, is that lonely 1 in the Republican column among the districts where Trump won 35% of the vote or less. That is a Pennsylvania district, PA-5, that was changed in redistricting between 2016 and 2018. We used the maps in place at the time of the midterm election as a baseline, and that district was a Republican-held swing district during the 2016 election. For the purposes of this analysis, you can safely ignore it (had the 2018 lines actually been in place during the 2016 election, Democrats would have almost assuredly won the seat).
Overall, Democrats won all 187 districts where Trump received less than 45% of the vote, and Republicans won only 10 of the 233 where Trump won less than 51% of the vote.
Conclusion: Signs for 2020
McCarthy’s claim in the aftermath of last year’s elections that Democrats in Biden +16 seats are vulnerable actually squares somewhat with this history, although we would probably set the bar a little lower. It seems pretty hard for an opposition party to win districts where the president got 55% or more of the vote even in a midterm wave, although it does happen. But the lion’s share of the gains generally come below that mark.
Table 5 shows the presidential results by congressional district in the 2020 election under the old maps, and the current breakdown based on the finalized House maps for 2022.
Table 5: 2020 presidential results on old and new congressional maps
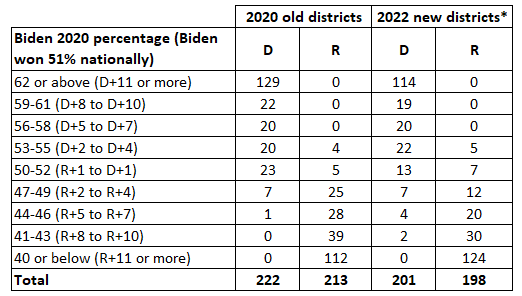
Note: *The list of 2022 districts excludes Missouri, New Hampshire, and New York, where redistricting is still ongoing.
Note that on the maps in place for 2020, Democrats won 51 seats in districts where Biden received 55% of the vote or less. We don’t think that overall number is going to be much different when the dust clears from redistricting.
There are still at least 3 states that do not have maps locked in place for 2022: Missouri (8 districts), New Hampshire (2 districts), and New York (26 districts). We say “at least” because there may be alterations to other maps; for instance, there is ongoing legal action in Kansas and Florida against Republican-drawn maps in those states. For now, we are using the lines in those states as currently drawn.
None of the Missouri seats are likely to be truly competitive, and we expect a 6-2 Republican map. In New Hampshire, one or both of the Democratic-held seats could be very competitive: State Republicans want to make one more easily winnable for Republicans at the expense of targeting the other; Gov. Chris Sununu (R-NH) wants a more status quo map. New York is much harder to handicap: The state’s highest court threw out a Democratic gerrymander there. One possible outcome is that the state eliminates a Republican-held upstate district but makes it harder for Democrats to hold all of the 19 seats they currently hold.
With that in mind, let’s look at the bottom line here. Under the new lines and as reflected in Table 5, there are 153 districts where Biden got more than 55% of the vote. We can say with some confidence that Democrats will get an additional 2 such seats from Missouri and a dozen or more from New York. For the sake of argument, let’s say 15 Biden 55%+ seats in New York, one fewer than now.
That’s 170 Democratic seats where Republicans will have a hard time competing, although they may be able to put a few truly in play: We do list a handful of seats Biden won with more than 55% of the vote as Likely Democratic in our ratings.
That leaves 48 seats in Table 5 where Biden got 55% or less. Again, just in the interest of trying to paint a more complete picture here, let’s assume that 4 current Democratic seats in New York end up below that mark as well as both seats in New Hampshire. That would be 54 seats within the truly vulnerable range for Democrats. Meanwhile, Democrats may be able to put a few of the Democratic-leaning Republican seats in play. Even in wave years, the party on the wrong side of the wave usually wins at least one seat held by the other party (2006 is a rare exception).
The 13 Democratic-held districts where Biden won less than 50% could very well all flip in this election, or at the very least we should expect many of them to based on the recent midterm history described above and assuming a good Republican environment. Four of these are redrawn seats in Georgia, Florida, and Tennessee that were designed by Republicans to flip and are virtually guaranteed to (Democratic incumbents are not defending them).
Beyond that, history suggests that Republicans should be able to take a considerable bite out of the Democratic tally in the districts Biden won 50%-55% of the vote. How big a bite is the main House question for 2022.
Endnote
[^] We computed the data in the various categories by rounding to the nearest whole number. For each midterm year, we used the maps in place during that midterm year. In 2010 and 2014, no maps changed between the midterm and the preceding presidential election. In 2006, maps changed in Georgia and Texas from the previous election, and they changed from 2016 to 2018 in Pennsylvania. For our calculations, we assumed the new maps were in place for the previous presidential election. We didn’t think this materially changed our analysis because of the small number of districts that were redrawn. Changes reflected in the tables compare the House elected in November of the presidential year to November of the midterm year. We do not have 2020 presidential numbers for Kentucky, but we don’t expect any of the state’s 6 seats to be competitive and we categorized the state’s districts in Table 5 based on the 2016 presidential results and other analysis. In 2006, we did not categorize the Democrats winning Vermont’s at-large seat as a party flip, because independent Bernie Sanders — who left the seat behind to successfully win a Senate seat — caucused with Democrats in the House. For the new congressional districts, we made some judgment calls about which party should be considered the incumbent party; for new districts added to states, we generally let the district’s partisan lean determine which party would be the “incumbent” party. These judgments apply to the 2022 new districts portion of Table 5.
