| Dear Readers: On the latest episode of our Politics is Everything podcast, former Virginia U.S. House Reps. L.F. Payne (D) and Barbara Comstock (R) discuss a new survey on the perspectives, beliefs, and experiences of former members of Congress, with a specific focus on concerns about violence in 2024. Payne and Comstock are, respectively, the president and president-elect of FMC, the association for former members of Congress, which conducted this survey of former members with the University of Massachusetts Amherst UMass poll. Alexander Theodoridis, the UMass Poll’s co-director who also joins this conversation, was the Center for Politics’s first chief of staff.
In today’s Crystal Ball, we take a look at President Biden’s approval rating and how it compares to Donald Trump’s at this time four years ago, as well as yesterday’s important court ruling in New York, which could eventually help Democrats in their bid to win back the U.S. House majority next year. This is our only planned issue of the Crystal Ball this week. — The Editors |
Biden’s approval lags Trump’s from four years ago
Former President Donald Trump never had a particularly good approval rating, although as of mid-December 2019—the same point in Trump’s presidency as President Joe Biden is in now—his average approval rating was better than Biden’s.
Per the FiveThirtyEight average, Trump’s approval rating was 42% approve/53% disapprove on Dec. 13, 2019. Biden’s approval in that average this morning (Wednesday, Dec. 13, 2023) is 38% approve and 56% disapprove. So it’s similar to Trump, but worse. At the time, Trump seemed imperiled but alive in his reelection bid; we’d use the same description for Biden’s chances now.
While one can cut polling numbers all sorts of different ways to illustrate differences in levels of support, we wanted to look at a fairly basic demographic trait to try to see why Trump’s numbers were better than Biden’s. So we took a few well-known national polls that measured presidential approval both in late 2019 and also recently in 2023 and looked at approval by party—self-identified Democrats, Republicans, and independents. Table 1 shows polls from Quinnipiac University, YouGov, and Gallup of Trump’s approval in late 2019 and Biden’s approval recently (details and links to the polls are in the sources underneath Table 1).
Table 1: Trump 2019 approval vs. Biden 2023
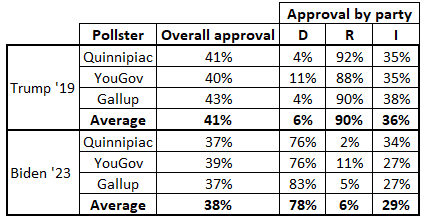
Source: 2019 Trump approval polls: Quinnipiac University poll of self-identified registered voters conducted Dec. 4-9, 2019; YouGov poll of adults conducted Dec. 12-14, 2019; Gallup poll of adults conducted Nov. 1-14, 2019. 2023 Biden approval polls: Quinnipiac University poll of self-identified registered voters conducted Nov. 9-13, 2023; YouGov poll of adults conducted Dec. 2-5, 2023; Gallup poll of adults conducted Nov. 1-21, 2023
Conveniently, the three pollsters we chose, on average, produced approval numbers for Trump in 2019 and Biden here in 2023 that were pretty similar to the overall FiveThirtyEight average, which includes many more polls than just the ones listed here.
A few things stand out:
— Biden’s lower approval is not driven by a higher level of antipathy from the other side. Across the three polls from both 2019 and 2023, the opposition party had extremely low approval of the sitting president from the other party: Just 6% of Democrats approved of Trump in late 2019, and just 6% of Republicans approve of Biden in late 2023. The polls vary a bit in their findings—YouGov finds a bit more cross-party support than the other two pollsters—but the overall takeaway is clear. This utter lack of cross-party approval has become a familiar trend in presidential approval polling.
— Biden is weaker than Trump with independents. Trumps’s average approval with independents was just 36%, but Biden’s is a weaker 29%. One commonality between the two is that both held approval ratings with independents that were worse than their overall approval.
— The most significant finding, though, is that Trump was stronger with his own party than Biden currently is with his. Trump had the approval of 90% of Republicans, while Biden has the approval of just 78% of Democrats. This is the biggest difference between the three party categories: Biden’s approval share from Republicans is the same as Trump’s share of Democrats, while Biden’s approval is 7 points worse with independents but 12 points worse with Democrats than Trump’s respective independent and Republican shares.
In the actual 2020 election, Biden won the two-party national vote roughly 52%-48% over Trump. According to Catalist, a Democratic data firm that produces respected estimates of the size and voting behavior of different demographic groups, Biden won 91%-9% in the two-party vote amongst voters Catalist modeled as Democrats, Trump won 89%-11% among modeled Republicans, and Biden won 52%-48% among those they modeled as being in the middle of the electorate. The traditional exit poll, conducted by Edison Research for a variety of media outlets, had Biden winning 94%-5% among Democrats and 54%-41% among independents, while Trump won Republicans 94%-6%.
Ultimately, we’d expect the Biden non-approving Democrats to come home in the actual election. The independents are probably harder to figure out, and they very well may decide the election either through their ultimate choice between the two major party nominees—or whether they disproportionately back third party candidates or stay home.
The post-New York redistricting picture
Democrats scored a potentially important court victory in the redistricting wars Tuesday afternoon, as New York’s highest court reopened the congressional redistricting process there. Lying at the end of the road there could be a new Democratic gerrymander in a state where Democrats need to make House gains in order to win back the chamber, but there is a complicated and uncertain path to that outcome.
Some history is in order. Back in 2014, New York voters approved the creation of a redistricting commission. The 10-member commission is made up of eight members selected by party leaders in the state legislature (four chosen by Republicans and four chosen by Democrats). Those eight members then select the final two members, neither of whom can be a registered Republican or a Democrat. So this is supposed to be a commission that neither party controls.
The commission then creates a map and submits it to the legislature. If the legislature rejects it, the commission submits a second map. If the legislature rejects that map, the legislature can then effectively create its own map. So one can see how this could ultimately lead to a Democratic gerrymander—the Democratic-controlled state legislature could just swat down both map proposals and then go hog wild, at least hypothetically (or the commission could just fail again, in a repeat of 2022). Democrats have the requisite two-thirds majorities in each state legislative chamber to adopt maps; Democrats tried to get voters to make it easier for them to change the maps, but voters rejected that effort in a 2021 statewide vote.
Back in the post-2020 census process, the commission deadlocked and did not produce a map. Democrats responded by passing what we and others called the “Hochulmander” (after Democratic Gov. Kathy Hochul, who was a driving force behind the gerrymander). This map was designed to allow Democrats to win 22 of the 26 House districts in the state. However, the state’s highest court (called the New York Court of Appeals, which is the same court that issued the Tuesday ruling), threw out that map, ruling that the Democratic map went too far. The 2014 constitutional amendment added language to the state constitution stating that districts should be “as compact in form as practicable” and “shall not be drawn to discourage competition or for the purpose of favoring or disfavoring incumbents or other particular candidates or political parties.” So this language gives Republicans some potential recourse if the Democrats try Hochulmander Part Deux.
The court that issued the 2022 decision was made up of all Democratic appointees, just like this one, but the composition of the court has changed a bit, helping turn a 4-3 majority against the Democratic position last year into a 4-3 majority for it this year. The circumstances are different, and also more complicated, but there are similarities to what happened in North Carolina the past couple of years. There, a Democratic-controlled state Supreme Court intervened against a Republican gerrymander and imposed a relatively balanced map for 2022. That court flipped to Republican control in the 2022 elections, and it then opened the door to a Republican gerrymander that will transform that state’s currently 7-7 split U.S. House delegation into one that is, at bare minimum, 10-4 Republican. These state-level machinations could be avoided if there were national standards for congressional redistricting that prioritized fair maps—alas, neither Congress nor the courts have imposed such standards.
A court-appointed special master ended up drawing the map that was used for 2022. A balanced map combined with a red wave-style environment in New York allowed Republicans to win 11 of the state’s 26 seats, a 15-11 Democratic advantage that was a far cry from the Hochulmander’s desired 22-4 outcome and down considerably from the 19-8 edge Democrats won statewide in 2020 (New York lost a seat in the 2020 census reapportionment). It’s not entirely clear if, given the political environment, Democrats actually would have realized that 22-4 statewide edge last year. For instance, one of the most eye-popping parts of the Hochulmander involved connecting Republican-leaning Staten Island, which is represented by Rep. Nicole Malliotakis (R, NY-11), with the very Democratic Park Slope neighborhood in Brooklyn (as opposed to the more marginal Brooklyn areas that have been part of the district). That would have transformed NY-11 from a district Donald Trump won by 11 points on the 2010s map to one Joe Biden would have carried by almost 10 points. However, even under the Hochulmander lines, the district would have been very close in both the 2022 gubernatorial and Senate races, meaning that Malliotakis might have hung on anyway (as it was, she got a Trump +8 district and easily dispatched former Democratic Rep. Max Rose, who she unseated in a much more competitive race in 2020).
Democrats wouldn’t need to recreate the Hochulmander, though, to help themselves in New York. Frankly, they very well could have credibly targeted five Republican seats on the 2022 map if it remained in place: upstate first-term Republican Reps. Mike Lawler (NY-17), Brandon Williams (NY-22), and Marc Molinaro (NY-19) all hold Biden-won seats and won by less than 2 points in 2022. There is also the looming special election in Nassau County-based NY-3, a Biden +8 seat previously held by expelled Rep. George Santos (R), as well as another Nassau-based seat, NY-4 held by Rep. Anthony D’Esposito (R), which based on 2020 presidential results is the bluest seat held by any Republican in the country (Biden +15). We rated all of these districts as Toss-ups based on the current map. (The NY-3 special will occur on this map and is unaffected in the short term.)
What could eventually happen is that Democrats are able to gerrymander New York in a more subtle way and give themselves a better chance in at least some of these aforementioned seats, without resorting to the kind of dramatic remap that might threaten Malliotakis or Rep. Nick LaLota (R, NY-1), who represents a very marginal Biden-won seat on Long Island that, like NY-11, was much bluer on the Hochulmander. But big changes to both of those districts could happen too—we have already seen what that could look like, and then it would just be a matter of whether this court would allow it.
For now, we are not changing any ratings in response to this ruling, because as we explained above, there are still a lot of moving pieces and an uncertain eventual outcome. But the end result could help Democrats regain several seats in New York in the 2024 elections—and given how close the House is and might be in next year’s elections, every single seat is important.