| Dear Readers: This is the latest edition of the Crystal Ball’s “Notes on the State of Politics,” which features short updates on elections and politics.
— The Editors |
Youngkin’s barrage tests efficacy of early ads
Part of the reason that Glenn Youngkin was an appealing candidate to Virginia Republicans was his ability to pump his own considerable personal largesse into his gubernatorial campaign. He has not disappointed: Youngkin. a former co-CEO of investment firm the Carlyle Group. is currently dominating the Virginia airwaves while the Democratic nominee, former Gov. Terry McAuliffe, is largely holding back. Mark Murray of NBC News noted earlier this week that the result has been a Youngkin edge of 40 to 1 on advertising since the start of the general election campaign (McAuliffe easily won his party’s nomination on June 8, setting up the McAuliffe vs. Youngkin battle).
Murray, citing numbers from Adimpact, wrote that Youngkin has spent more than $2.2 million on ads since early June, including more than $1.5 million in the expensive Washington DC media market, while McAuliffe has spent only $55,000 so far (all on digital). McAuliffe did spend nearly $6 million during the primary, leaving nothing to chance against an overmatched, splintered field of rivals. McAuliffe is a prodigious fundraiser in his own right, but it seems very likely that he will be outspent by Youngkin overall. One other thing to remember is that the Republican Governors Association usually has more money than its counterpart, the Democratic Governors Association, which means that Republicans could have an edge in outside money in this race as well depending on how both sides decide to allocate their resources.
But what is the value of Youngkin’s early ad-spending? On this, one might find a disagreement between some political operatives and some political scientists.
There are some operatives who believe that early ad spending can help define a candidate positively and protect them from negative attacks later on. A recent, anecdotal example of this we have heard from professionals on both sides is the campaign of now-Sen. Kyrsten Sinema (D-AZ). Sinema did not have to worry about her primary in 2018, so she spent the months leading up to Arizona’s August primary bolstering her image while her opponent, Martha McSally (R), had to tack to the right in her own primary, which she ended up winning convincingly but which she could not take for granted. By the time the November campaign started in force, Sinema had positively presented herself to Arizonans, arguably taking some bite out of Republican ads that sought to portray her as radical.
Youngkin is effectively trying to do the same thing in his general election advertising; one recent spot shows him talking to small groups about how party labels don’t matter in everyday life. These ads aren’t particularly memorable, but the message is clear: Youngkin is pitching himself as a centrist, just like Sinema did. Once the negative ad wars engage, McAuliffe and Democrats surely will argue that Youngkin, who was supportive of Donald Trump during the gubernatorial primary season and emphasized the importance of so-called election integrity, is more conservative than his advertising suggests. Youngkin’s campaign will hope the investment now protects him later.
However, there is some political science research that indicates any effect from early campaign ads is fleeting. A new paper by John Sides, Lynn Vavreck, and Christopher Warshaw on advertising in thousands of races ranging from presidential races to down-ballot elected statewide offices from 2000 to 2018 found that to the extent an advertising edge has an effect, that effect is greater closer to the actual election. “Advertising before Labor Day does not appear to affect election outcomes,” they write. On the other hand, the same paper does indicate that an advertising advantage is more meaningful in non-presidential races. So if Youngkin can maintain an edge — obviously, such an advantage will be way smaller than what he has currently — that may pay some dividends down the stretch.
Youngkin’s early spending edge reminds us in some ways of the 2010 California gubernatorial race, in which a free-spending former CEO, Meg Whitman (R), ran against a former governor, Jerry Brown (D). This Virginia race also features a wealthy former business leader versus a former governor. Whitman spent an astounding $177 million to Brown’s $36 million, but Brown ended up winning by 13 points. Despite Whitman’s huge overall edge, Brown was able to largely keep pace with Whitman in television advertising in the final four weeks of the campaign — in other words, closer to Election Day, when advertising is likely more important, as noted by the study cited above. Of course, California even back then was a markedly bluer state than Virginia is now, although going into that election, Republicans had won eight of the last 12 gubernatorial races there (including the recall of Democratic Gov. Gray Davis in 2003).
In any event, Youngkin’s ad-spending edge merits watching. The Crystal Ball has consistently rated Virginia’s gubernatorial race as Leans Democratic. Had Republicans nominated a fringy candidate in its early May nominating process, such as very conservative state Sen. Amanda Chase (R), we would have considered pushing the race to Likely or even Safe Democratic. But Youngkin is a credible nominee, if also an unproven one. As of now, we would still rather be McAuliffe in this race, but it wouldn’t surprise us at all if this race ended up being similar to McAuliffe’s initial 2.5-point victory in 2013, or if Youngkin won outright. If Youngkin does spring an upset, the seeds of his victory may have been planted in June, although it’s also an open question as to whether his ad spending now will matter later.
First impressions of Colorado’s map draft
Last week, Colorado became the first state of the post-2020 redistricting cycle to release an official draft of a congressional map. Like several other western states, Colorado’s redistricting process is now controlled by an independent commission. At a June 23 teleconference, commissioners stressed that the proposed map will not be the final product; over the coming months, they’ll be accepting input from the public. Moreover, the commission drew its districts based on unofficial population estimates — the Census Bureau will not even be releasing the official numbers until later this summer. So, more than anything else, the proposed Colorado map will be a starting point for discussion — but it still merits a detailed look.
Colorado’s recent population gains have made its redistricting process more consequential this cycle: it was one of the fewer-than expected states that gained representation after the most recent round of reapportionment. Next year, it will send eight members to the House, up from the current seven.
On Map 1, the left images show the current map, while the images on the right are the proposed new version. The maps are colored by 2020 presidential partisanship (this handy interactive tool from Garrett Herrin has other partisan data).
Map 1: Current vs proposed Colorado maps
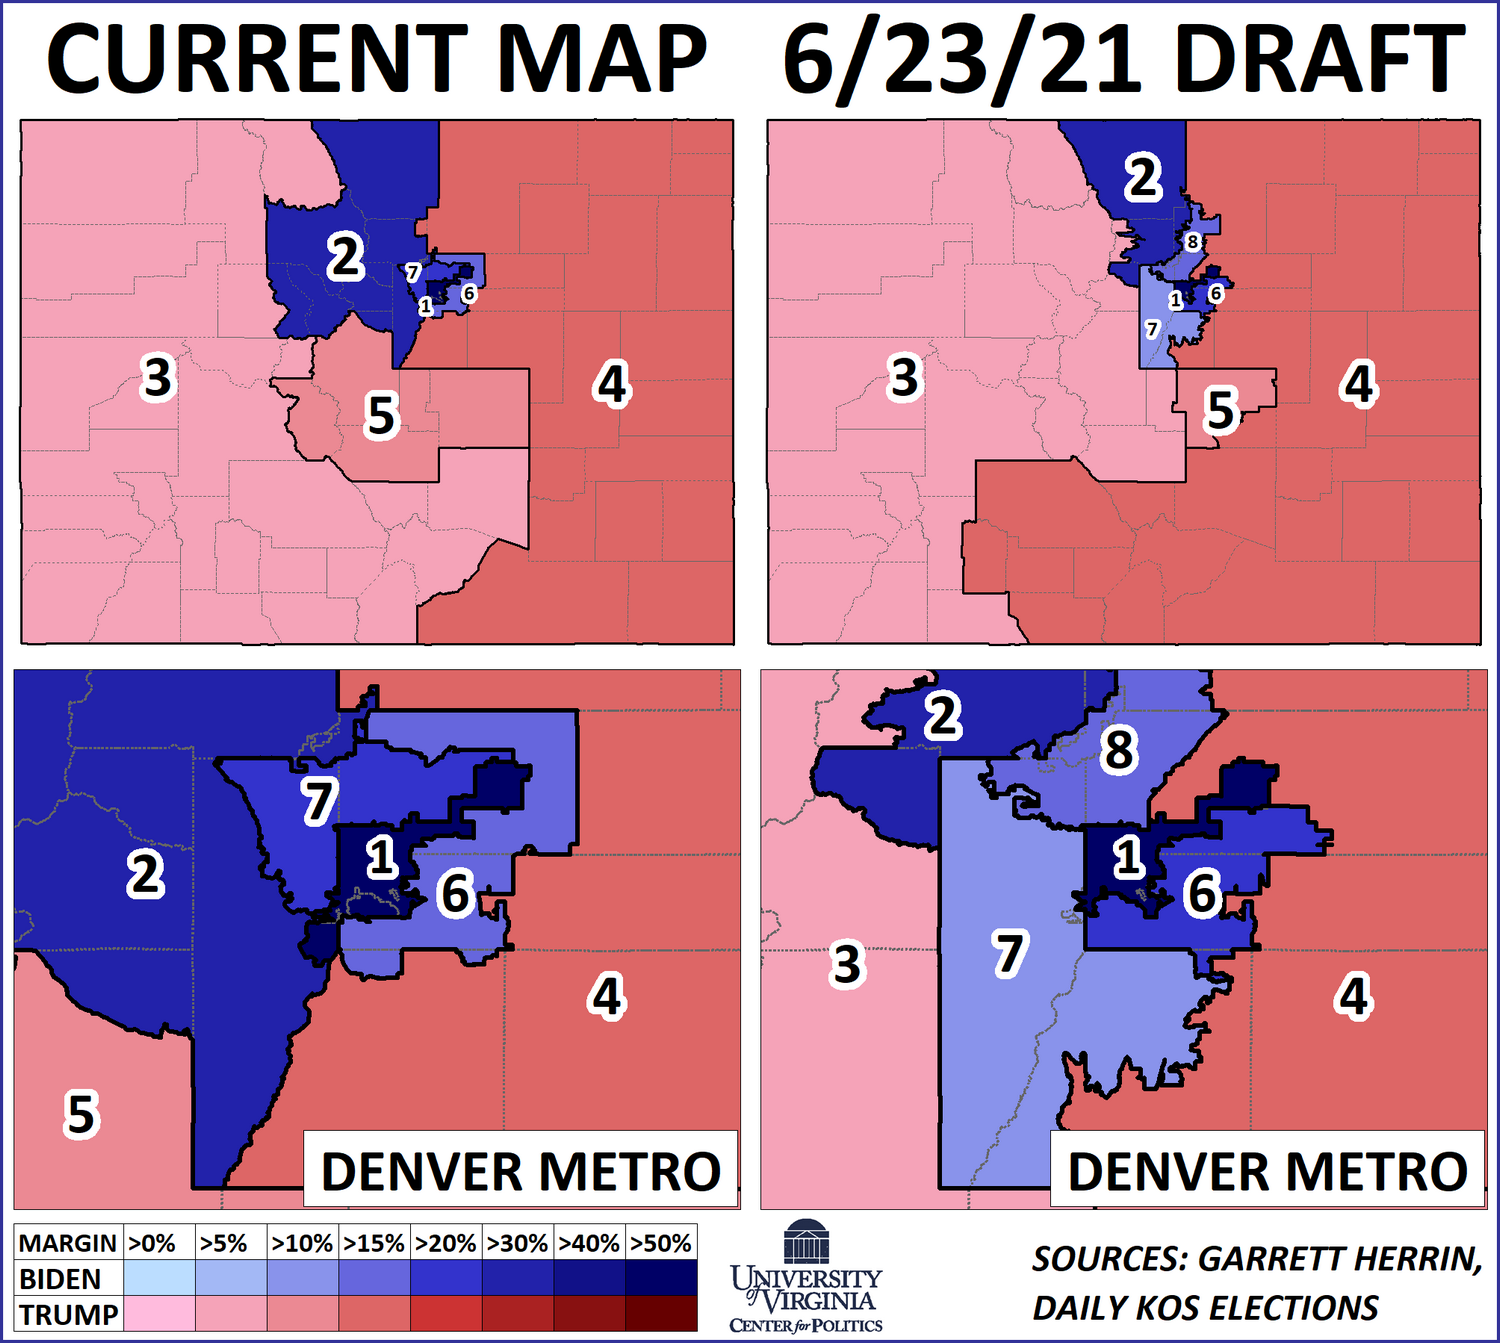
Between the maps, there are some districts that don’t change much. As it’s been for many decades, 1st District, held by 13-term incumbent Democrat Diana DeGette, is essentially coterminous with the city of Denver. Just to the south, Rep. Jason Crow’s (D, CO-6) district is still anchored in blue-trending suburbs, such as Aurora and Littleton. From 2012 to 2018, Republicans held the current CO-6, and it was a perpetual Democratic target. But the new version would have given President Biden 60% in 2020 — so Republicans will likely not be too invested in recovering it. North of the Denver metro, the 2nd District, held by Rep. Joe Neguse (D, CO-2), includes the liberal bastion of Boulder, as well as Fort Collins. All three seats, assuming they stay similar, would be safely Democratic.
In Republican-held districts, the commission made some new aesthetic choices. Rep. Lauren Boebert (R, CO-3), who has become something of a lightning rod for Democratic criticism, retains a Western Slope-based district. Under the draft map, though, a handful of counties in south-central Colorado are shifted into Rep. Ken Buck’s (R, CO-4) district. Pueblo County, the most populous of this bunch, has been in a western-based version of 3rd District since the 1980 round of redistricting. The counties that were shifted from CO-3 to CO-4 have high Hispanic populations, but are, electorally, a mixed bag: Pueblo, for instance, is a rare Obama-Trump-Biden county while Alamosa was Colorado’s sole Clinton-to-Trump county. As an aside, Armin Thomas, at Elections Daily, has covered this politically unique area extensively.
Perhaps counterintuitively, even as the state added a district, both districts 3 and 4 became even more geographically vast — on the proposed map, they combine to account for about 93% of the state’s land area, compared just under 85% for the current map. While this doesn’t radically alter the partisanship of the districts (though Boebert gets a slight boost, which could matter if her race ends up being competitive), this type of expansion could be a trend in other states: as these rural districts have seen relatively slow population growth, they’ll necessarily have to expand.
But not all Republican-held seats are getting larger. CO-5 has included Colorado Springs, one of the more conservative cities in the country, ever since Colorado was awarded a fifth seat, after the 1970 census. Because of the city’s robust growth, CO-5 is now entirely contained within El Paso County. Though there are some promising longer-term trends for Democrats in the area — in 2020, Trump’s margin in El Paso County was cut in half, shrinking to 11% from 22% — this version of CO-5 should be a firm GOP seat for at least a few more cycles.
The commission suggested that the new 8th District was drawn with the Hispanic community in mind. The proposed CO-8 is a northern Denver-area district — it includes fast-growing suburbs like Arvada and Westminster, then reaches upward towards Greeley. Notably, CO-8 is 29.9% Hispanic by composition, a higher share than any other urban district on the map. Still, the adjacent CO-1 has only a slightly lower Hispanic share, 28.6% — if the commission was trying to ensure a Hispanic candidate is elected, CO-8 could have easily added some Denver precincts. Either way, in statewide elections, the new CO-8 would track slightly leftward of Colorado as a whole: Biden took 56.5% there, compared to 55.4% overall. So in other words, we’d expect Democrats to take this seat.
While the placement of the new CO-8 was certainly something that was on the minds of political observers, the proposed CO-7 may be the district that gets the most attention. In fact, of the current seven seats, CO-7 has the least overlap between the present version and the proposed draft: both iterations include suburban cities in Jefferson County, but CO-7 completely drops its holdings in Adams County, while picking up much of Douglas County, a GOP-leaning county south of Denver. These trades cut Biden’s margin in CO-7 from 23% down to about 10%, making the new seat more Republican than Colorado as a whole. In addition to taking on a fairly new — and more competitive — seat, Rep. Earl Perlmutter (D, CO-7) only barely lives within the borders of his proposed seat.
If Republicans end up winning a Colorado district outside the three that they currently hold, the obvious target would be the new 7th, though longer-terms trends suggest that the seat is drifting Democratic. Map 2 considers the aggregate vote between Jefferson and Douglas counties — the draft CO-7 covers substantial portions of both counties, while Map 2 considers them in their entirety.
Map 2: Jefferson and Douglas Counties, 2008 and 2020
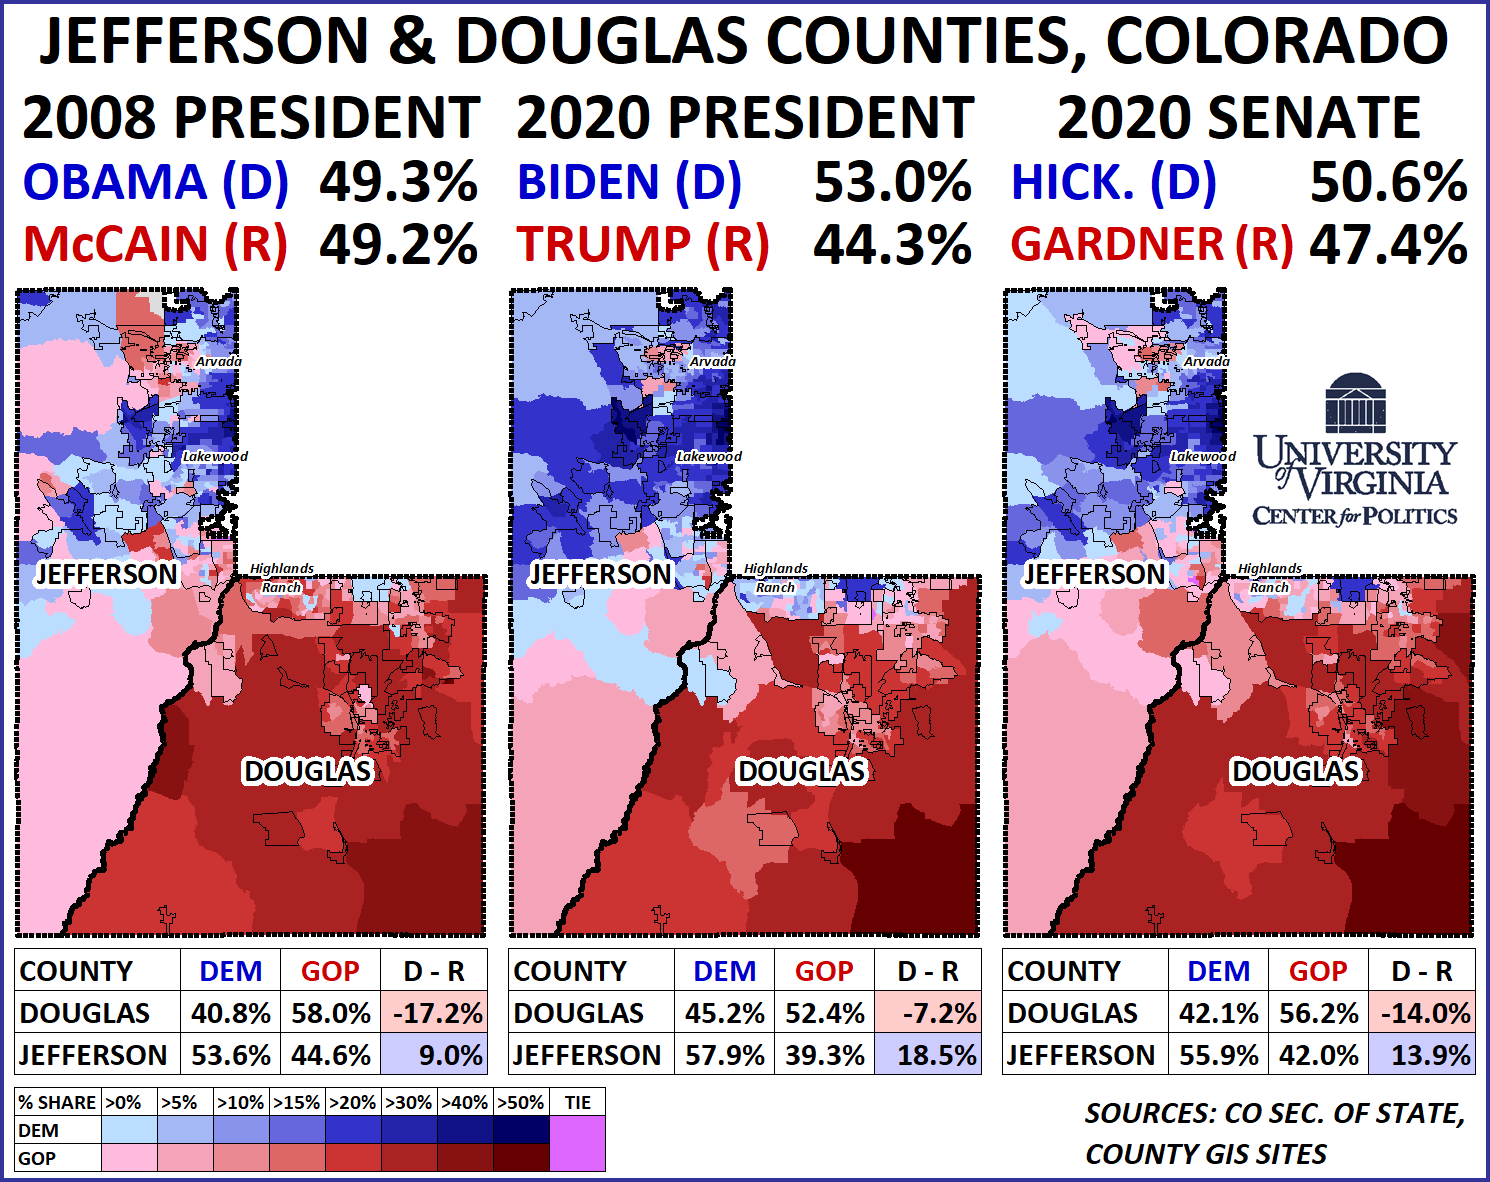
In 2008, though Obama’s 54%-45% margin in Colorado represented the best showing for a Democratic presidential nominee there since Lyndon Johnson, he came close to losing the county pair — he carried it by 382 votes, out of the nearly 447,000 votes cast. Last year, as Biden performed about 4.5% better than Obama statewide, he carried the pair by a much more comfortable 53%-44%. Down the ballot, the more telling result from 2020 may have been the Senate race: then-former Gov. John Hickenlooper (D-CO) ousted then-Sen. Cory Gardner (R-CO) by 9% statewide, basically matching Obama’s 2008 showing. Hickenlooper carried Jefferson and Douglas counties by just over three points, showing the area has moved left, relative to the state.
Republicans had more success in the Jefferson/Douglas pair in the cycles between 2008 and 2020, but the trend has been clear. Though Trump carried the duo in 2016 by two percentage points, it represented a decline from the 52%-46% vote Mitt Romney received in 2012.
At a more granular level, Highlands Ranch, the most populous community in Douglas County, is also illustrative of how some formerly-deep red parts of this area have moved. Thirteen years ago, McCain won 55%-44% there — in 2020, Biden carried this wealthy community 52%-47%. While Gardner won Highlands Ranch, his 2.5% margin was considerably lower than McCain’s.
Ironically, the commission-drawn CO-7 is very similar to a version of CO-6 that Republicans tried to enact after the 2000 round of redistricting. When the governor and legislature couldn’t agree on a plan in 2001, courts stepped in and enacted a map. After the 2002 elections, though, Republicans won full control of state government, and tried to push a more partisan redistricting plan. Though the Republican plan was ultimately struck down based on state law, it featured a version of CO-6 that mainly consisted of Jefferson and Douglas counties. Of course, almost 20 years ago, such a district would have been strongly Republican — it speaks to how much the area has changed that, to win a comparable seat today, Republicans would probably need a quality recruit, a modicum of suburban reversion, a favorable national environment, or all three.
While the districts will probably change over the next few months, as the draft is updated, from a purely partisan perspective, the map seems to be a fair reflection of Colorado as a whole: Democrats would be favored in four districts, Republicans in three, while the final district (CO-7) is increasingly leaning blue, but would not be out of reach for Republicans if enough factors fall into place.